Bitcoin (BTC) has the potential to reach new all-time highs by June this year, according to network economist Timothy Peterson, should historical trends hold true.
Data shared on social media on March 15 indicates that BTC/USD has around two and a half months left to surpass its previous record of $109,000.
April may trigger a 50% increase in BTC pricing
Bitcoin saw a 30% decline after reaching a peak in mid-January. This level of drop is typical of corrections seen in bull markets, and Peterson is optimistic about a rebound.
“At the moment, Bitcoin is trading near the lower end of its historical seasonal range,” he noted, referencing a chart that compares various BTC price cycles.
“Almost all of Bitcoin’s annual gains are realized in the two months of April and October. It’s quite conceivable that Bitcoin could achieve a new all-time high before June arrives.”
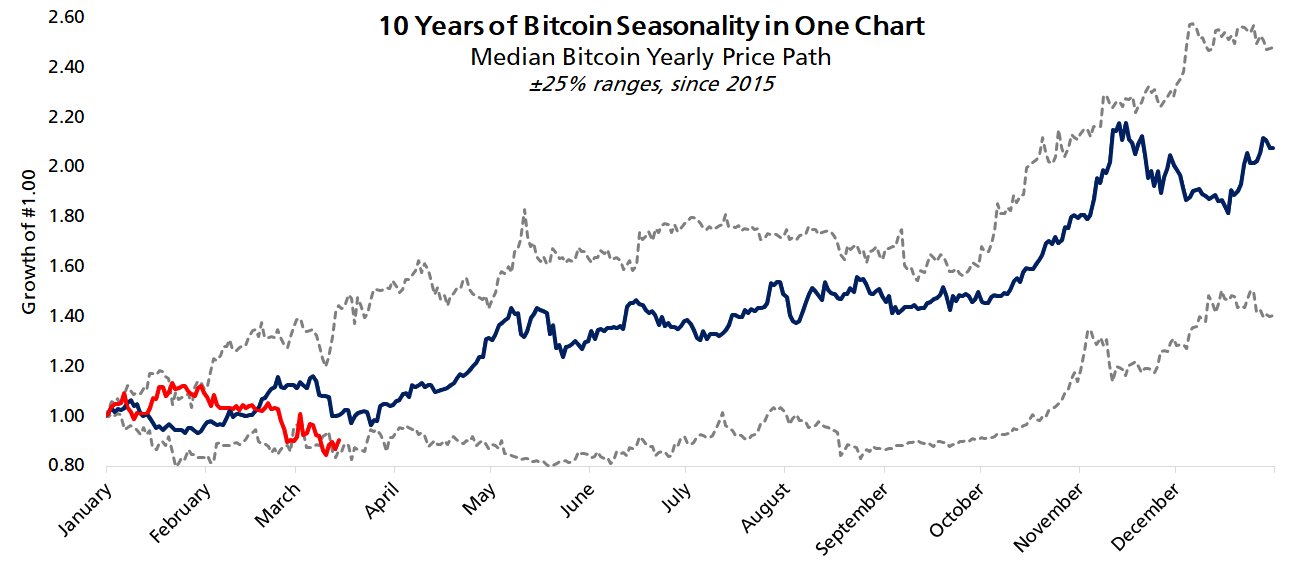
Comparison of Bitcoin seasonality.
Over the years, Peterson has developed multiple Bitcoin price metrics, one of which, called Lowest Price Forward, has accurately identified levels that BTC/USD rarely drops below once surpassed.
Following its recovery from significant lows in March 2020, this metric predicted that BTC would not drop below $10,000 again starting in September.
Additionally, a new potential support level of $69,000 has emerged this year, with reports suggesting a “95% chance” it will hold.
Peterson further posited a median target of $126,000 with a deadline set for June 1.
Alongside a chart reflecting the performance of an initial $100 investment in BTC, he highlighted that periods of lackluster performance in bull markets have historically been short-lived.
“Bitcoin’s average time spent below trend is about four months,” he explained.
“The dotted red trend line indicates $126,000 by June 1.”
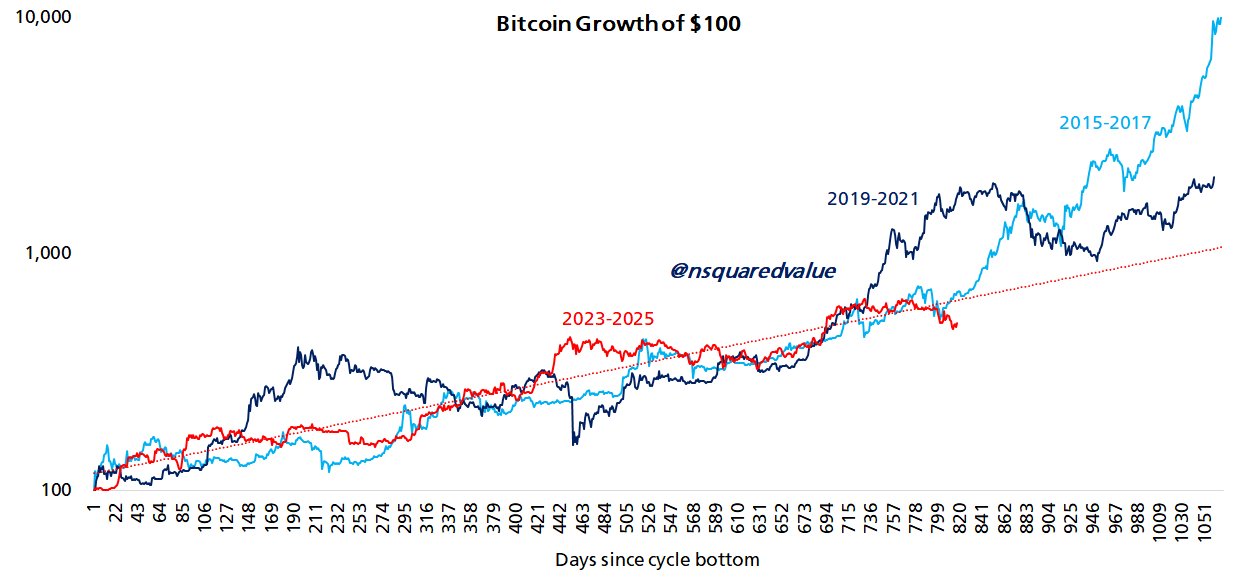
Growth of a $100 investment in Bitcoin.
A typical decline in Bitcoin bull markets
Related: Keep an eye on these Bitcoin levels as BTC approaches key $84K resistance.
“You really don’t need to reference past BTC bull runs to see that corrections are an integral part of the cycle,” stated popular trader and analyst Rekt Capital in a recent analysis on social media.
Rekt Capital pointed out five significant pullbacks in the current cycle alone, tracing back to the beginning of 2023.
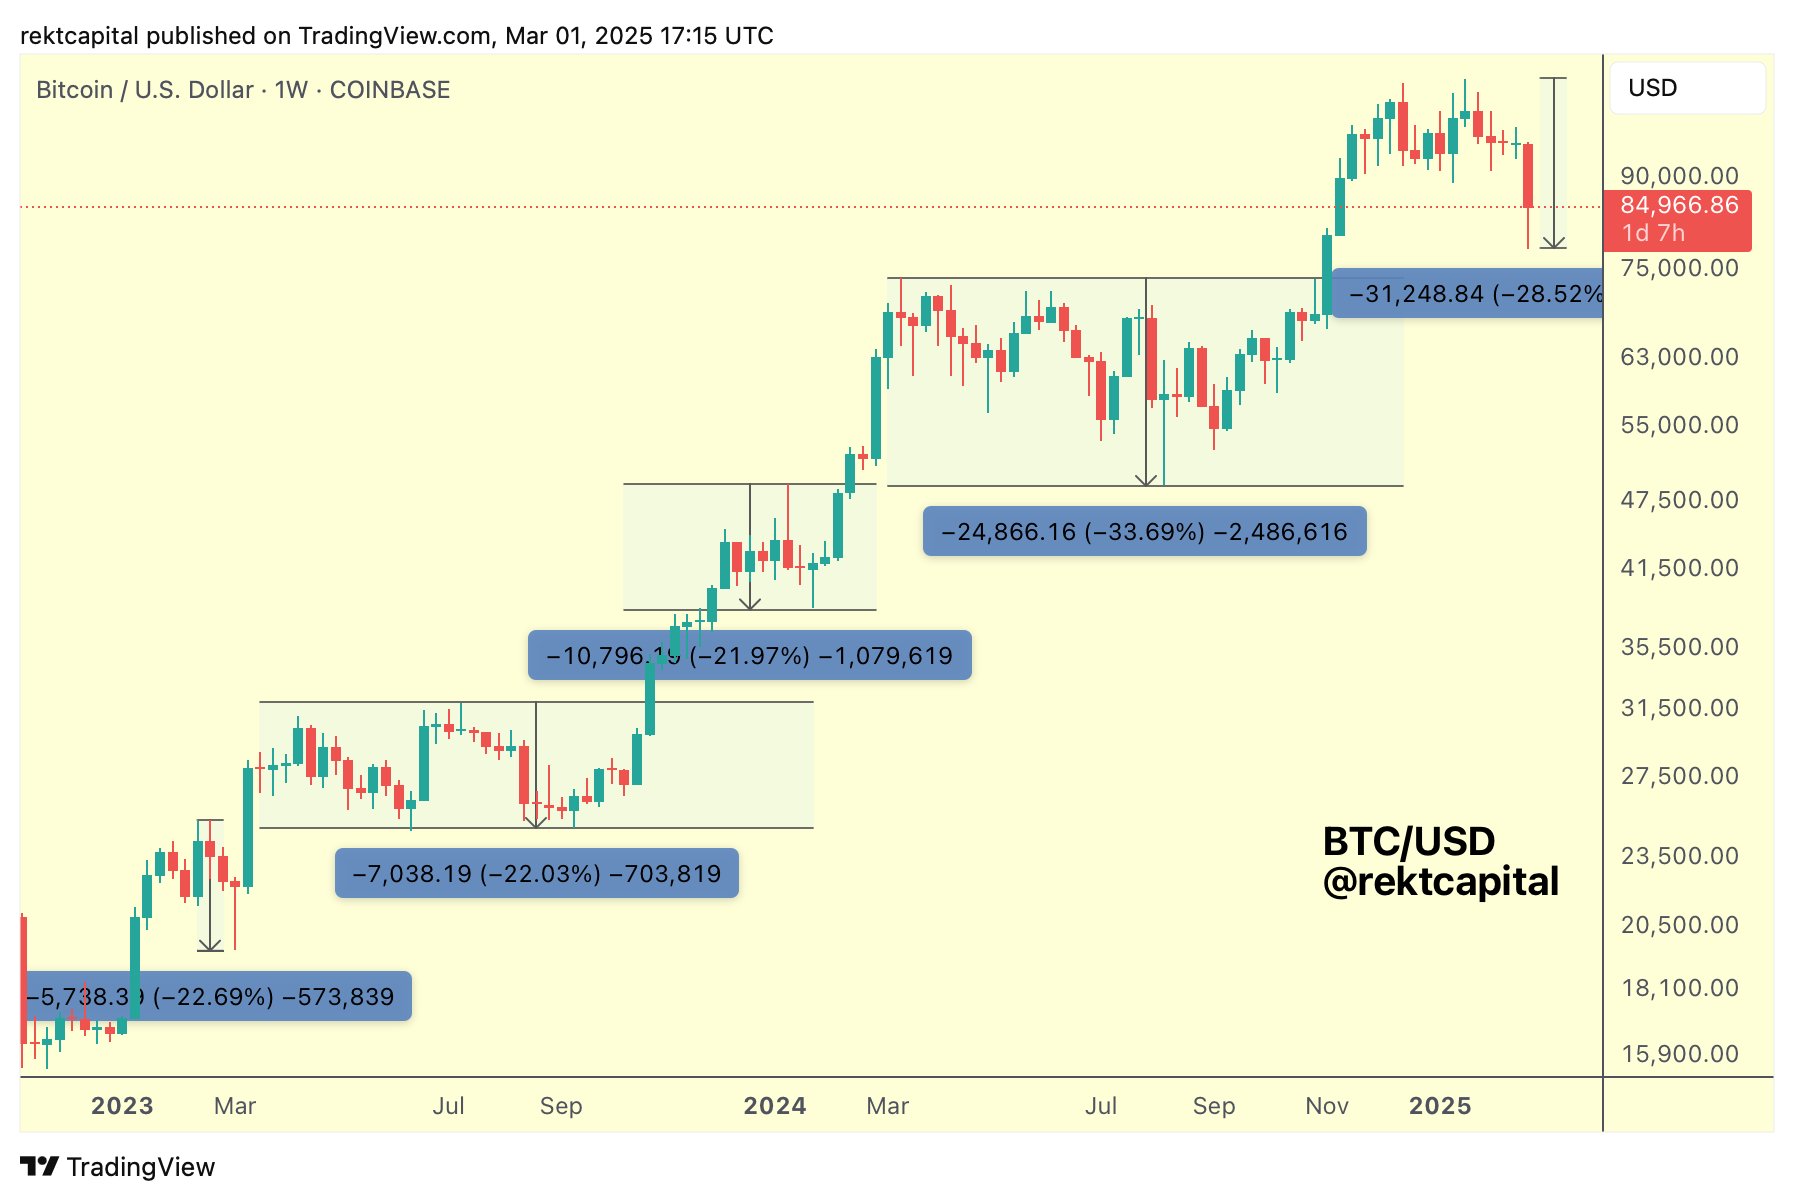
BTC/USD 1-week chart.
Analysts from a cryptocurrency exchange mentioned recently that the current lows represent a “shakeout,” rather than signaling the end of the ongoing cycle.
This article does not provide investment advice or recommendations. All investments and trading activities carry risks, and readers are encouraged to do their own research before making decisions.