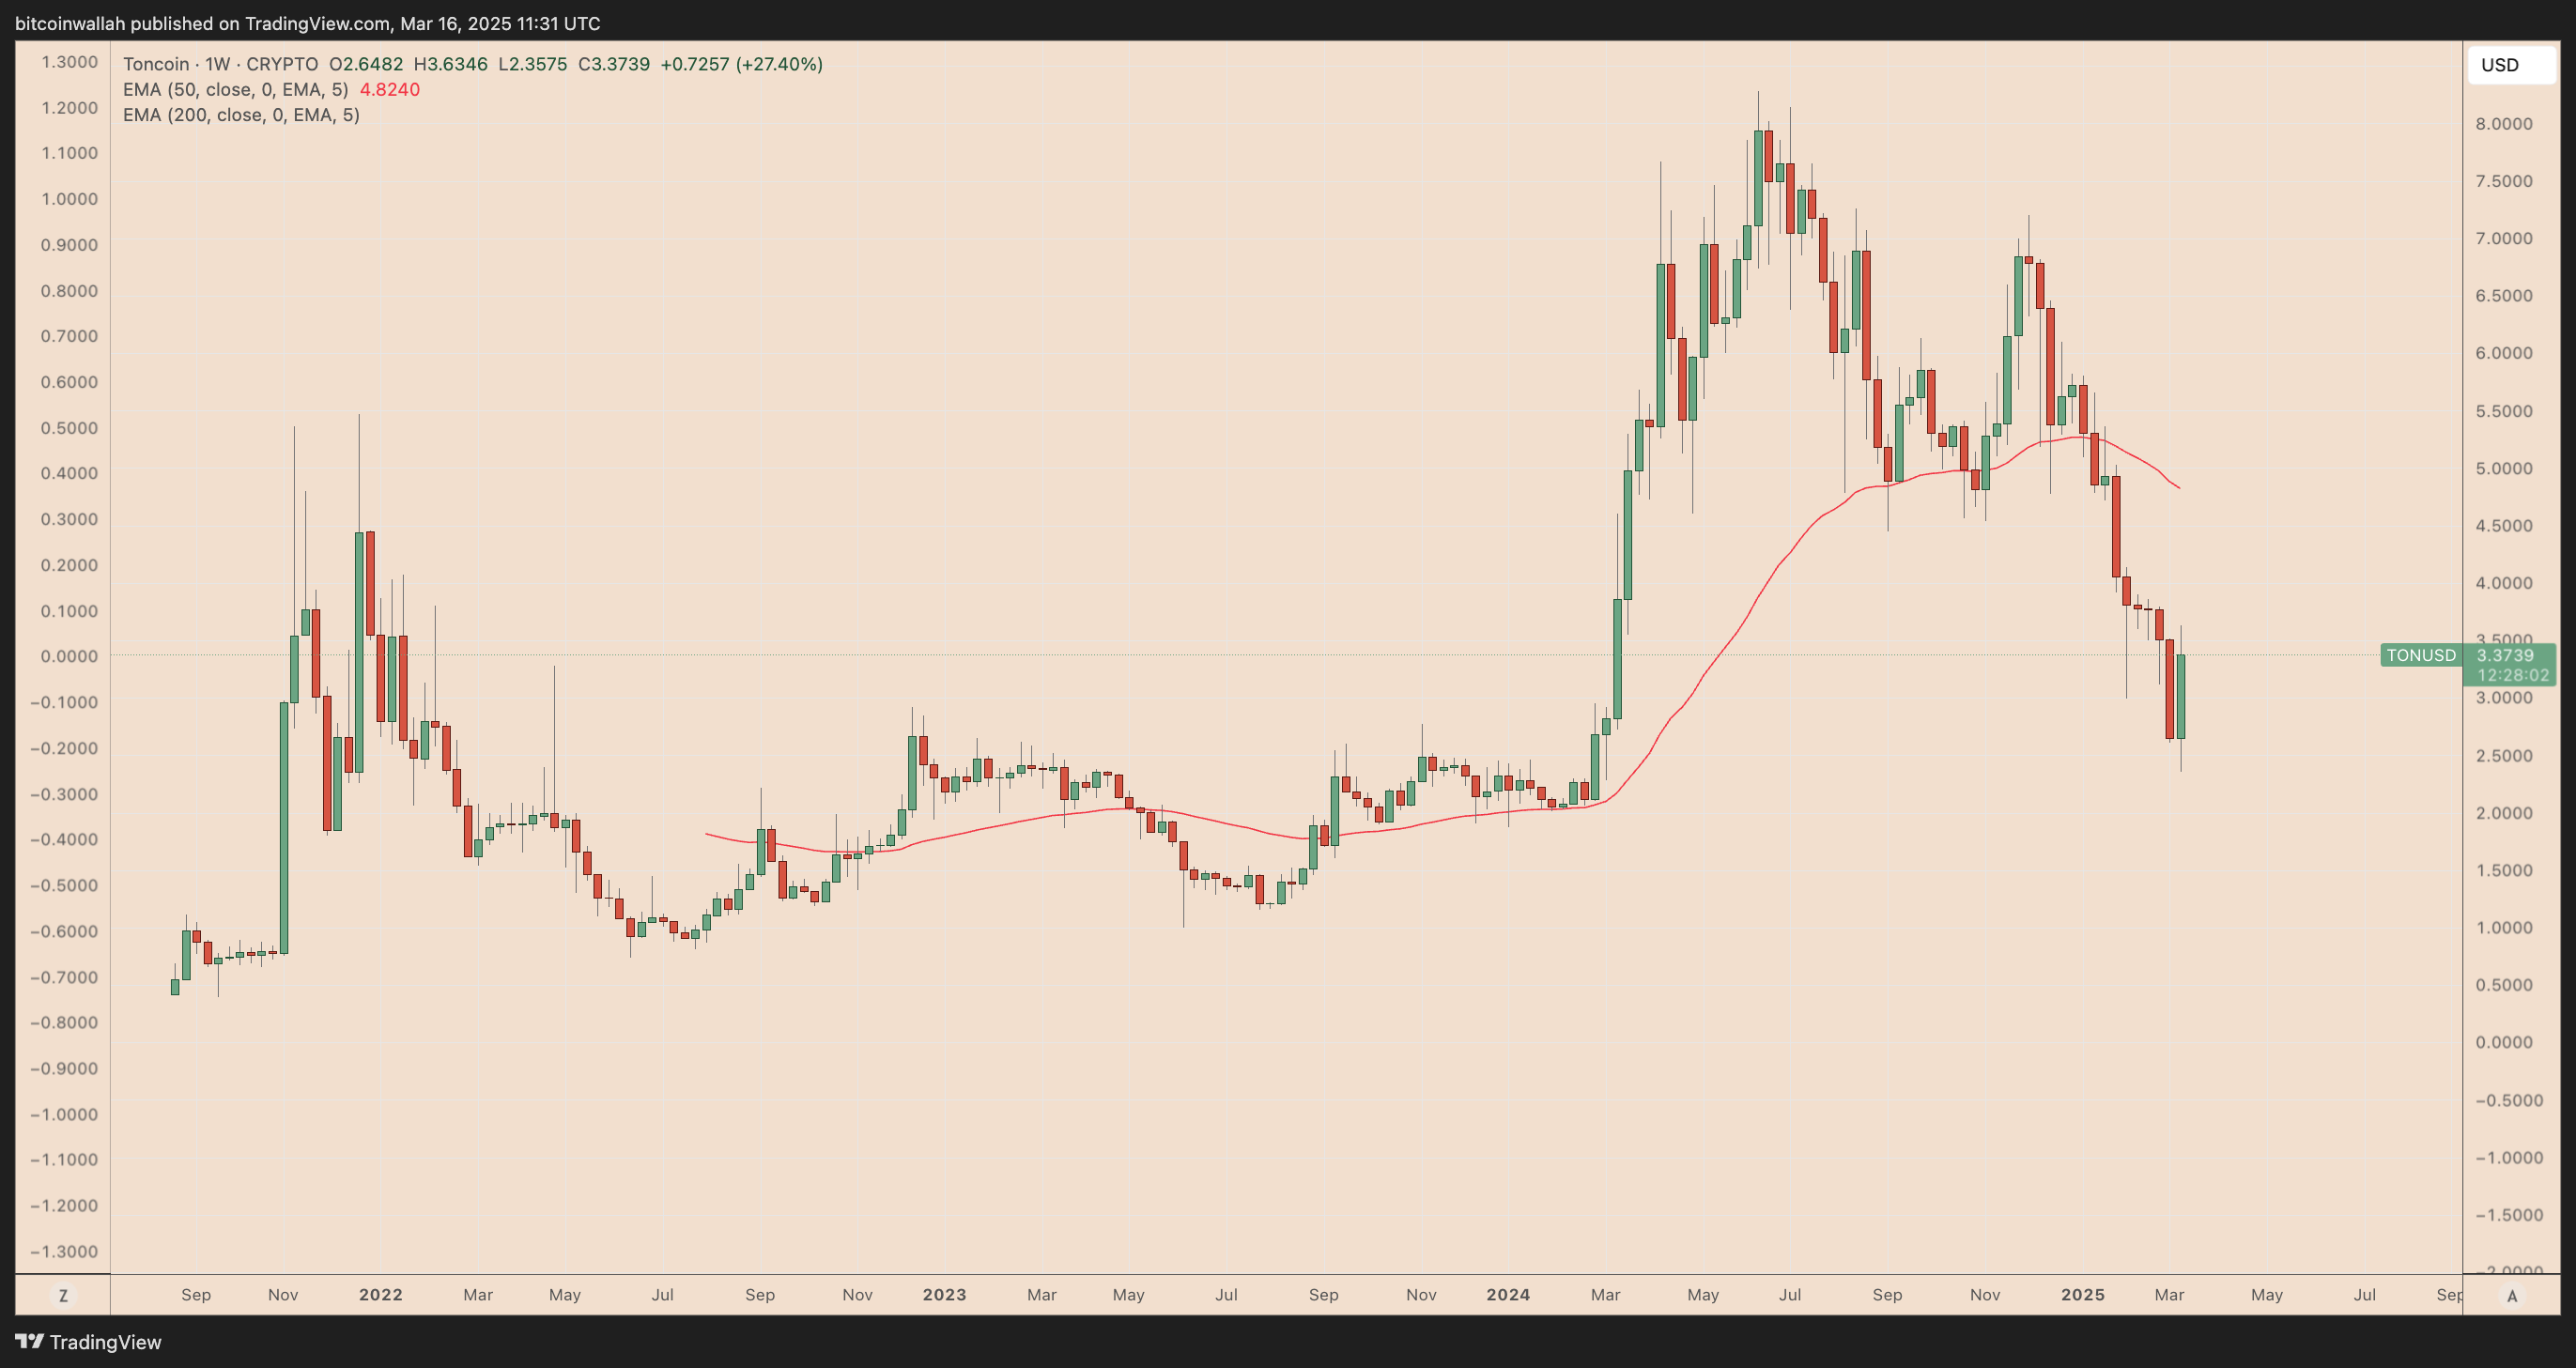
Toncoin (TON) has experienced a remarkable increase of over 50% in just a week, driven by the announcement that Telegram’s founder, Pavel Durov, has received authorization to leave France for Dubai.
TON/USDT weekly price chart. Data from TradingView
The recent bullish shift in TON, particularly after it hit a low of $2.35—its lowest point in a year—has captured the attention of traders, with crypto analyst Crypto Patel pointing out a “great entry zone” for those looking to invest for the long term.
TON aims for a 100% increase by 2025
According to Crypto Patel, TON’s price has “bounced perfectly” off its support level near $2.50.
This support level falls within the $2.40-3.00 range that previously acted as resistance between December 2022 to April 2023 and from September 2023 to April 2024. The analyst states that this area now represents a “great entry zone,” as TON continues its rebound from the same level.
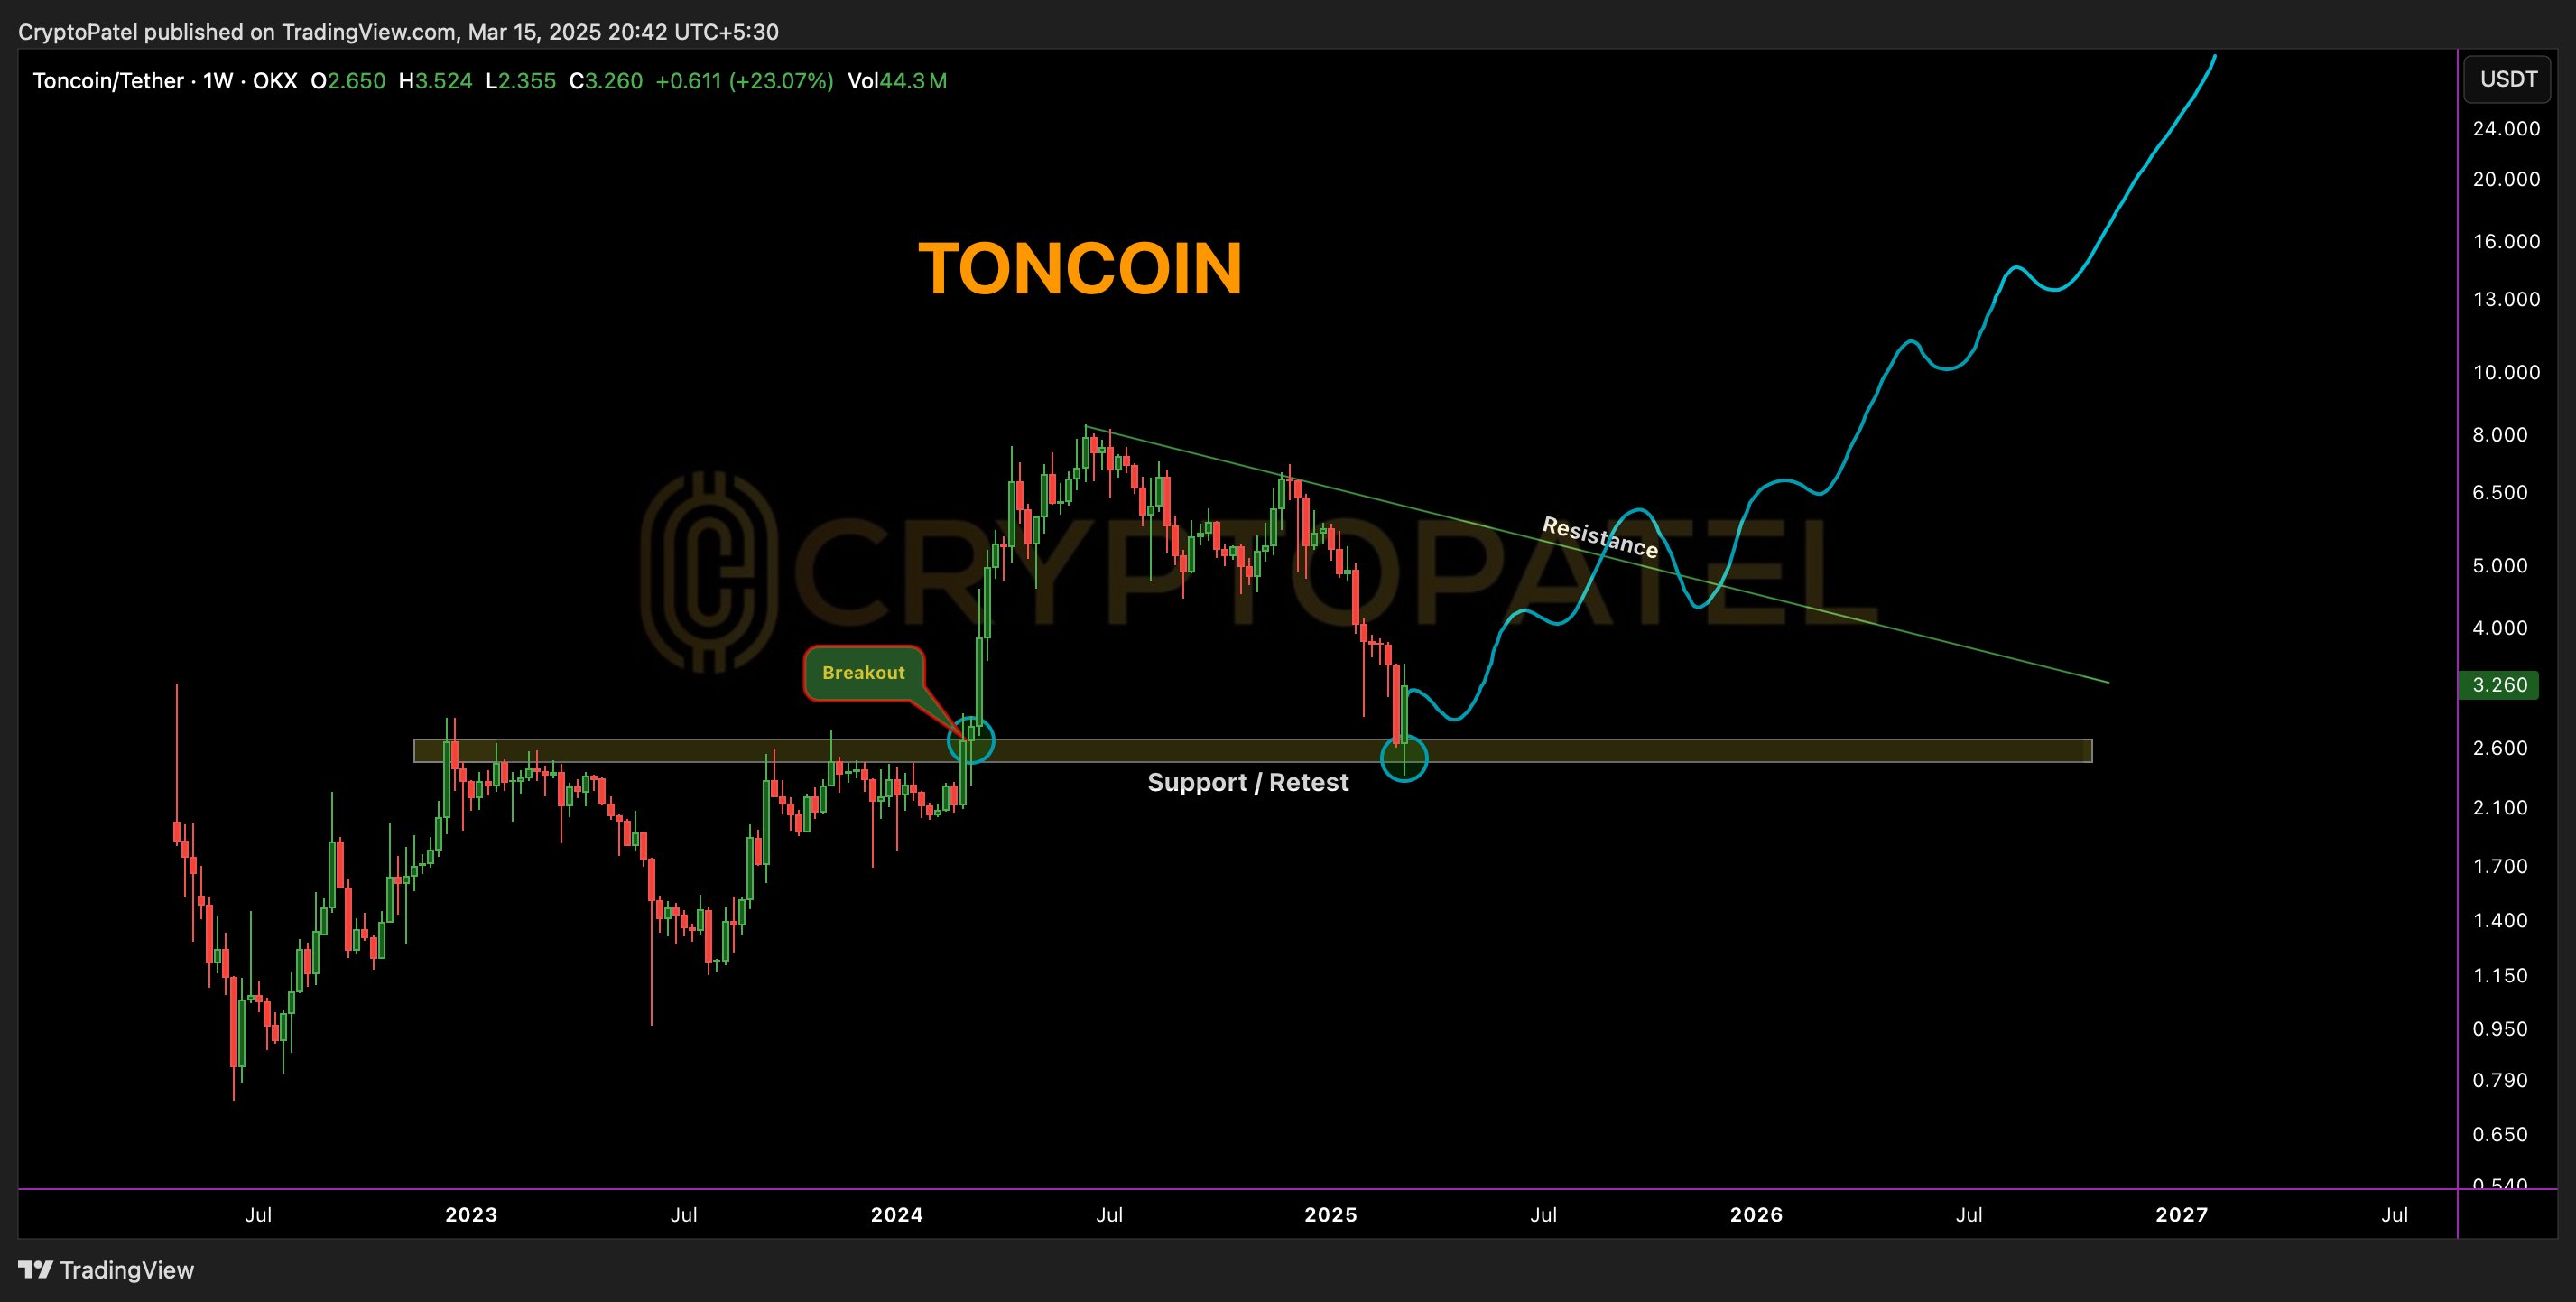
TON/USDT weekly price chart. Data from TradingView/Crypto Patel
A significant rebound from the $2.40-3.00 range could prompt TON to approach its existing descending trendline resistance in the weeks to come, potentially driving the price up to $5 by June or July.
Related: Telegram wallet to list 50 tokens and initiate yield program
The optimistic outlook aligns with the analysis from a different expert, who identifies a falling wedge pattern, suggesting that Toncoin’s price could reach an upside target of $6 if it manages to break above the wedge’s upper trendline.
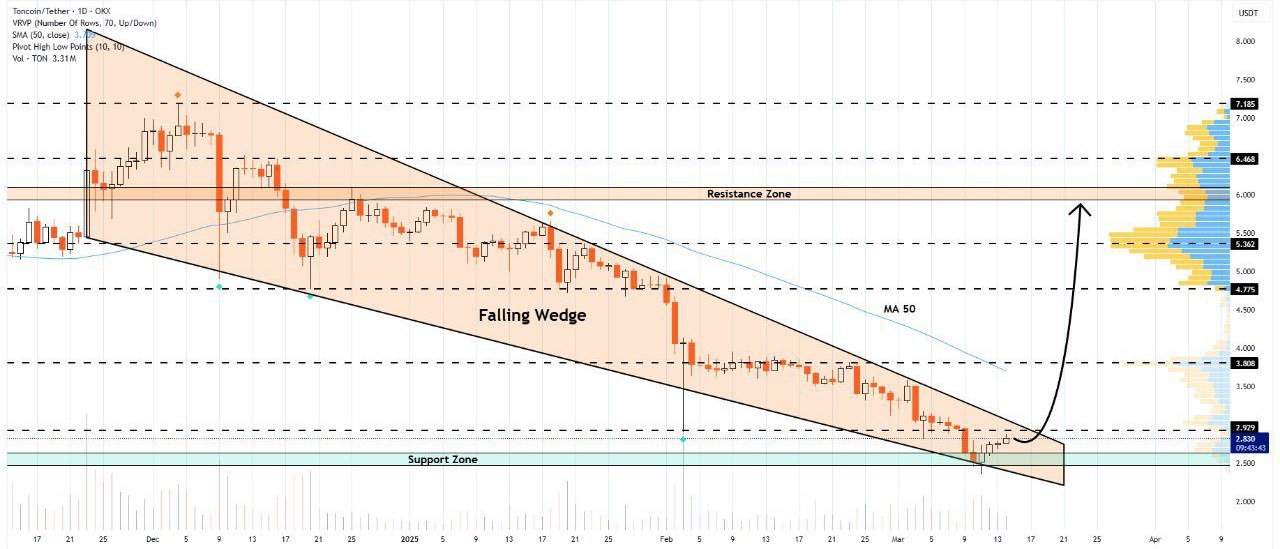
TON/USDT daily price chart. Data from TradingView
Falling wedges typically break out when the price rises above the upper trendline, with potential increases equal to the maximum height of the pattern.
Another analyst predicts a bullish reversal for TON, attributing it to the relative strength index (RSI) being in oversold territory, suggesting a possible opportunity for long-term accumulation.
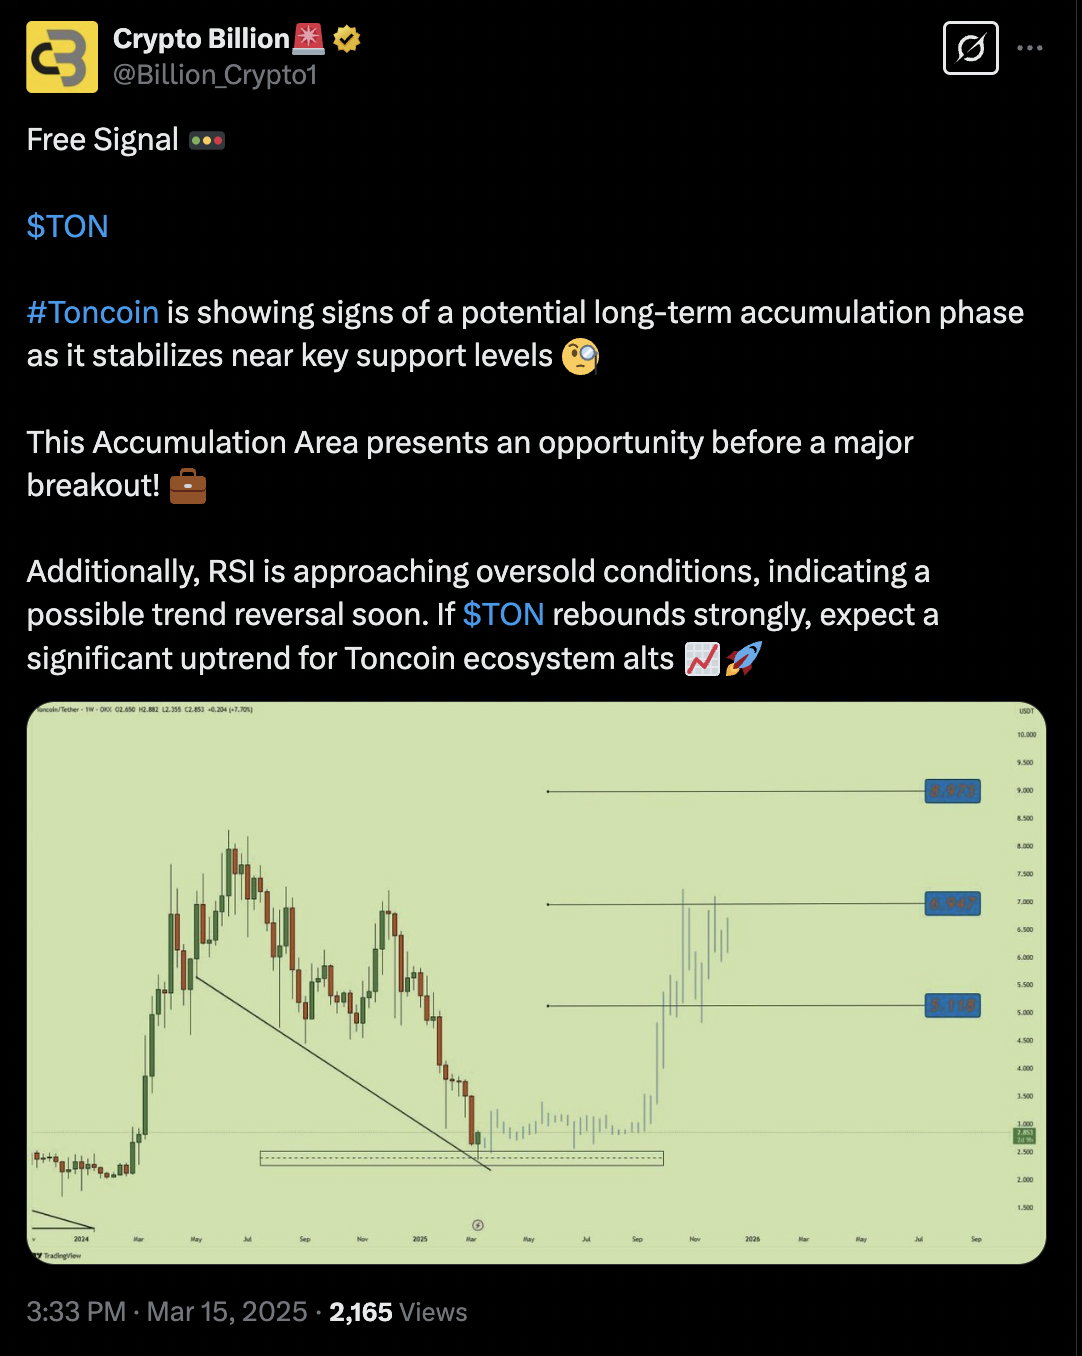
Source: Crypto Billion
The Sharpe ratio of Toncoin, an important financial metric measuring risk-adjusted returns, also suggests that the TON market is currently oversold.
As of March 16, the 180-day average ratio had dropped below -25, as indicated in blue. Historically, TON has seen bullish reversals whenever the Sharpe ratio dipped into this range, similar to trends observed in late 2022 and mid-2023.
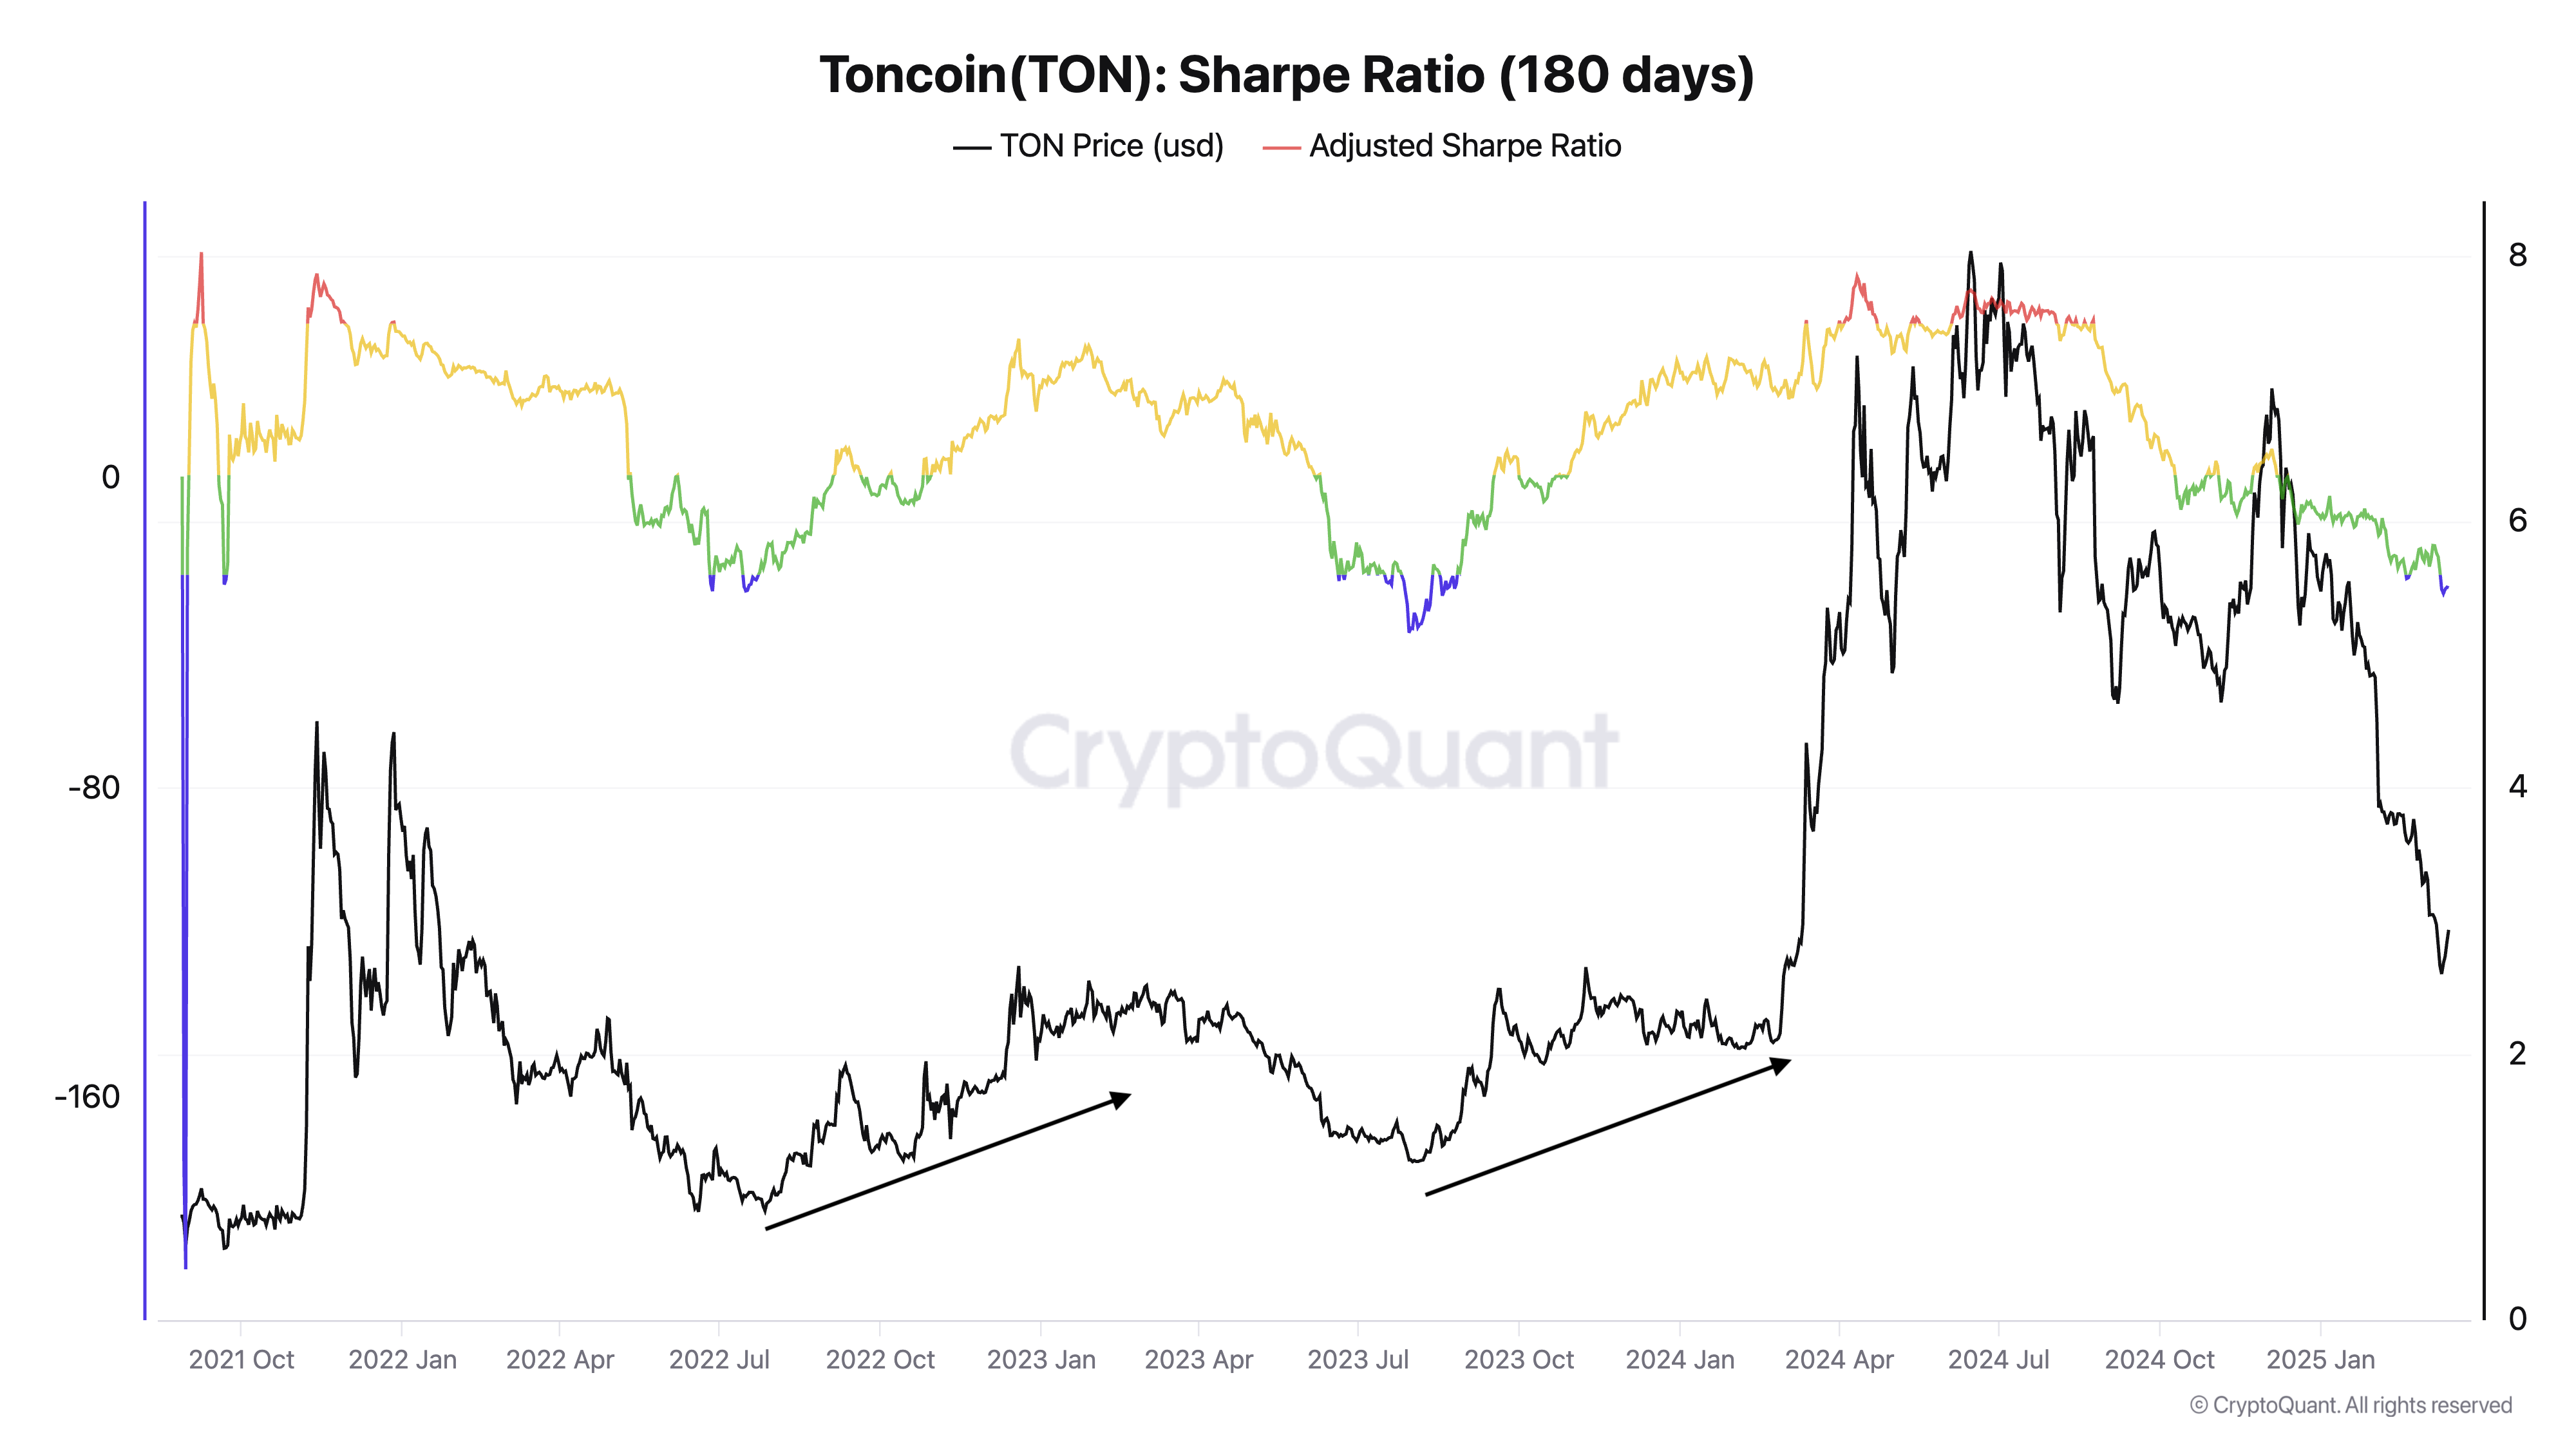
TON Sharpe ratio (180 days). Data from CryptoQuant
Short positions in TON remain prevalent
In the derivatives market, Toncoin is seeing a revival in its open interest (OI)—a metric that tracks the total number of unresolved TON contracts such as options and futures.
As of March 16, TON’s OI was approximately $169.12 million, up from $80.75 million just five days earlier.
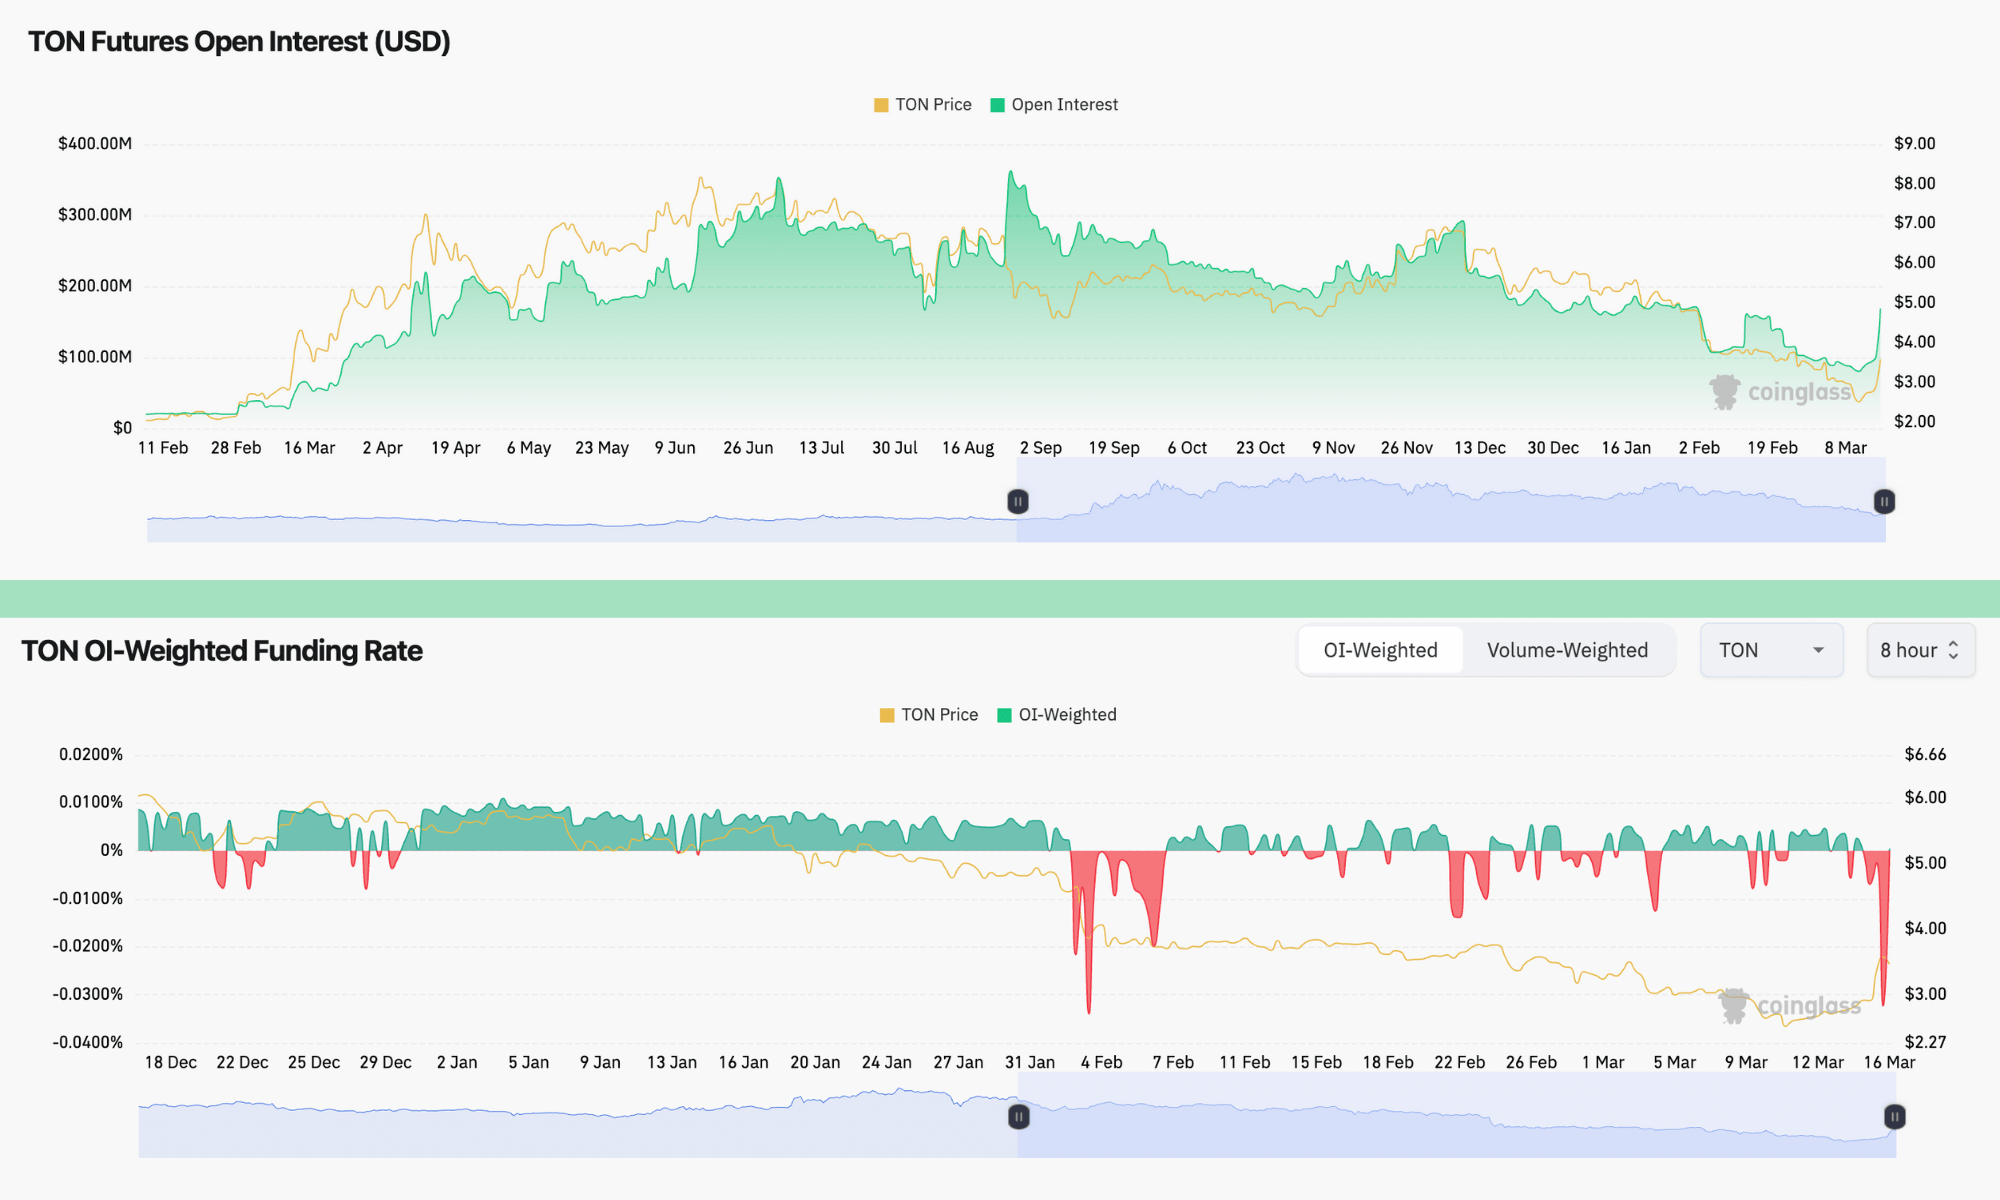
TON Futures’ OI and funding rates. Data from CoinGlass
Conversely, TON’s weekly funding rates are lingering in negative territory—though they made a slight return to positive numbers after hitting -0.678% earlier on March 16.
A rise in open interest accompanied by negative funding rates usually reflects bearish sentiments and aggressive shorting. The 30-day liquidation map for TON/USDT on Bybit shows nearly $10 million at risk in long liquidations if the Toncoin price declines to about $2.54.
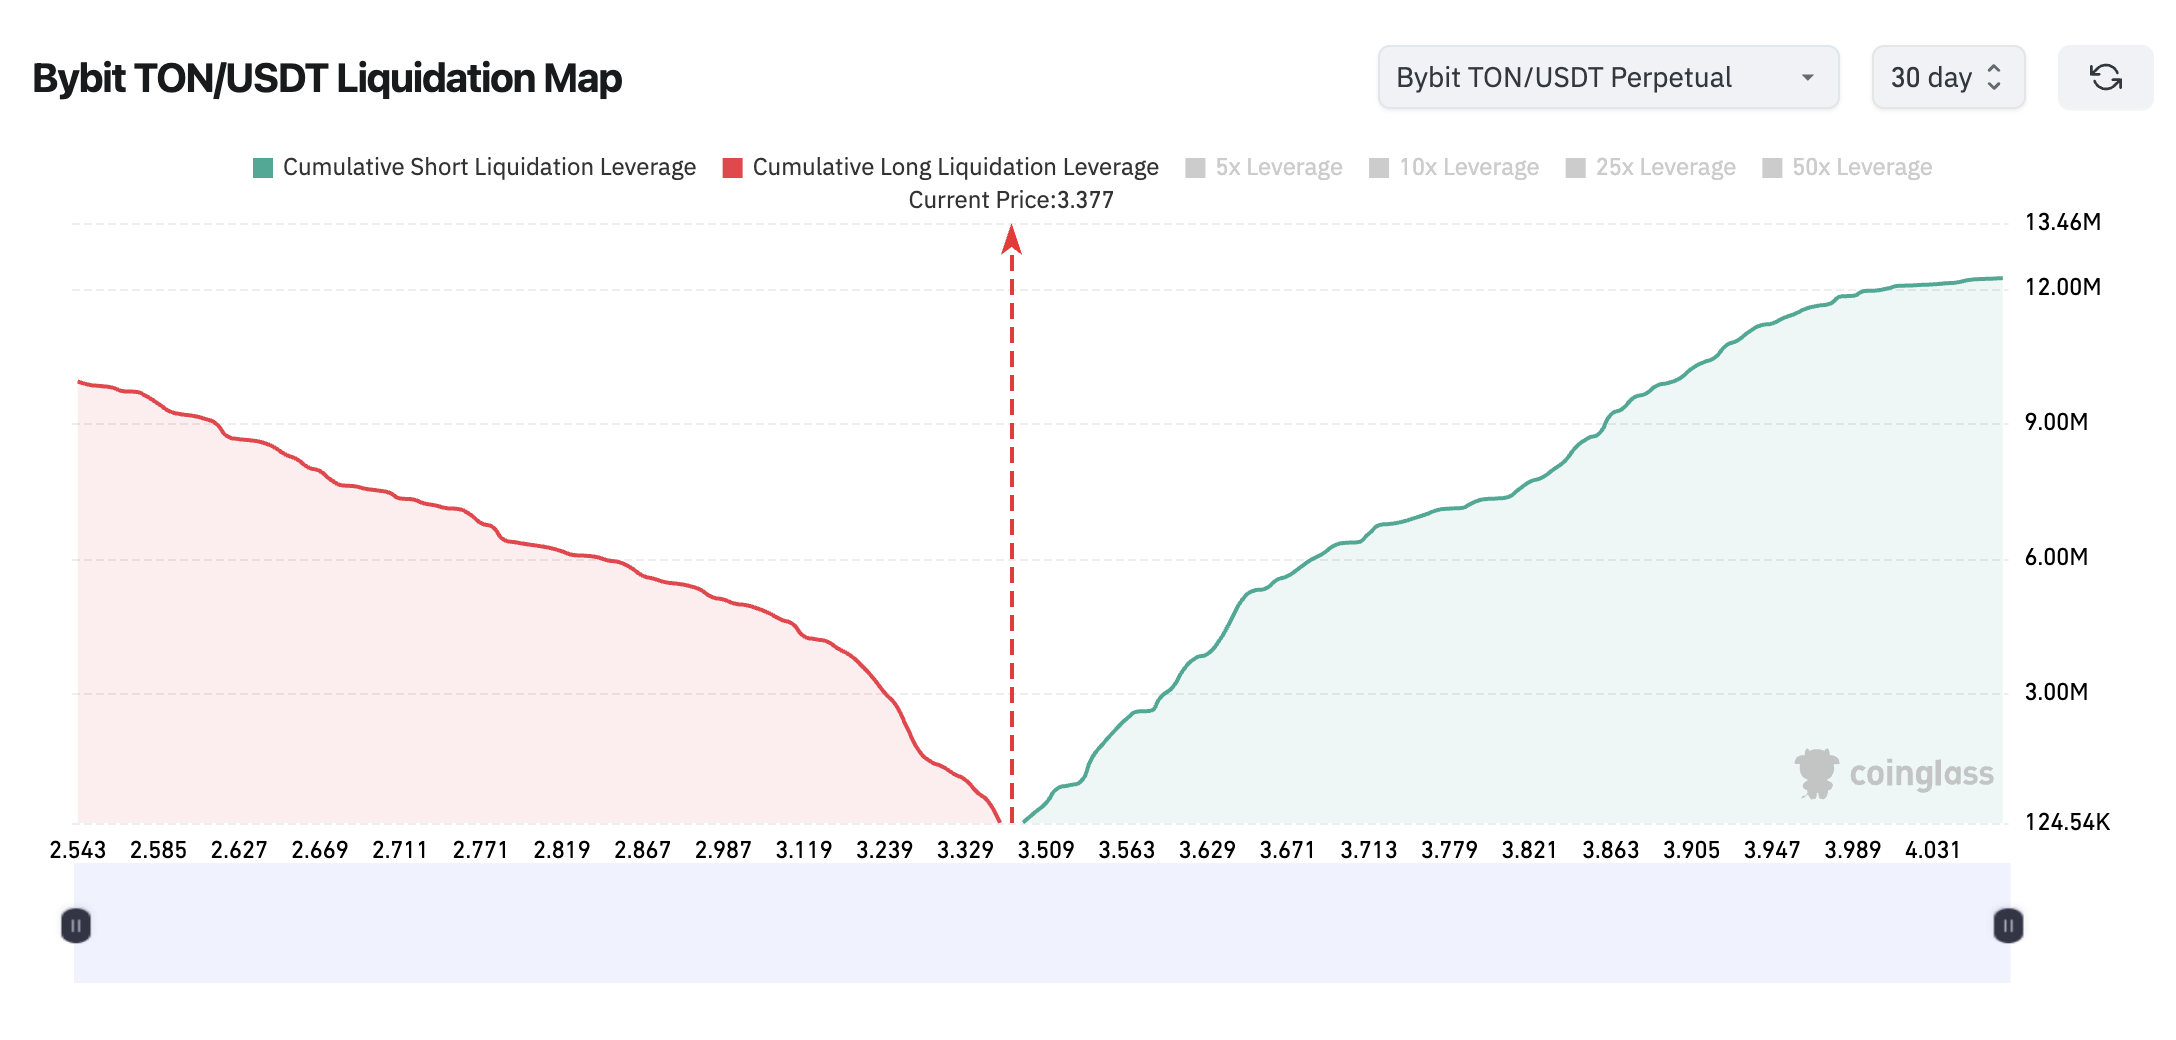
Bybit TON/USDT 30-day liquidation map (as of March 16). Data from Coinglass
On the other hand, the same liquidation map indicates that about $12 million in short positions could be in jeopardy if TON climbs above the $4 mark.
If this scenario comes to pass, the resulting buybacks could significantly enhance Toncoin’s upward momentum, potentially driving prices to the previously mentioned levels.
This article does not provide investment advice or recommendations. All investments and trading decisions carry risk, and readers should perform their own research prior to making any decisions.