The stochastic RSI for Bitcoin (BTC) has recently indicated a bullish crossover, which is often followed by significant price recoveries.
This momentum indicator assesses price movements against their historical range over a specified timeframe. It operates on a scale from 0 to 100, where values exceeding 80 are viewed as overbought, while those below 20 are considered oversold.

BTC/USDT weekly price chart. Image: TradingView
A crossover where the blue %K line rises above the orange %D line from an oversold territory signals a potential increase in upward momentum.
New Price Target of $120,000 for BTC
Historical patterns indicate that each instance of a weekly stochastic RSI bullish crossover has preceded sharp recoveries in Bitcoin’s price, typically occurring within three to five months. These recoveries have averaged gains of approximately 56%, with some rallies exceeding 90% returns.
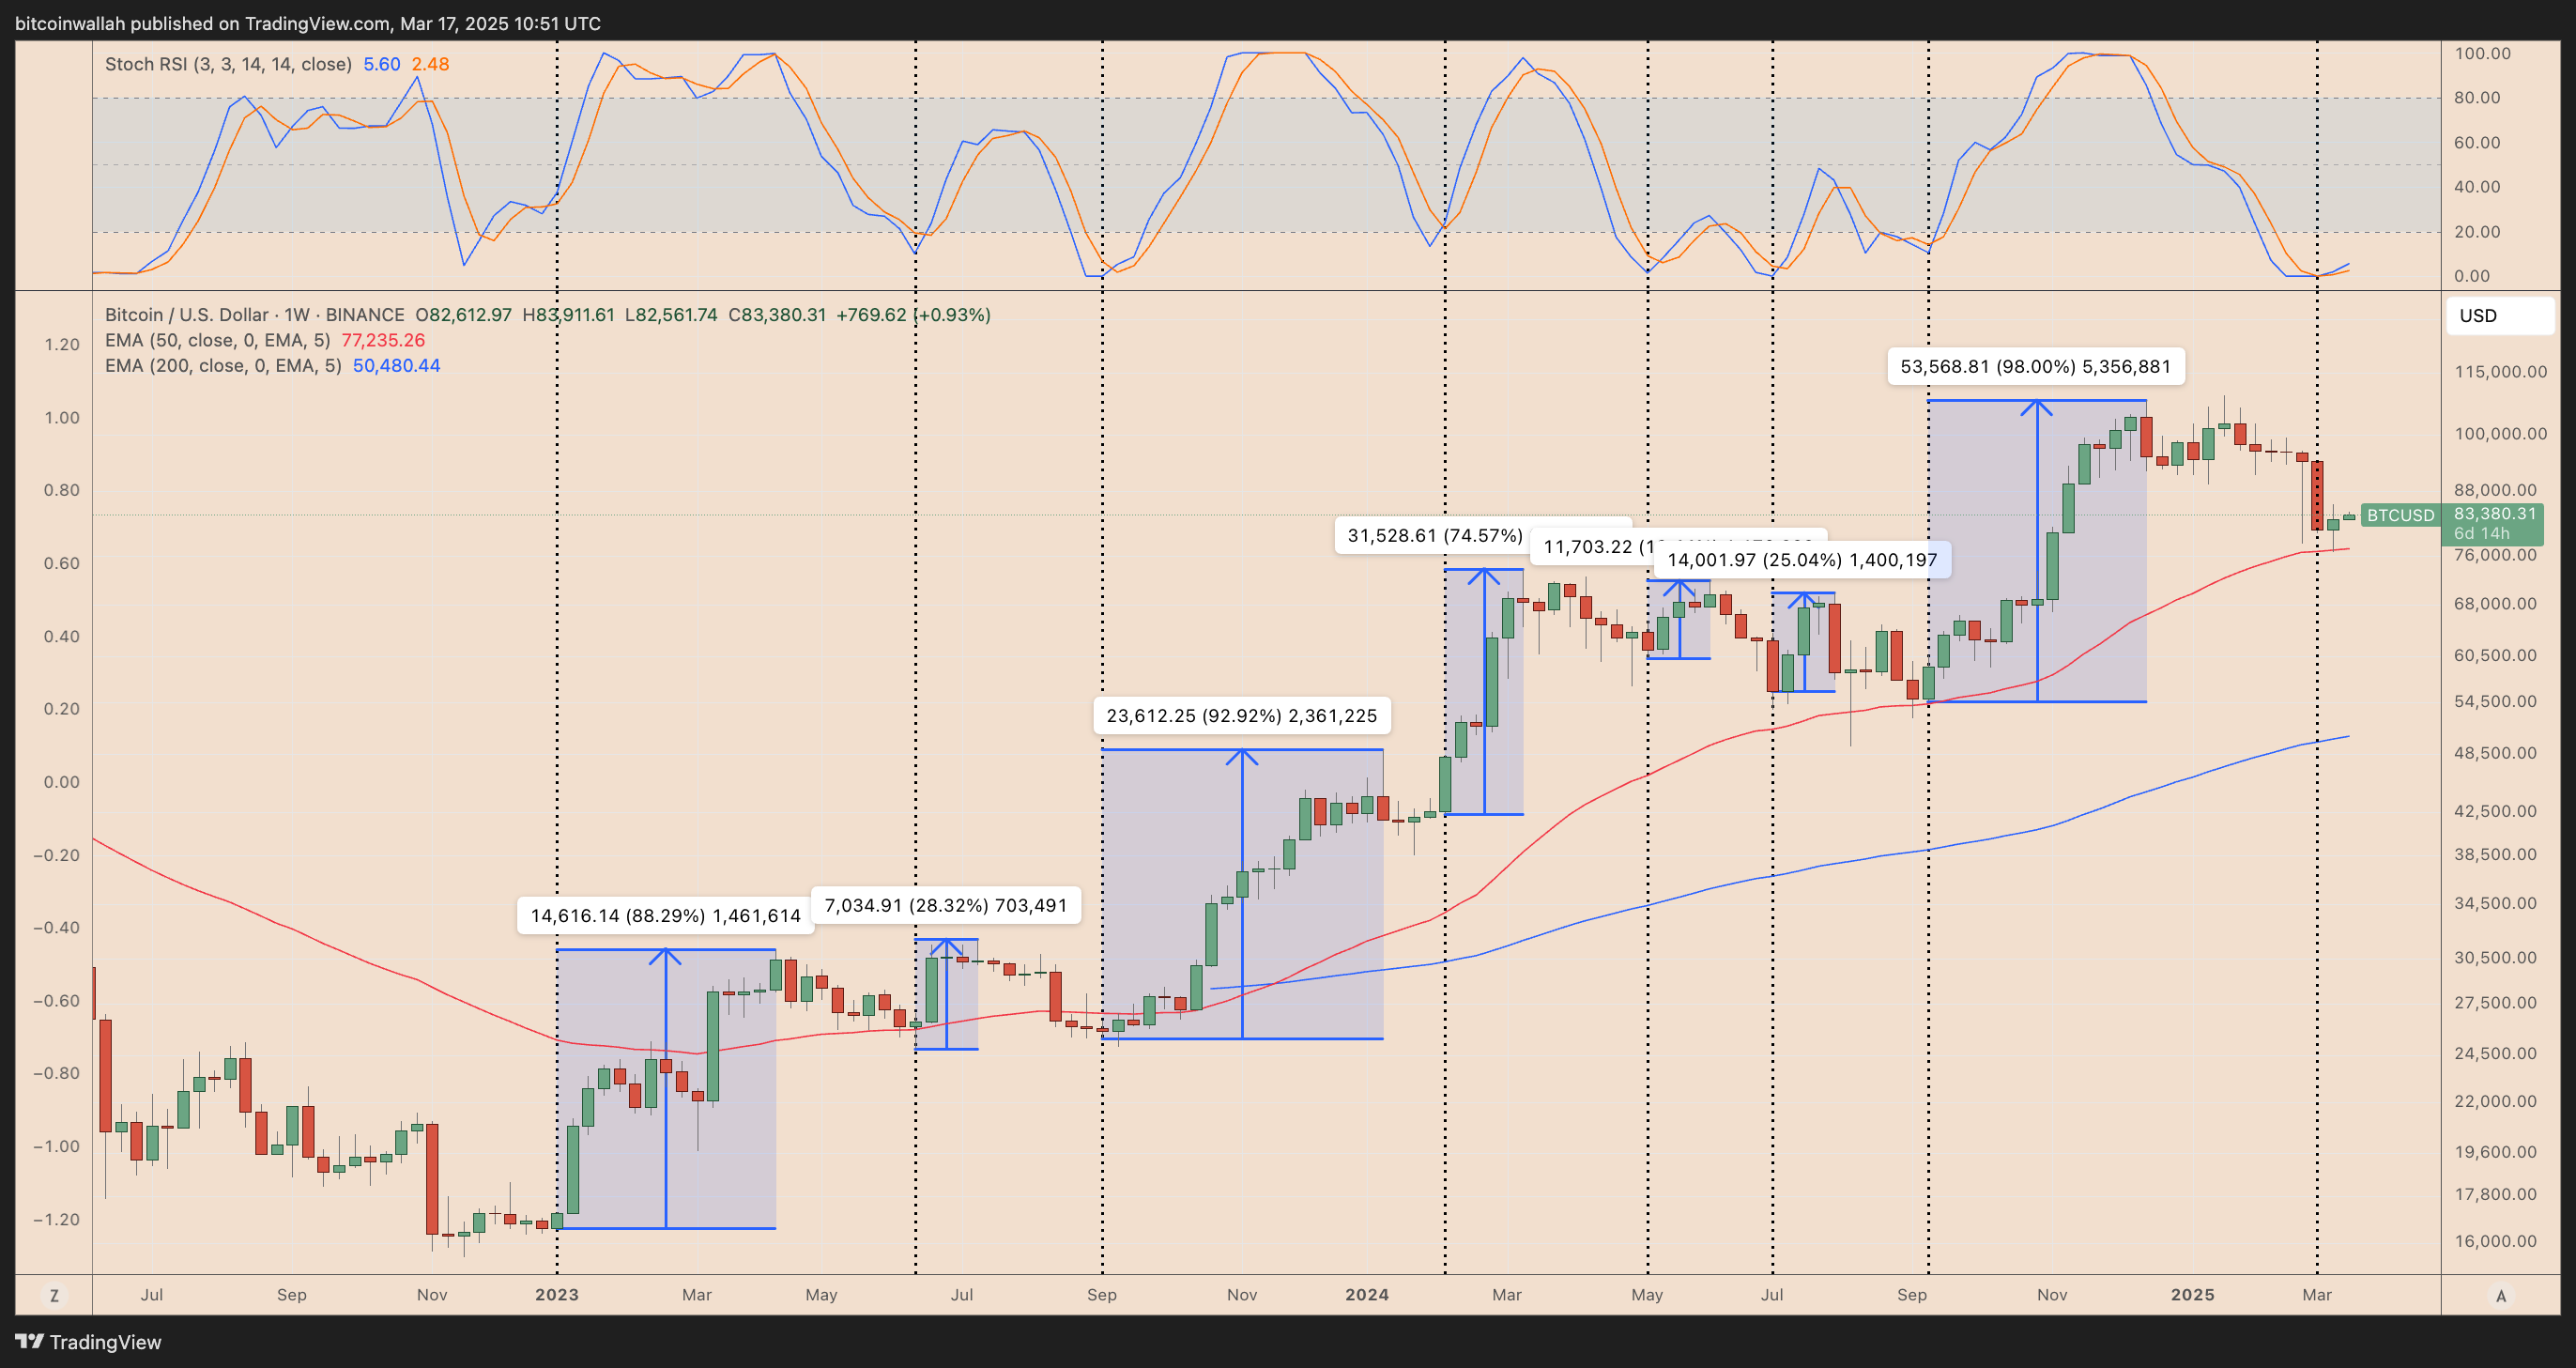
BTC/USD weekly price chart. Image: TradingView
This trend includes nearly a 90% growth from the lows of November 2022, a 92% increase in late 2023, and an impressive 98% rise, culminating in Bitcoin’s recent all-time high of around $110,000 in January 2025.
If the past is any indication, Bitcoin might experience another significant surge around July or August, in line with previous bullish crosses of the stochastic RSI that yielded substantial profits.
Market analyst insights suggest that Bitcoin’s price could surpass $120,000 if the stochastic RSI pattern unfolds as historically anticipated.
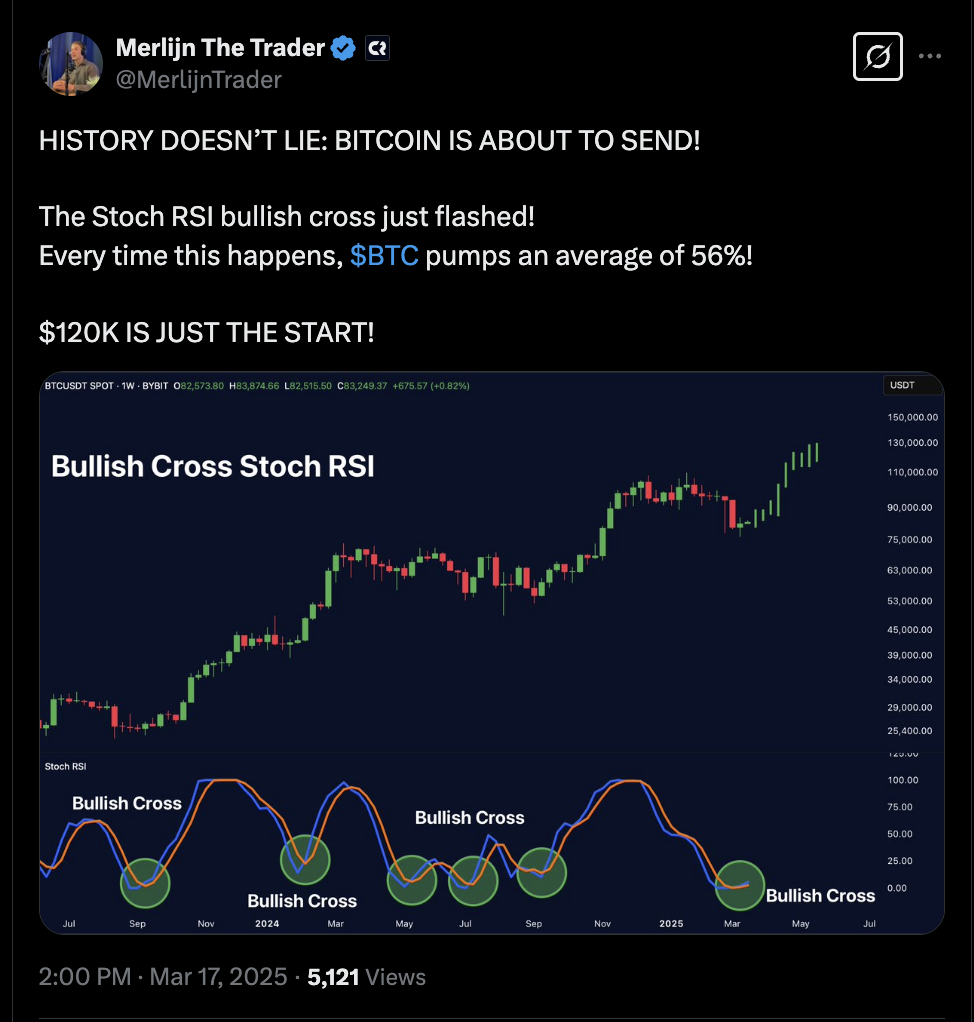
Image: Analyst insights
Additionally, Bitcoin’s optimistic reversal prospects are supported by its 50-week exponential moving average (50-week EMA; depicted as the red wave in the chart), currently situated around $77,230.
This 50-week EMA has consistently served as a robust accumulation area for traders since October 2023.
Should Bitcoin’s price fall significantly below the 50-week EMA, it may target the next support at the 200-week EMA (the blue wave) near $50,480, representing approximately a 40% drop from the present levels.
Hedge Funds Increasing Bitcoin Purchases
Another positive indication comes from hedge fund activity amidst the current price correction.
Global cryptocurrency hedge funds are expanding their Bitcoin positions, as evidenced by the latest rolling 20-day beta to BTC, which has reached a four-month peak. This implies that institutional investors are capitalizing on the dip to prepare for future gains.
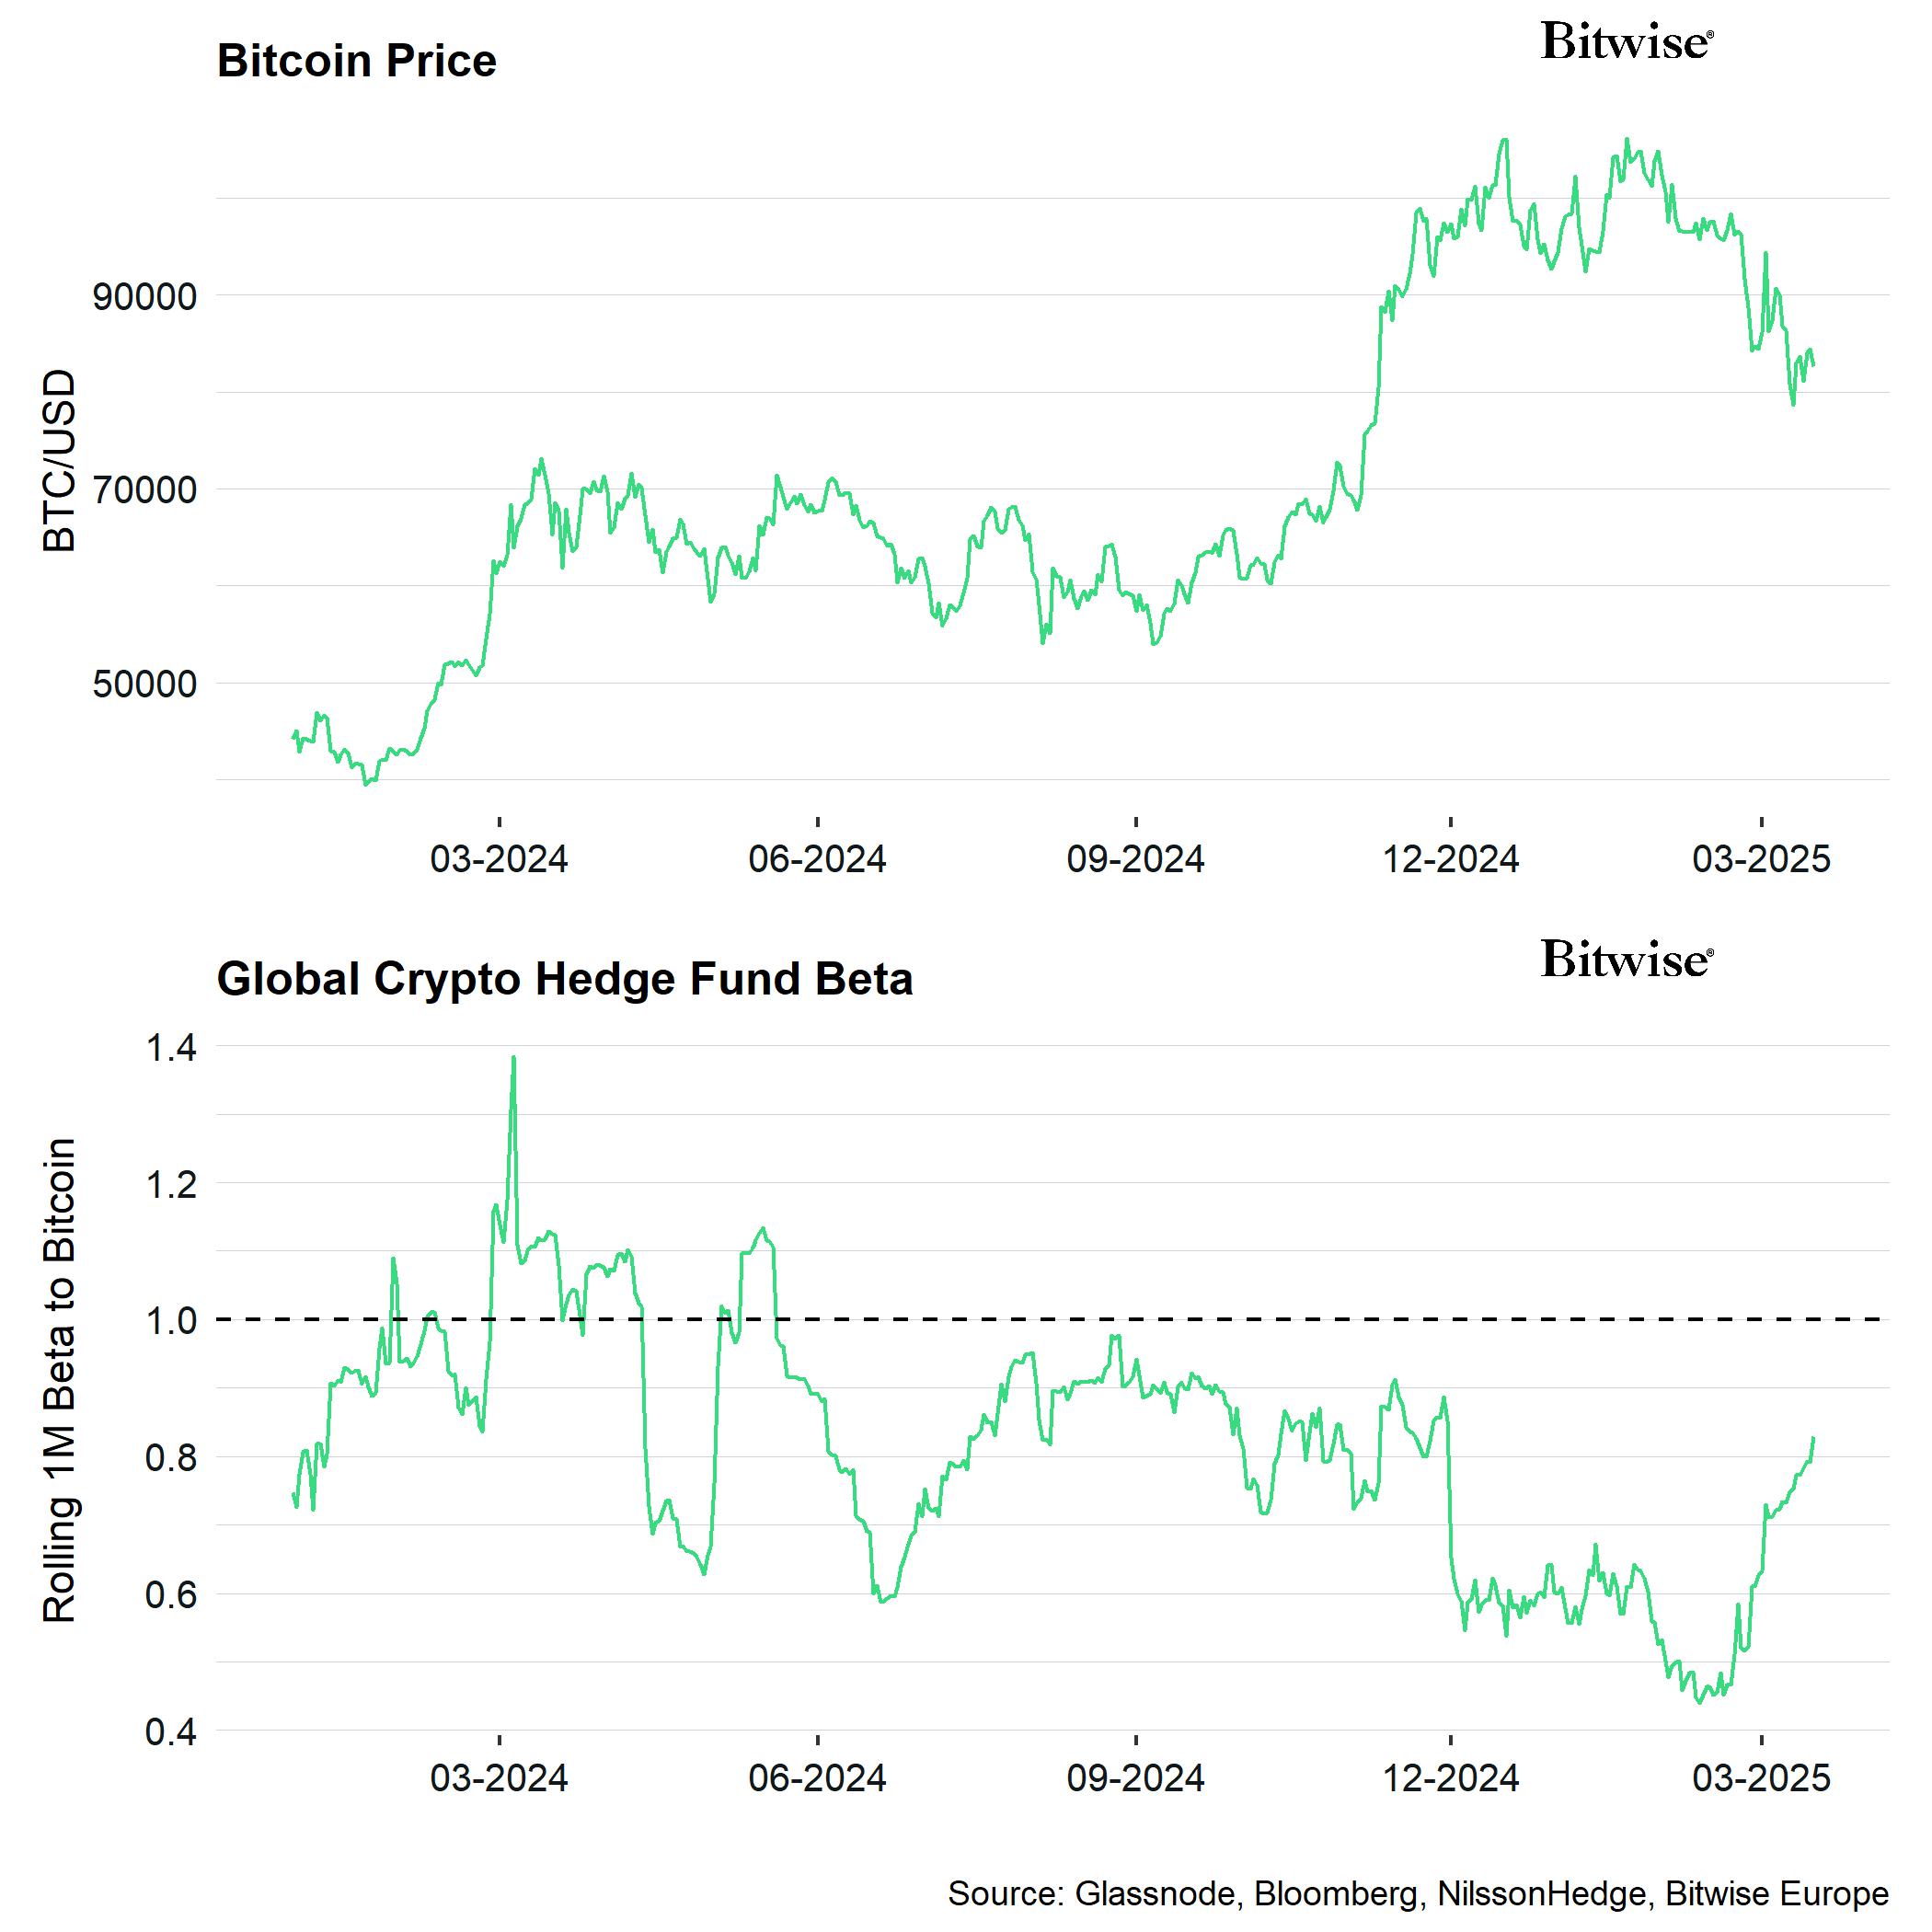
Global crypto hedge funds rolling 1-month beta to Bitcoin. Image: Glassnode/Bloomberg
Beta quantifies how closely hedge fund returns align with Bitcoin’s movements. A beta exceeding 1.0 indicates that the fund’s performance outpaces Bitcoin’s price, while a beta below 1.0 suggests less movement compared to Bitcoin.
Related: Peak ‘FUD’ indicates a $70K support — Key Bitcoin insights for this week
The current beta indicates a four-month high, suggesting that hedge funds view the recent Bitcoin dip as a prime buying opportunity, forecasting higher future prices and reinforcing the projected target of $120,000 discussed earlier.
As noted in recent reports, the $120,000+ price point is gaining traction as a target for summer 2025.
This article does not constitute investment advice or recommendations. All investment and trading activities come with risk, and readers should perform their own research before making decisions.