- Bitcoin hovers around $84,000 with a slight 1% uptick on Monday.
- Both Ethereum and XRP are trending upwards, with Ether aiming to reclaim the $2,000 mark.
- MicroStrategy purchases 130 Bitcoins at an average cost of $82,981, while Peter Schiff cautions that the company might face bankruptcy.
The daily price chart of Bitcoin (BTC) indicates a recovery for the leading cryptocurrency. MicroStrategy, notable for being one of the largest corporate holders of Bitcoin, announced the acquisition of an additional 130 BTC last week.
Ethereum (ETH) has risen by 1.54%, and XRP is up by 2.40% today.
Bitcoin poised to reclaim lost territory, targeting a rise above $90,000
As of this moment, Bitcoin is trading at $83,000. The technical indicators on the BTC/USDT daily chart lend credence to expectations of gains for this dominant cryptocurrency.
The Relative Strength Index (RSI) stands at 42 and is trending upwards. Additionally, the Moving Average Convergence Divergence (MACD) is indicating positive momentum with green histogram bars appearing above the neutral line. The overall price trend of Bitcoin showcases encouraging signs on the daily timeframe.
Both key momentum indicators support the likelihood of Bitcoin’s gains, making a return to the $90,000 resistance probable.
Currently, the price of BTC is 8.35% shy of the $90,000 resistance level. This benchmark is crucial for Bitcoin, as it has lingered beneath this price since March 7, as illustrated in the BTC/USDT chart below:
BTC/USDT daily price chart
Ethereum aims to challenge the significant $2,000 threshold
Ethereum is currently priced at $1,902. The leading altcoin appears ready to confront the significant psychological barrier of $2,000, seeking to close above this level.
The $2,000 mark has held importance as it served as key support for Ethereum for over a year, as seen on the ETH/USDT daily price chart.
A 5% increase from the current value could elevate Ether to the $2,000 position. A successful closing of the daily candlestick above this threshold could set the stage for the altcoin to challenge the lower boundary of the Fair Value Gap (FVG) at $2,533.
Reaching $2,533 would signify more than a 30% gain from the current ETH price.
Ethereum’s recent gains are backed by two pivotal momentum indicators, with the RSI trending upward at 34 and the MACD indicating a positive momentum in the price trend.
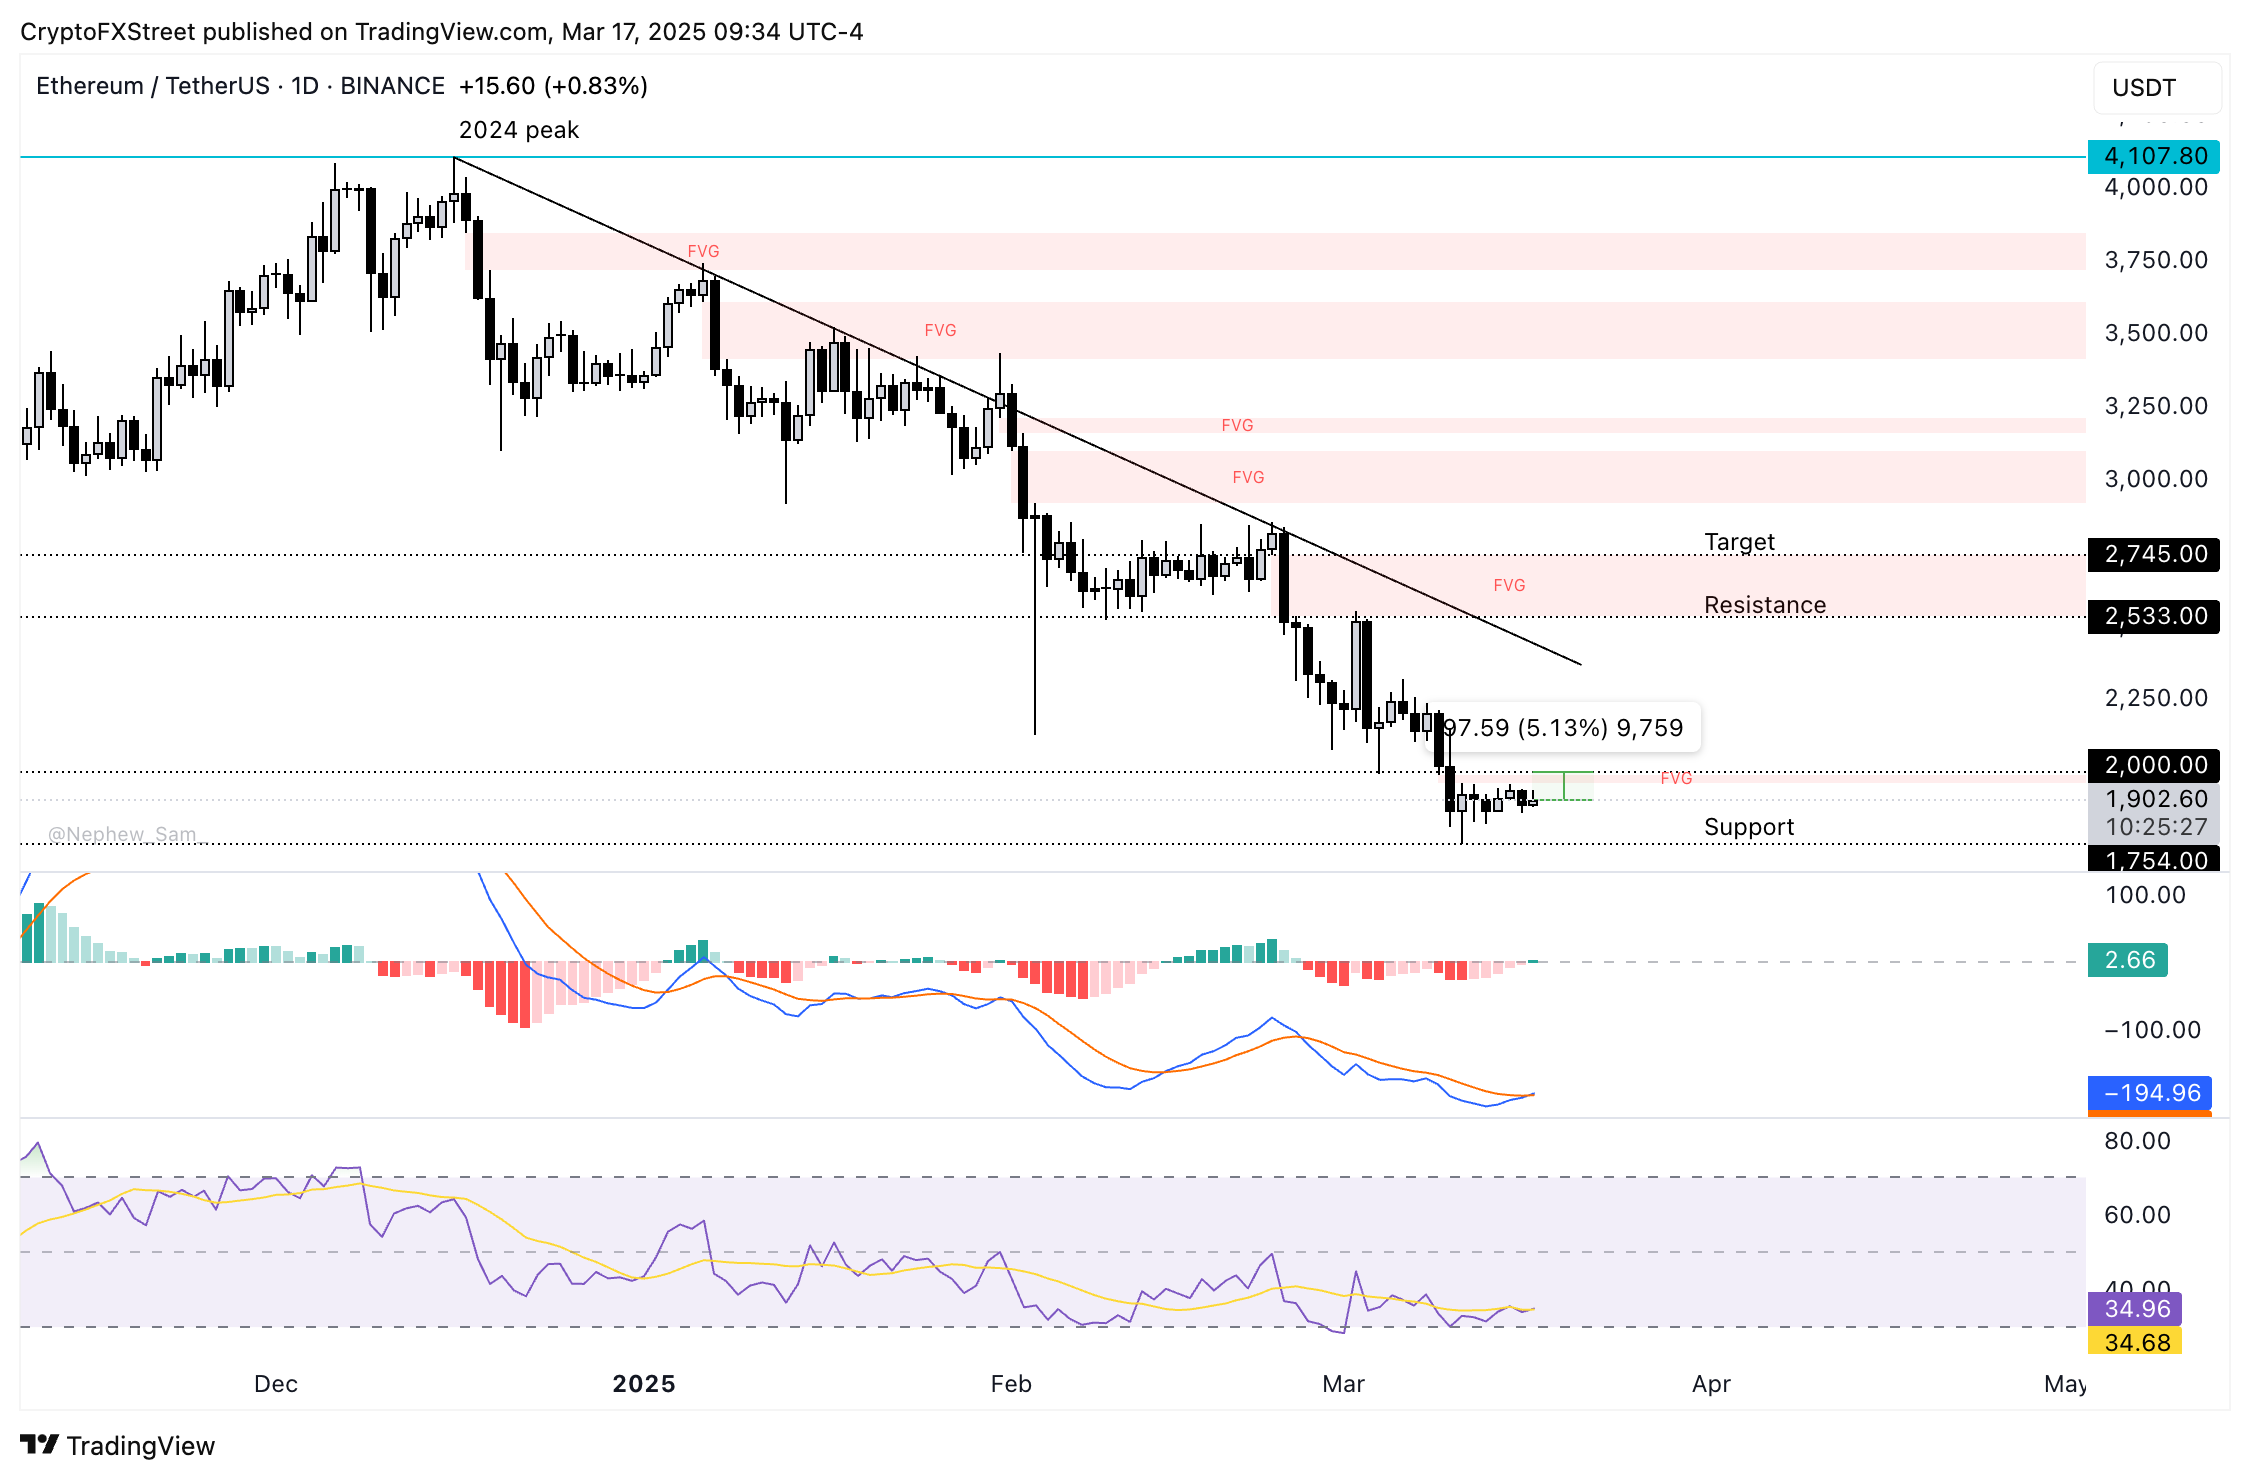
ETH/USDT daily price chart
If Ethereum fails to reach the $2,000 level, it might indicate weakness in its price trend, with support potentially bracing for the nearly 16-month low of $1,754.
XRP shows potential for a 10% increase, indicating recovery signs
XRP is trading at $2.3386 as of Monday. The altcoin noted an almost 2% increase during the day, and the momentum indicators on the daily price chart support an upward trajectory for XRP.
The 50% Fibonacci retracement level from XRP’s peak of $3.40 to the February low of $1.7711, currently at $2.5856, stands as a crucial resistance level. A move towards this level could translate into a 10% gain for XRP.
The RSI reads 48 and is showing an upward slope, while the MACD reflects positive momentum with green histogram bars above the neutral line.
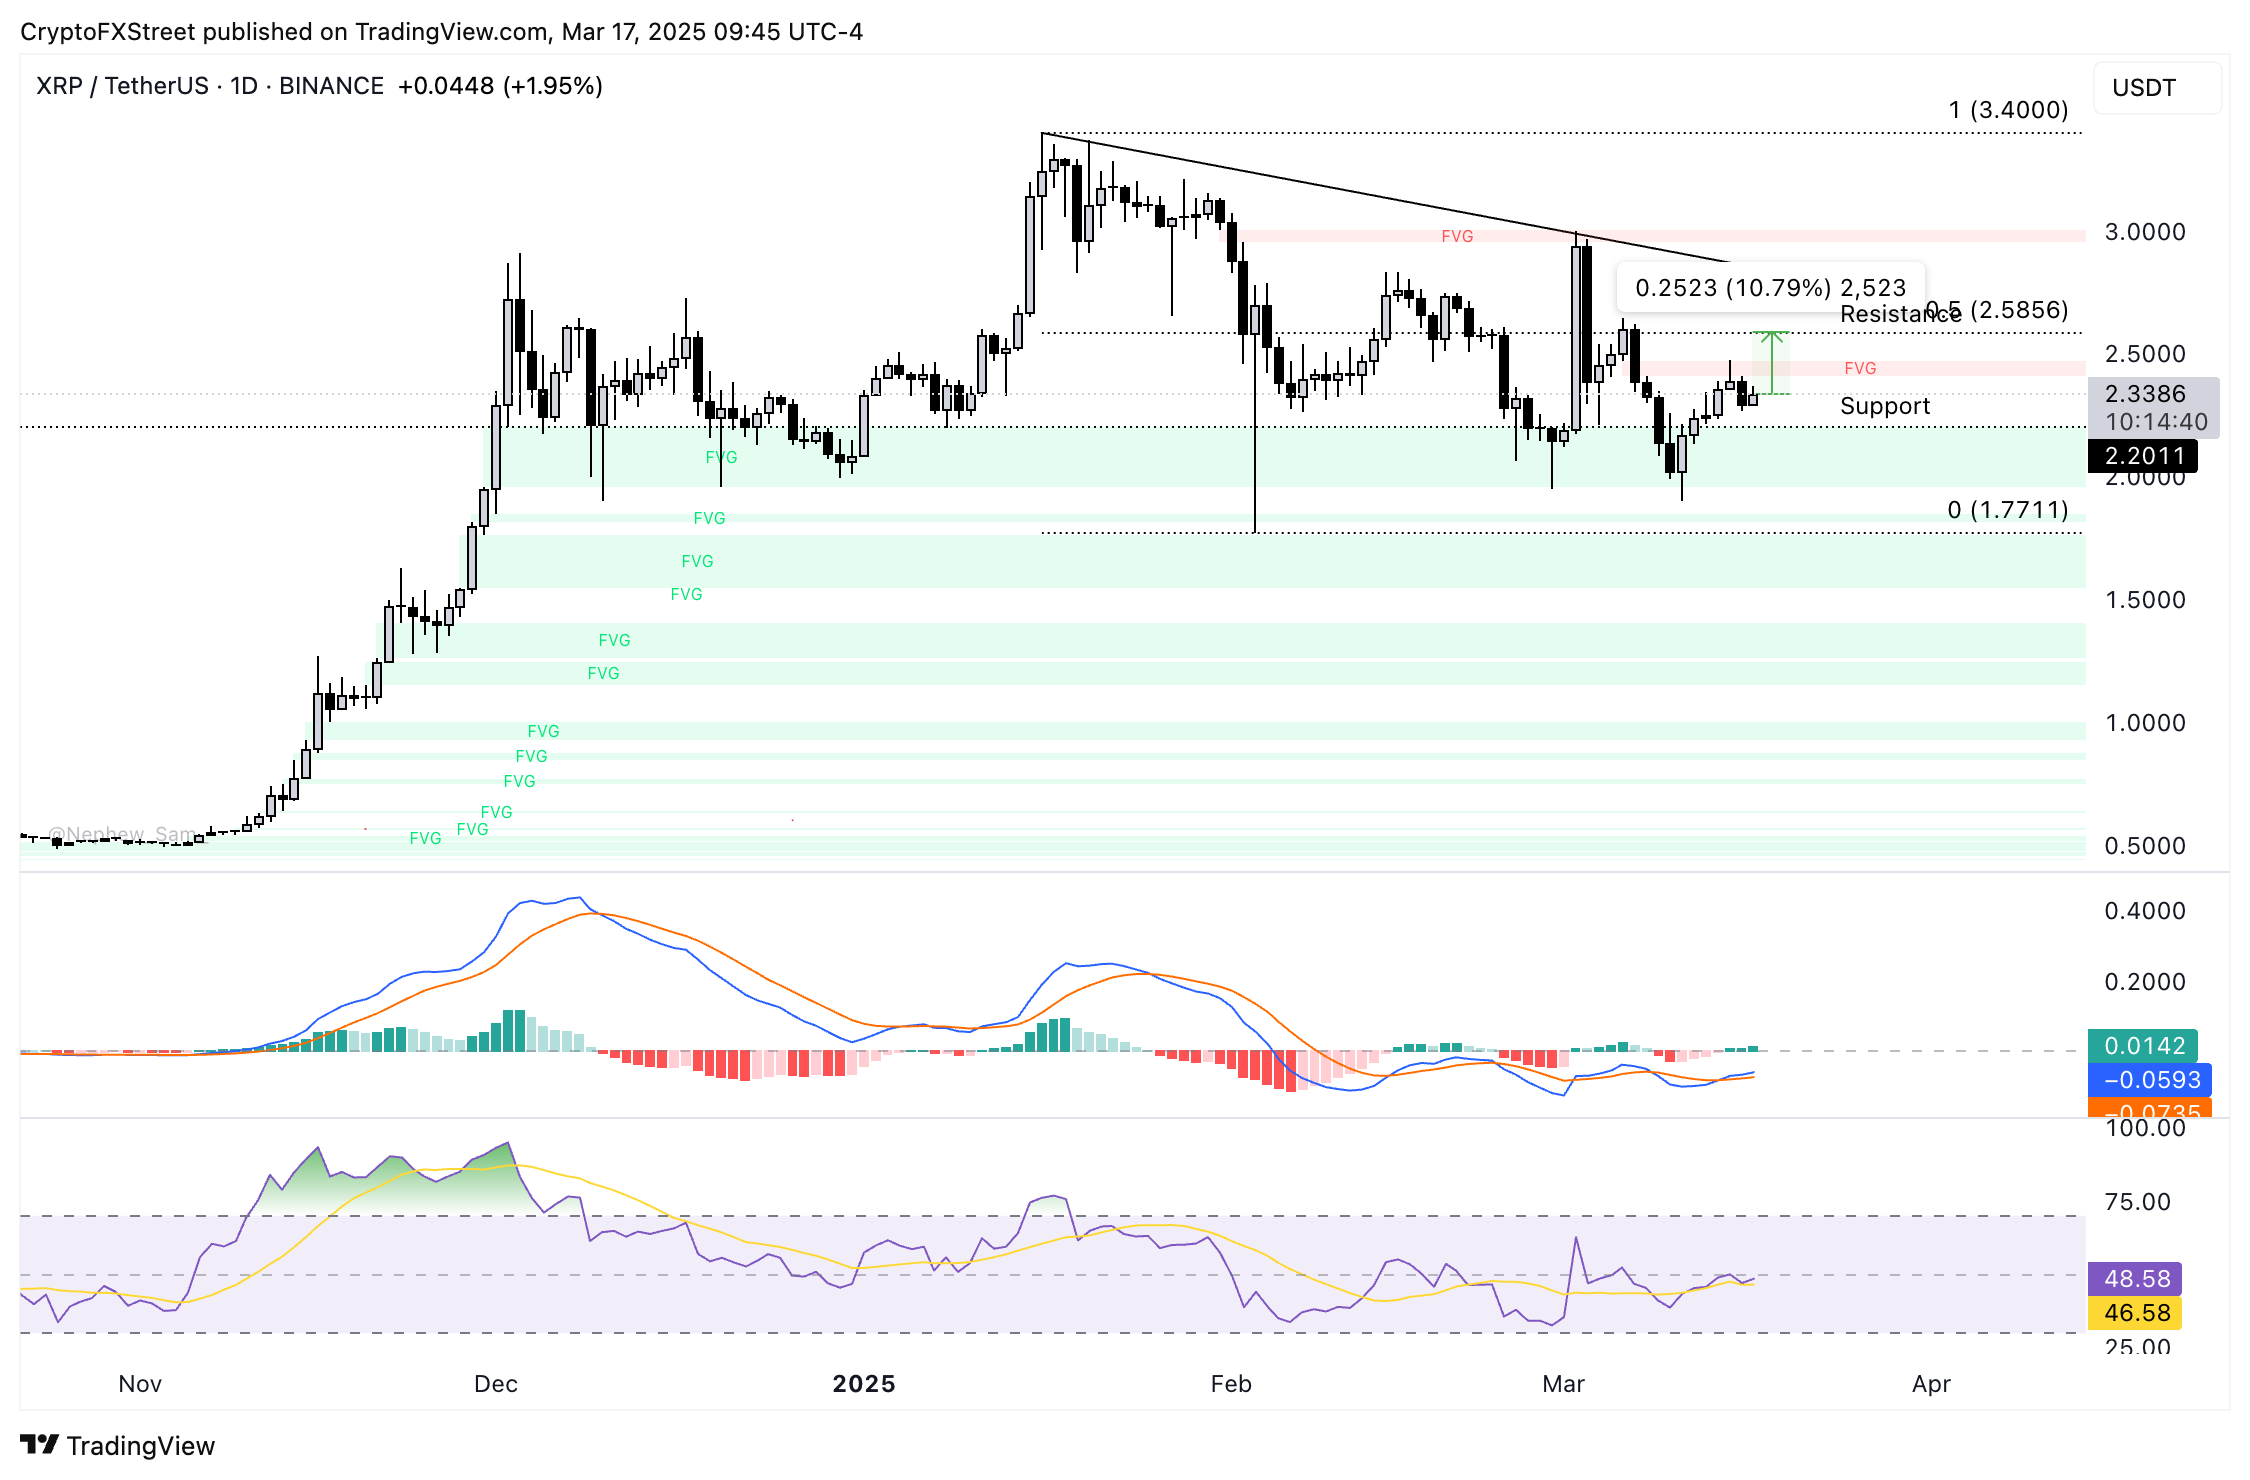
XRP/USDT daily price chart
Should a sudden crash occur in Bitcoin, altcoins such as XRP and Ether may also experience a pullback. In such a scenario, XRP could find support at the multi-month low of $1.7711 if a significant decline takes place.
Analysts share insights on Bitcoin and Ethereum’s trajectory
The Chief Analyst at Bitget Research recently noted that Bitcoin’s recent dip has brought focus to the support levels of $82,000 and $85,000.
He remarked, “This is a typical post-rally consolidation period, which is healthy but also tests whether Bitcoin’s recent momentum has genuine sustainability. Institutional investments and excitement surrounding a potential US Strategic Bitcoin Reserve are bolstering market sentiment, yet with resistance looming between $85,000 and $90,000, breaking through won’t just happen easily.”
“We must also consider macroeconomic factors: any unexpected measures from the FOMC could disrupt the market. If sentiment shifts to bearish, we might see Bitcoin’s price dip toward $75,000 to $80,000, while a favorable macro environment could propel it back to $90,000.”
Recognizing the close correlation between Ethereum and Bitcoin, the analyst added that the altcoin often reacts to Bitcoin’s price shifts:
“The weakness in the ETH/BTC ratio indicates that Ethereum is having difficulties gaining independent strength, even with promising developments in sight. While the upcoming Pectra upgrade and ongoing Layer 2 expansion support a bullish long-term outlook, those fundamentals alone may not be sufficient to breach the $2,300 to $2,500 resistance without Bitcoin leading the way. If market sentiment turns sour, ETH could fall back to $1,800; however, should Bitcoin recover, Ethereum could move towards the upper limits of its range. Right now, it’s a matter of waiting to see if Bitcoin maintains its position or if the market needs a deeper adjustment before the next upswing.”