This week, Mantra’s price experienced a resurgence, with a notable decline in exchange balances hinting at further potential increases.
Mantra (OM), a frontrunner in the tokenization of Real World Assets (RWA), peaked at $7 on Tuesday, marking an increase of nearly 20% from its low point earlier this month.
A significant factor driving the token’s rise is the ongoing reduction in centralized exchange balances observed this week.
According to data from Nansen, the amount of OM tokens held on exchanges has decreased by over 7% in the last seven days, falling to 345.94 million from more than 372 million the previous week. Overall, the proportion of OM tokens on exchanges has declined close to 3%, now at 38.92%.
A drop in exchange reserves suggests that token holders are opting not to sell but instead are transferring their assets to self-custody wallets.
Additional insights reveal that Mantra’s open interest in the futures market is on the rise. As reported by CoinGlass, open interest has surged to over $356 million, up from a low of $319 million earlier this month. This increase in open interest typically reflects a bullish sentiment among investors regarding the token’s prospects.
The rise in Mantra’s price coincides with the developers actively investigating fraudulent accounts ahead of the upcoming GenDrop airdrop, which will allocate OM tokens to engaged community members. In a recent update, the team has removed 123,195 accounts, leaving 80,000 wallets unallocated.
Since the start of 2024, Mantra has emerged as one of the top-performing cryptocurrencies, with its price climbing from nearly zero to close to $10. This rally mirrors the growing trust in MantraChain, which the developers have branded as the quickest and most economical layer-1 network for RWA tokenization.
Moreover, Mantra has secured a license to operate an exchange in Dubai and has entered into an agreement to tokenize assets valued at over $1 billion for a significant real estate firm in the United Arab Emirates.
Mantra Price Analysis
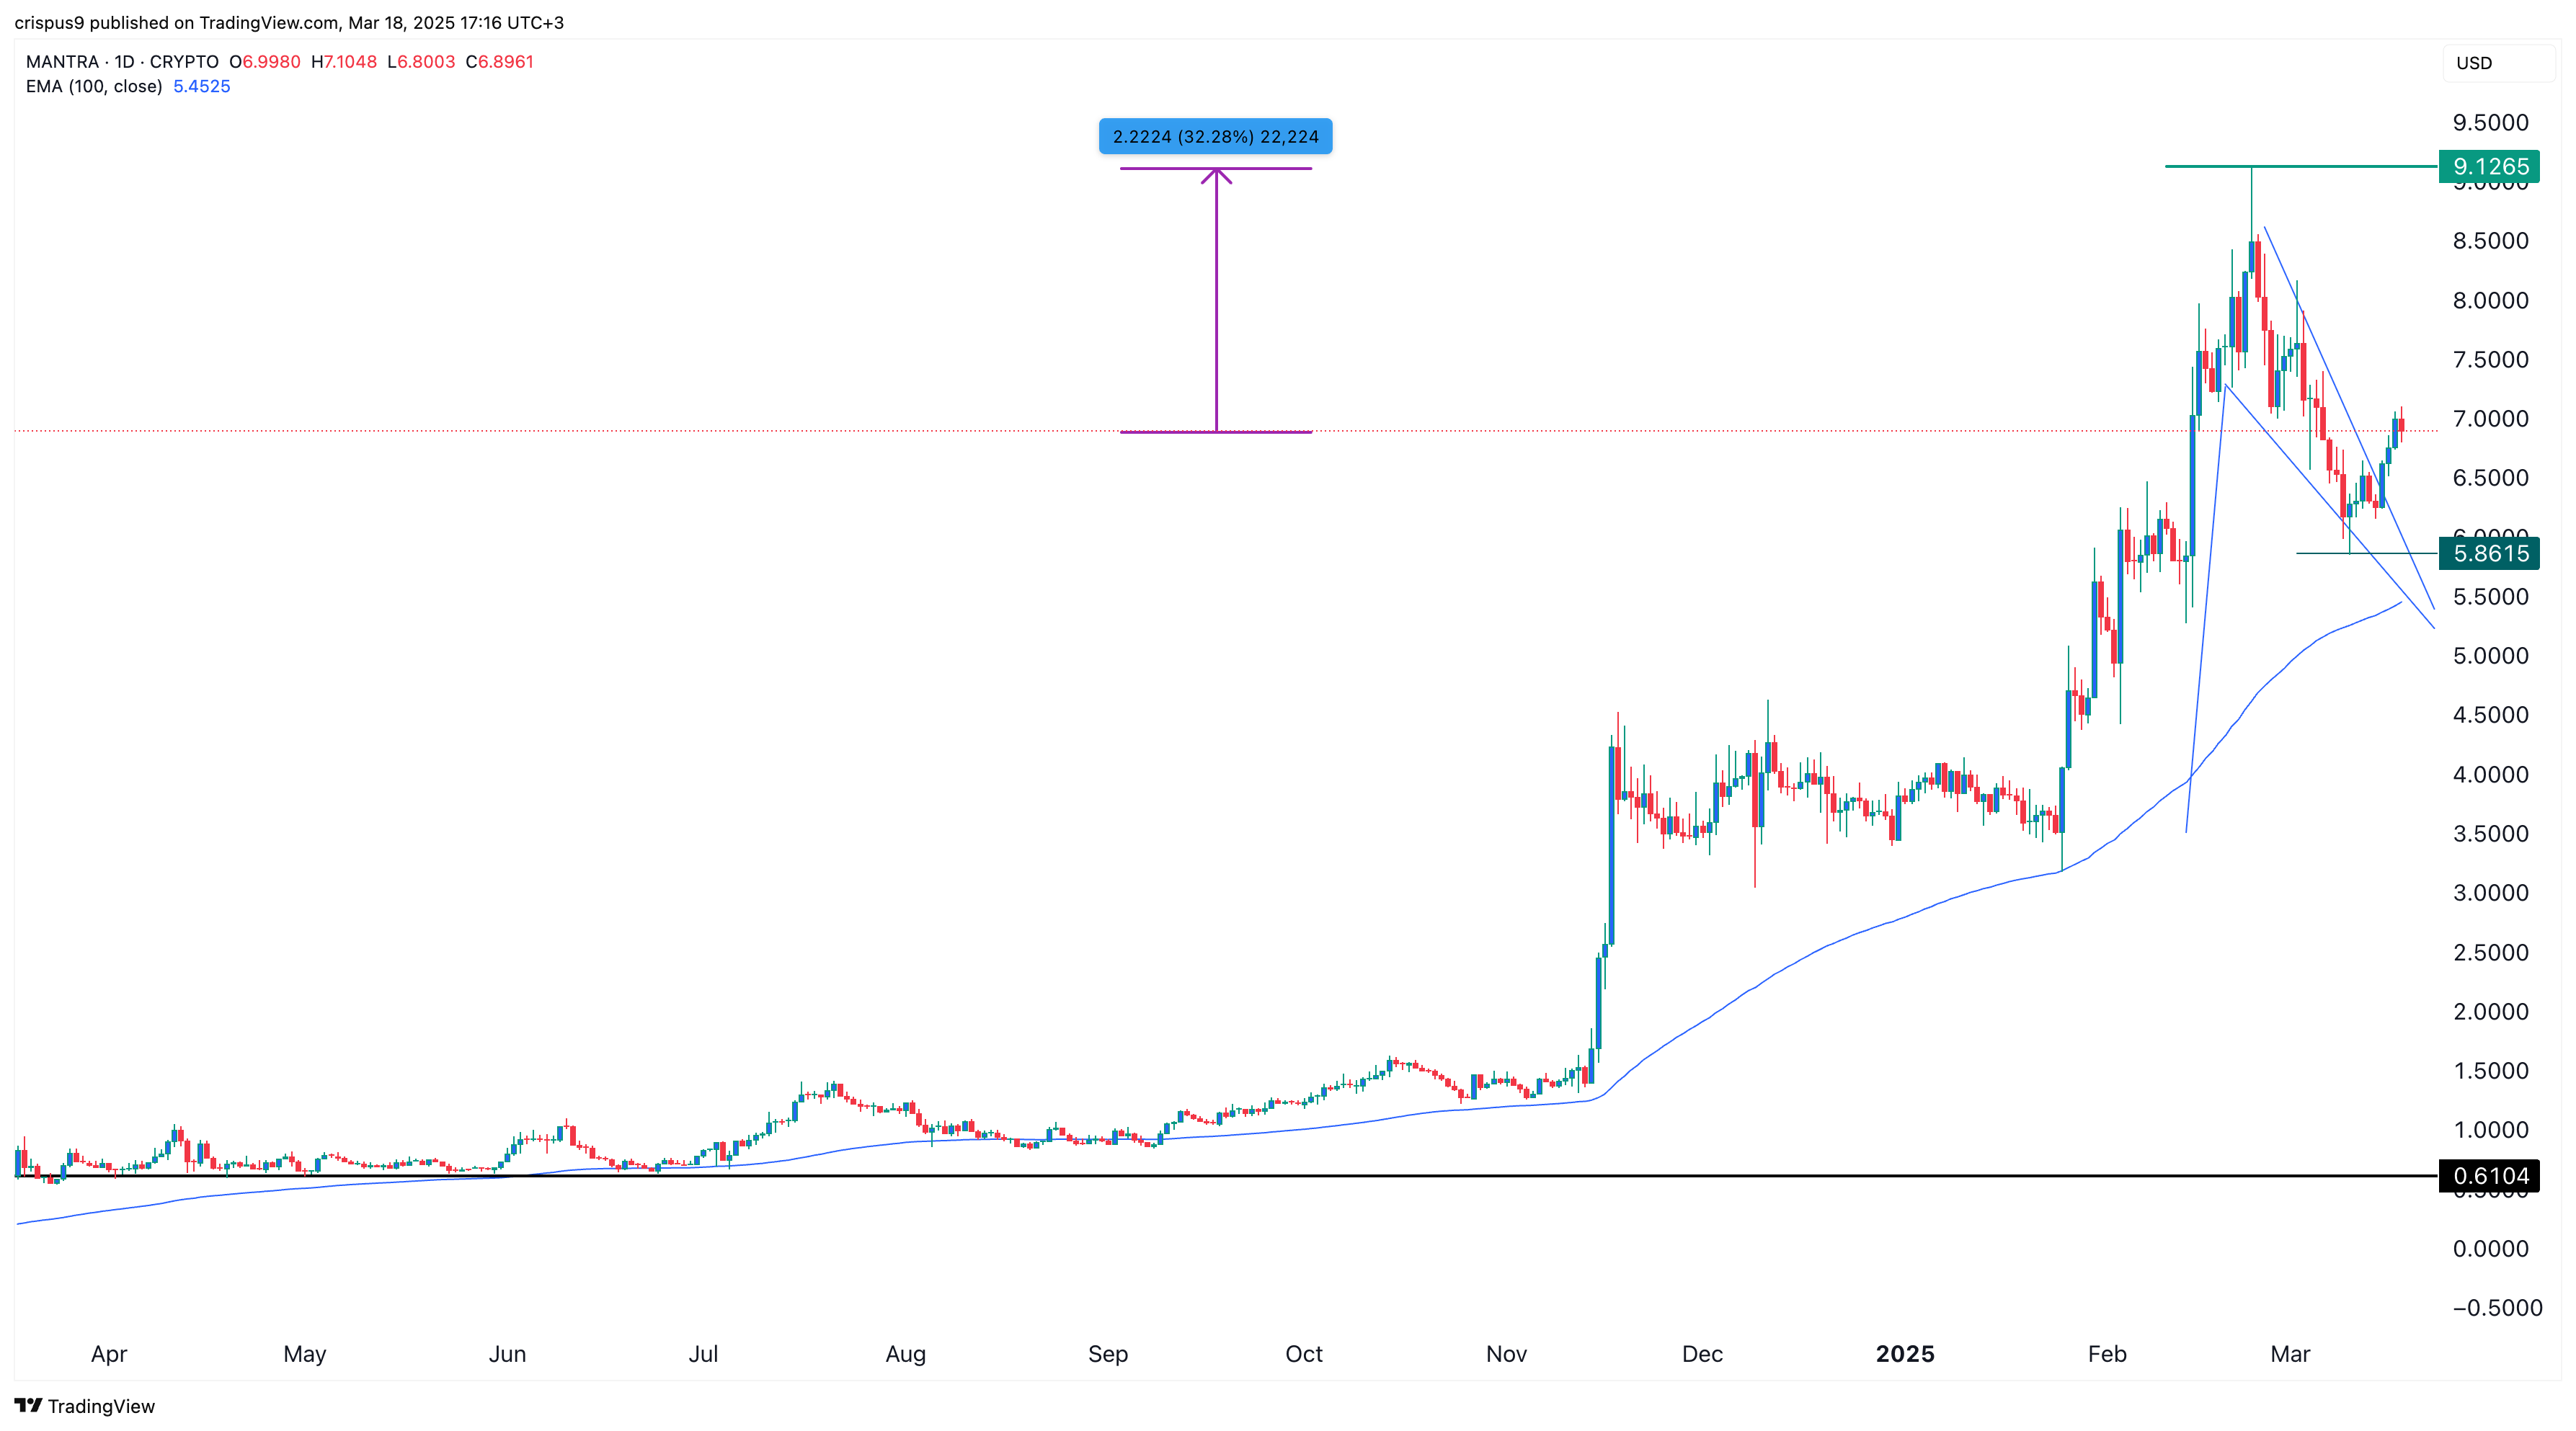
The daily chart indicates that OM’s price hit a low of $5.86 on March 10 and has since bounced back to $6.90.
This recovery followed the emergence of a falling wedge pattern, characterized by two descending, converging trendlines. Additionally, Mantra established a bullish pennant chart pattern, defined by a vertical line intersecting a triangular formation.
The token has also found a support level at the 100-day moving average. Thus, there is a strong likelihood that it may rebound to its all-time high of $9.12, approximately 32% above its current price. Surpassing this level could set the stage for further increases, potentially reaching the significant milestone of $10.