- Solana’s price hovered around the $128 level on Monday, unaffected by several active bullish catalysts.
- Recent SOL unlocks from Alameda Research, ahead of repayments for FTX creditors, have created a persistent bearish sentiment since early March.
- The falling wedge pattern suggests that SOL might retest its 50-day peak of $259 during the next rebound phase.
On Monday, Solana (SOL) struggled to move beyond the $128 mark, even with various bullish factors in play. The recent unlocking of SOL tokens by Alameda Research, in preparation for FTX creditor repayments, has cast a long-lasting bearish shadow since the start of March.
Solana (SOL) remains under $130 despite new bullish developments
Since the beginning of March 2025, Solana has lagged behind competing layer-1 altcoins. Significant events, including progress on ETF filings and Donald Trump’s announcement to add SOL to a crypto strategic reserve, have served as bullish indicators. However, while altcoins such as XRP, Cardano, and Litecoin have seen gains on similar news, Solana has struggled to build on any upward momentum.
This trend continued into Monday, with Solana remaining capped below the $130 resistance, despite two notable positive market events.
CME introduces Solana Futures, yet price action stays muted
After its announcement in February, the Chicago Mercantile Exchange (CME) officially kicked off Solana futures trading on Monday.
The first day saw trading volumes reach $5 million, indicating a rising interest from institutional investors.
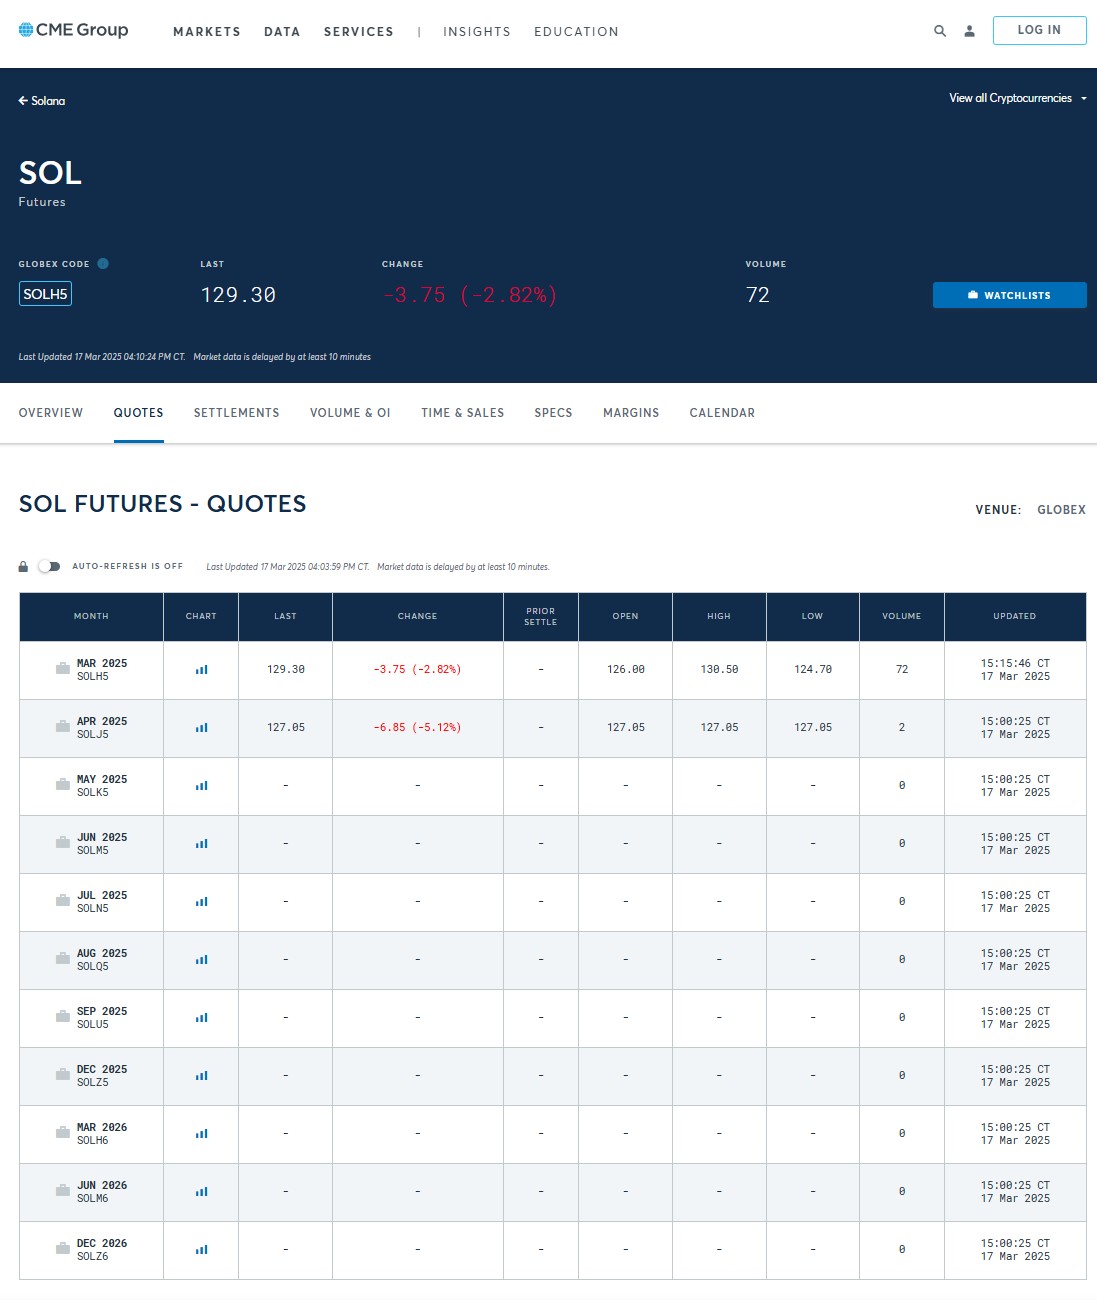
Solana futures first day trading volumes reached $5 million | Source: CME Group
Although this development uplifted investor sentiment, it did not result in immediate buying pressure, leaving SOL still below the $130 resistance.
Solana Celebrates 5th Anniversary: A milestone overshadowed by market behavior
In another major positive development this week, the Solana team marked the blockchain network’s fifth anniversary with a celebratory post on March 16, 2025.
Founded in March 2020 by Anatoly Yakovenko, Solana’s anniversary features impressive record-breaking statistics.
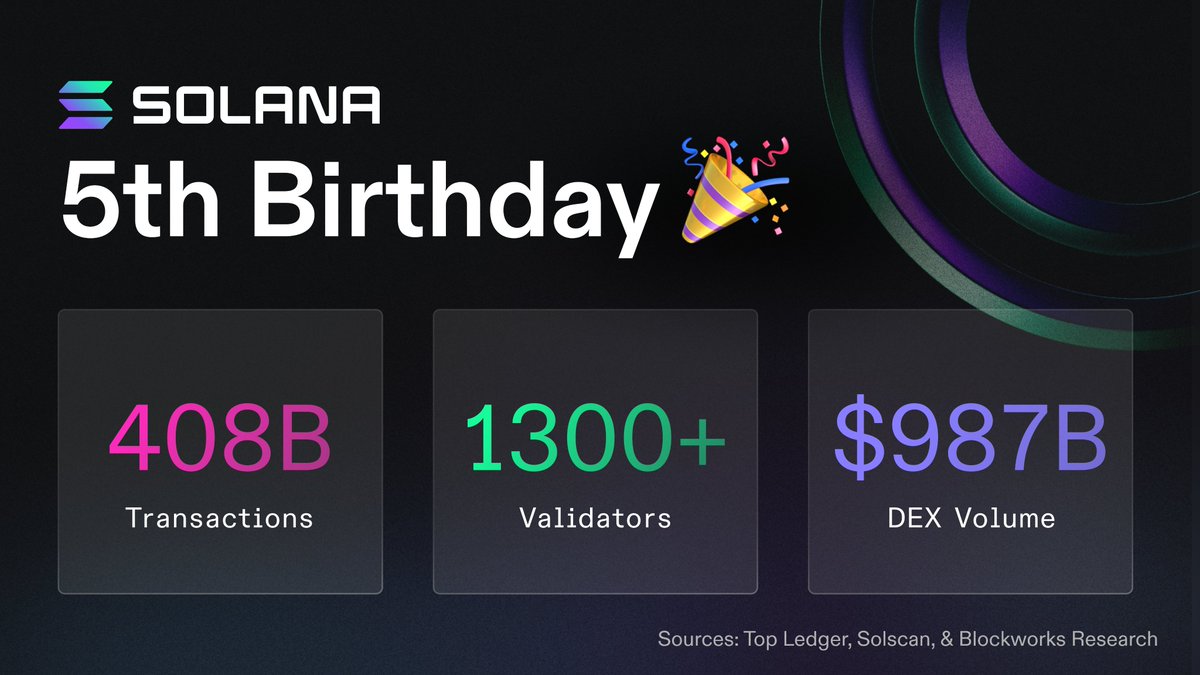
Statistics from Solana’s fifth anniversary in March 2025 | Source: X.com/Solana
The anniversary post on X reveals that the Solana blockchain has successfully processed over 408 billion transactions, secured by over 1,300 validators, and facilitated an enormous total volume exceeding $987 billion. These achievements solidify Solana’s status as one of the three leading layer-1 blockchains, well-known for its speed and scalability.
Despite a range of planned ecosystem events in celebration, Solana’s fifth anniversary did not provoke a price rally on March 17, with SOL trading sideways at around $128.
Why is SOL stagnant despite significant catalysts?
Outflows from the FTX estate have created a sustained bearish sentiment surrounding Solana prices since the beginning of the month.
On March 1, 2025, the FTX estate and Alameda Research commenced the un-staking of 11.2 million SOL tokens, worth approximately $1.5 billion.
By March 4, blockchain analytics company Spot On Chain reported that 3.03 million SOL tokens ($432.5 million) had been unstaked and spread across 37 wallets, including 24,799 SOL ($3.38 million) already transferred to Binance.
This marked the largest single un-staking event since November 2023, when FTX began liquidating assets post-bankruptcy. To date, a total of 7.83 million SOL has been unstaked, leaving around 5.5 million SOL ($693.8 million at $126 per SOL) still locked in staking reserves, according to Arkham Intelligence.
SOL Price Outlook: Falling Wedge pattern indicates a $259 breakout after prolonged consolidation
As more sell-offs from the FTX estate are anticipated, potential new buyers are cautious about amassing SOL at existing levels, perpetuating the price stagnation. However, bullish traders may view SOL as a potential hold since prolonged consolidation often leads to significant price breakout phases.
Technical indicators from the SOLUSD daily chart provide data-driven insights that support a hopeful long-term perspective on Solana’s price trends.
The SMA death cross indicates that the 50-day moving average has dipped below the 200-day moving average, confirming the continuing bearish momentum linked to month-long sell-offs from the FTX estate.
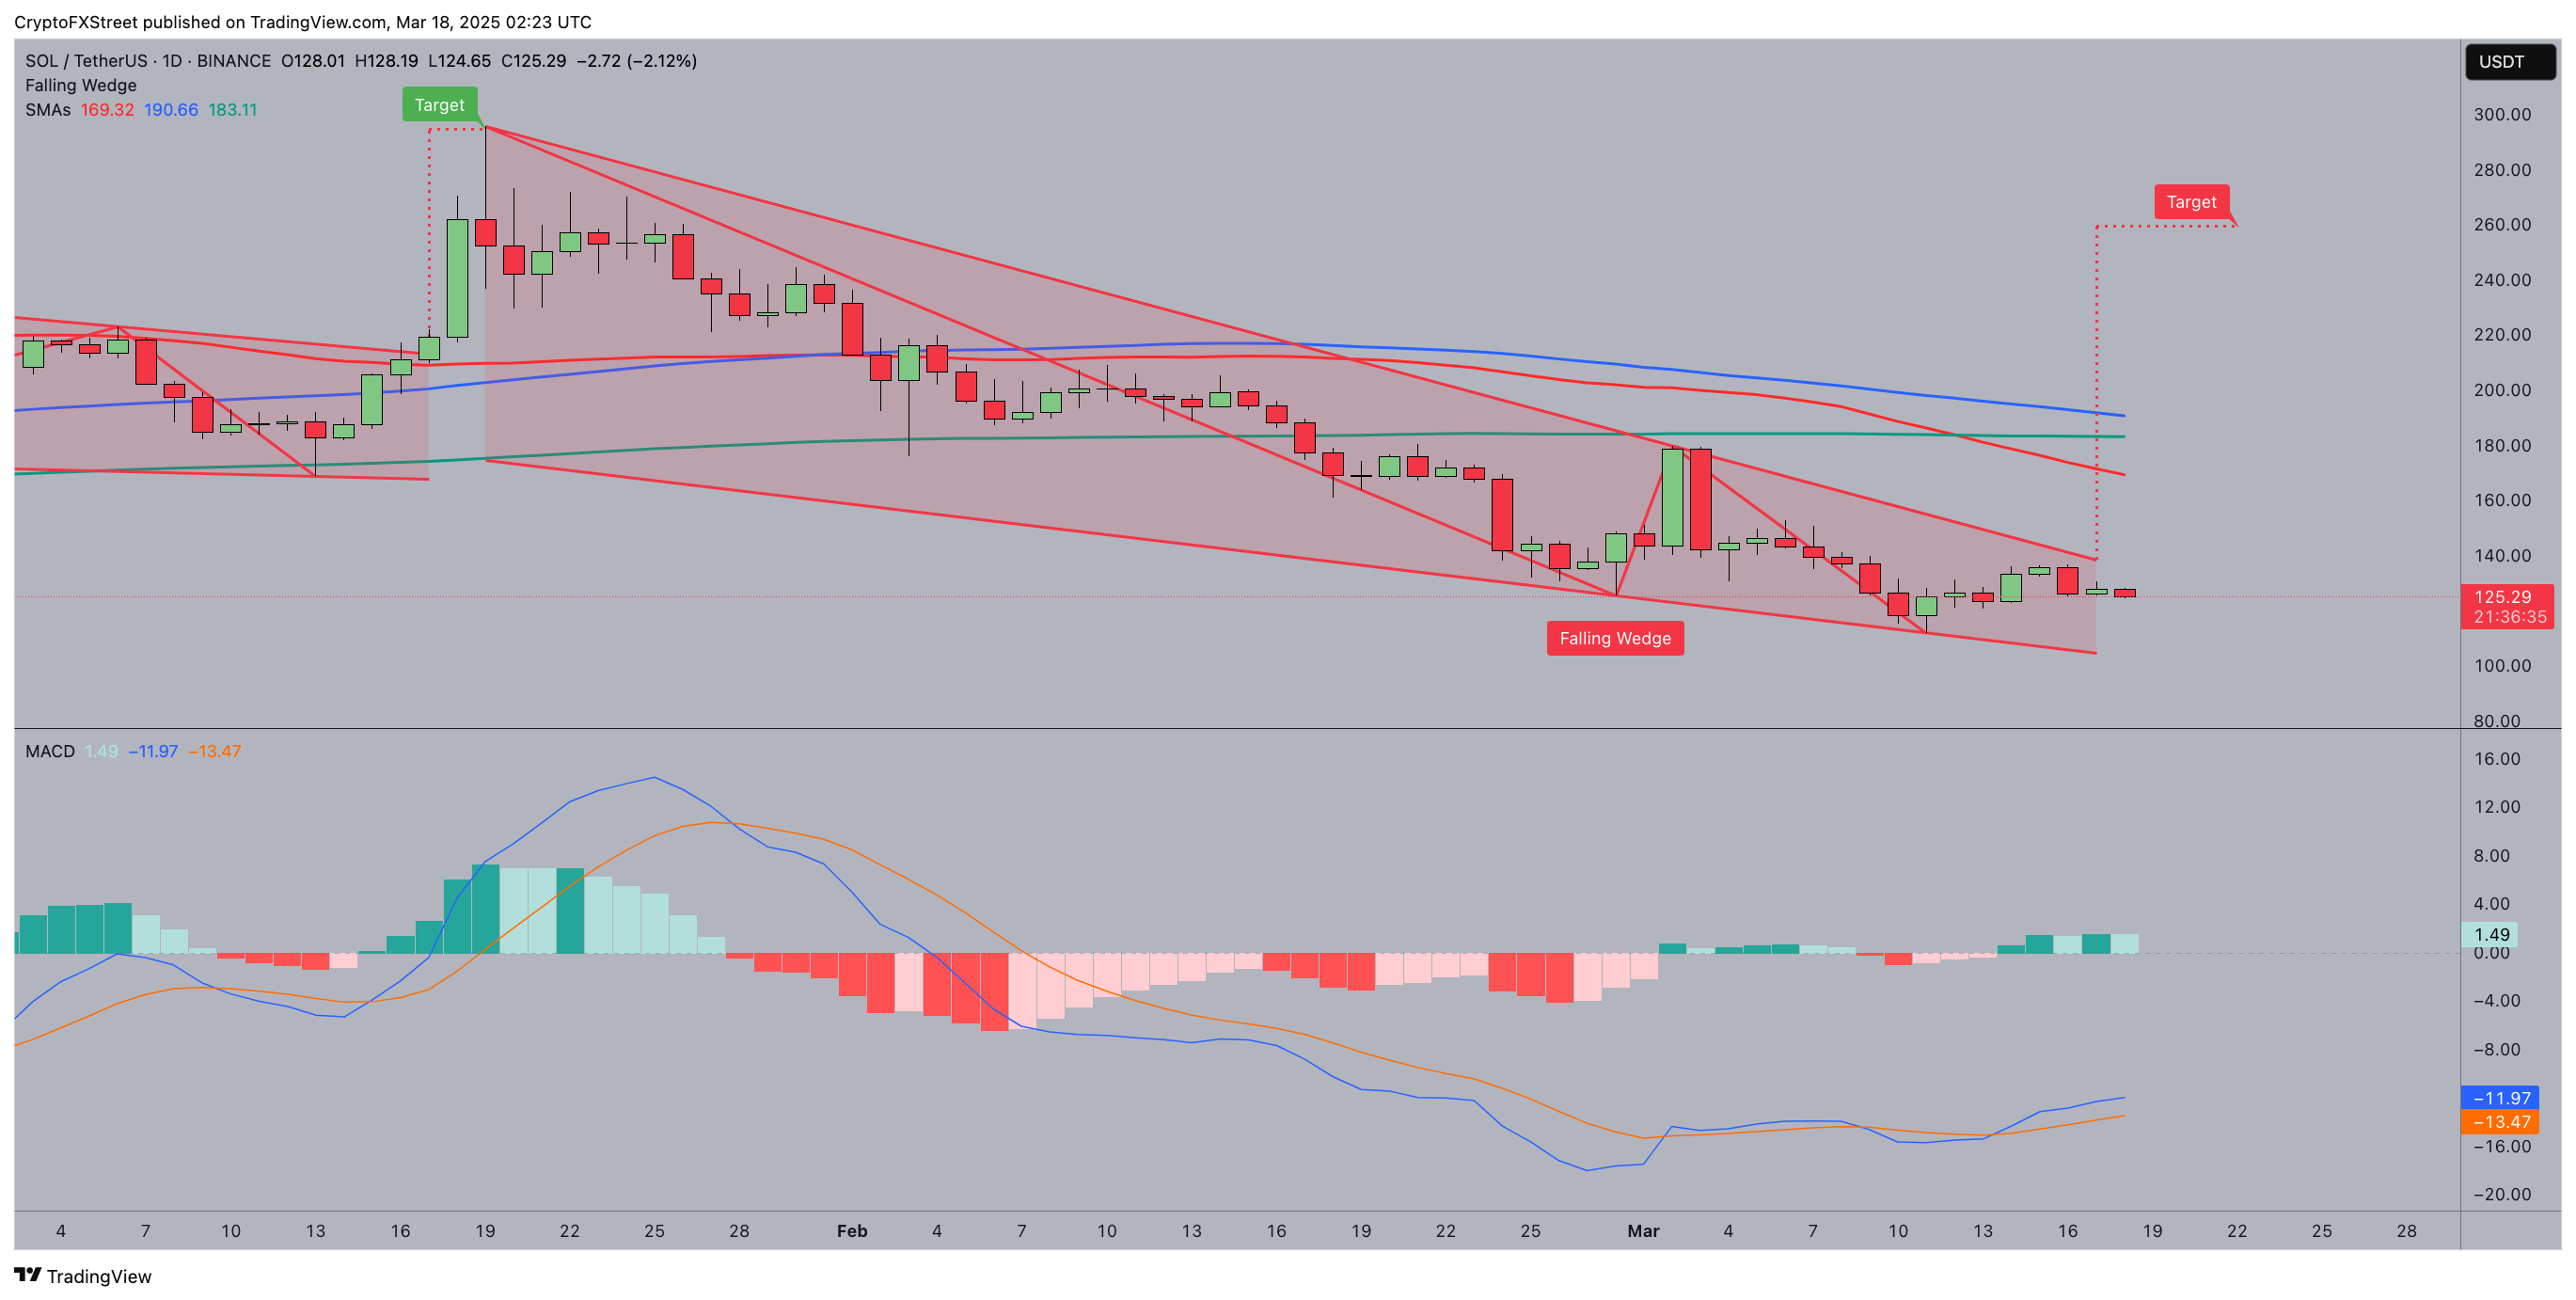 Solana price forecast | SOLUSDT
Historically, such crosses suggest prolonged downtrends. However, they may also signify oversold conditions when paired with strong reversal patterns. In this case, the Falling Wedge pattern indicates a near-term breakout for Solana as selling pressure eases off.
Additionally, the MACD histogram is showing early signs of bullish divergence, with green bars suggesting a potential shift in momentum. If the MACD signal line crosses above the baseline, it could confirm a buy signal, in line with previous cycles where similar conditions led to sharp price recoveries.
However, if SOL fails to break beyond the $130-$140 resistance zone, it may lead to prolonged consolidation or a revisit of lower support levels around $115-$120 before a possible uptrend resumes.
A successful breakout from the Falling Wedge would position SOL toward a targeted range of $169-$190, coinciding with the 50-day resistance zone, before potentially aiming for $259, a level last seen in January 2025.