The global M2 money supply has reached unprecedented levels—so why hasn’t Bitcoin taken off? Is there an issue at play, or is a delayed surge on the horizon?
Markets in turmoil ahead of the Fed meeting
As we approach the Federal Reserve’s meeting on March 18-19, market sentiment is fraught with uncertainty amid fluctuating economic conditions. Stock markets are experiencing setbacks, inflation remains stubborn, and investors are reevaluating their forecasts regarding interest rate reductions.
Compounding this volatility, President Trump’s tariff strategies and federal workforce reductions have sparked fresh worries about the economy’s larger landscape, contributing to instability in an already sensitive market.
Despite this chaos, the Federal Open Market Committee is largely anticipated to maintain interest rates at 4.25-4.5%, with projections indicating a 99% likelihood of no immediate changes, according to the CME Group’s FedWatch tool.
The key question is when the first rate cut will occur. Predictions suggest the possibility of a cut in June, with a projected 55% chance that rates will shift to the 4-4.25% range.
Investors overall expect a cumulative reduction of 0.75 percentage points by 2025, which could bring the Fed’s benchmark rate down to between 3.5% and 3.75%.
In light of this uncertainty, financial markets have reacted intensely. The S&P 500 has plunged over 8% from its historic peak on February 19, while the Nasdaq faced a 4% drop on March 10, marking its worst trading day since 2022.
The volatility index has climbed to its highest point since August, illustrating the challenges investors encounter due to fluctuating policies, especially relating to Trump’s tariff increases.
Bitcoin (BTC) has also struggled to maintain traction, remaining steady around $82,300 as of March 18—a steep decline of nearly 25% from its record high of $109,114 in January.
What’s next? How will markets respond if the Fed signals a policy shift? And what implications will this hold for cryptocurrencies in the coming weeks?
Escalating M2 liquidity
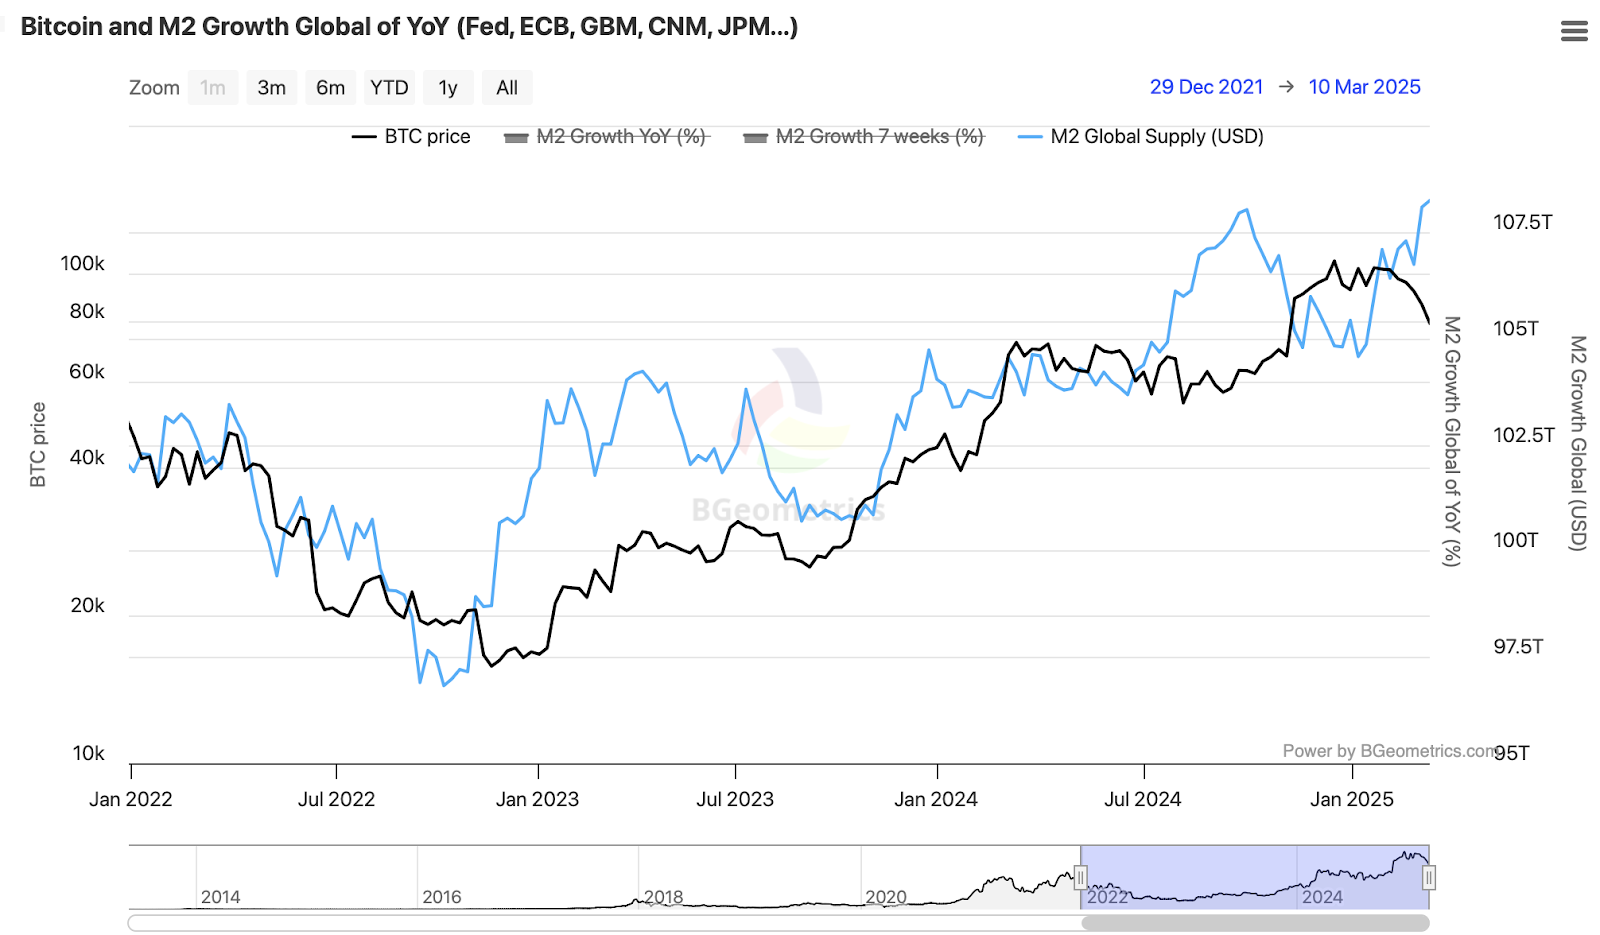
Global liquidity is on the rise, and historical patterns indicate that risk assets such as Bitcoin may soon react. As of March 10, the global M2 money supply hit a record high of $108.2 trillion, reflecting a 3.5% increase from its 2025 low of $104.5 trillion recorded on January 6.
Yet, despite this rise in liquidity, Bitcoin’s price movements have displayed inconsistencies, raising questions about a possible delayed reaction.
As a wide-ranging indicator of global liquidity, M2 comprises cash, checkable deposits, and easily convertible near-money assets.
Typically, increases in M2 lead liquidity to flow into high-yield investments, resulting in surges in stocks, commodities, and Bitcoin. Conversely, declines in M2 generally align with risk-off periods, where assets struggle to find upward momentum.
A review of historical data underscores Bitcoin’s robust correlation with M2 growth. The most significant bull markets for Bitcoin have typically occurred alongside rapid liquidity expansion, while downturns in M2 have often preceded price declines or extended periods of consolidation.
However, an essential factor to consider is that Bitcoin does not necessarily respond immediately to liquidity increases. Research indicates an average lag of about 10 weeks before Bitcoin adjusts to fluctuations in M2 growth.
The M2 chart mentioned above further illustrates this trend. Bitcoin’s recovery from its 2022-2023 lows coincided with a substantial increase in M2, and similarly, in mid-2024, a renewed M2 expansion was followed by Bitcoin reaching new peaks.
In early 2025, however, while M2 continued to rise, Bitcoin entered a consolidation phase. The critical element appears to be the rate of change in liquidity rather than its absolute level.
A more in-depth analysis of Bitcoin’s annual returns against the year-over-year change in M2 reveals a more pronounced pattern—Bitcoin’s strongest bull runs are generated when liquidity growth accelerates sharply instead of remaining steady.
Thus, mere M2 expansion does not suffice to trigger a breakout; a rapid increase in M2 growth must occur.
Quantitative tightening may be nearing its conclusion
The Federal Reserve’s quantitative tightening (QT) initiative, which has been ongoing since June 2022, may be entering its final stages.
As of March 18, over $6.2 million has been wagered on the outcome regarding the end of QT, with traders indicating a 100% probability that it will cease by April 30.
QT stands in stark contrast to quantitative easing (QE). Instead of injecting liquidity by purchasing bonds, the Fed has been allowing assets to mature and be removed from its balance sheet, effectively retracting money from circulation.
This approach, accompanied by aggressive rate hikes, has successfully mitigated inflationary pressures but has also imposed liquidity constraints affecting market conditions. While stocks and cryptocurrency markets have managed to rally despite the tightening effects of QT, there are growing concerns that continued reduction of the balance sheet may withdraw liquidity readily available at a time when economic uncertainties are rising.
Minutes from the January FOMC meeting revealed that several policymakers expressed openness to either slowing or halting QT, largely due to uncertainties tied to the federal debt ceiling and fluctuating money market dynamics.
Analysts note that the Treasury Department’s extraordinary measures to sustain government operations have been injecting temporary liquidity into the system.
This has made it challenging for the Fed to accurately assess true reserve levels, creating the risk of excessive liquidity withdrawal, which could amplify market volatility.
While expectations grow for an end to QT in the near future, opinions vary among analysts regarding timing.
Some analysts at Barclays predict that QT will conclude between September and October, asserting that pausing in March or May would be inefficient if reductions need to be restarted later.
In contrast, Wrightson ICAP analysts believe the Fed is more likely to slow the rate of asset runoffs rather than stop them completely, suggesting that a total halt could complicate the need for future asset purchases and create communication challenges for policymakers.
Other entities, like LH Meyer, caution that any pause in QT could risk turning into a complete stop, already a challenge if market conditions remain precarious.
The Fed faces difficulties in gauging the right time to stop measures due to mixed signals arising from liquidity indicators.
A survey of leading banks and money managers conducted prior to the latest policy meeting indicated that QT might conclude between June and July.
Fed holdings, which have already diminished from a peak of $9 trillion in 2022 to $6.8 trillion, are expected to further decline to approximately $6.4 trillion by the end of the QT process.
However, predictions suggest that bank reserves will only decrease to $3.125 trillion, down from the current $3.3 trillion, while the Fed’s reverse repo facility—a measure of excess liquidity—has consistently remained below $100 billion throughout February, signifying that financial conditions might already be tighter than intended.
Historically, the unwinding of QT has required careful handling, and indications from the Fed signaling a cessation in the coming months could effectively mark the program’s end.
Should this occur, the repercussions could extend broadly—resulting in lower long-term interest rates, a weaker dollar, and possibly heightened demand for risk assets, including Bitcoin and equities.
Liquidity rise intersects with institutional uncertainty
While the increasing M2 money supply has historically signaled the onset of Bitcoin bull runs, on-chain indicators and institutional activities suggest that the short-term outlook may not align with this pattern just yet.
Despite global M2 reaching record heights, Bitcoin’s price behavior demonstrates signs of fatigue. Ki Young Ju, CEO of CryptoQuant, alerts that “all on-chain metrics indicate a bear market,” noting dwindling liquidity and large holders offloading BTC at lower prices.
His analysis leverages Principal Component Analysis (PCA) across various metrics, implying Bitcoin’s price might not react immediately to rising liquidity.
A significant metric to monitor is MVRV (Market Value to Realized Value), which compares Bitcoin’s market value to the last transacted price, helping assess whether BTC is overvalued or undervalued.
Another vital metric is SOPR (Spent Output Profit Ratio), measuring whether Bitcoin holders are selling at a profit or at a loss.
Additionally, NUPL (Net Unrealized Profit/Loss) assesses the overall profitability of Bitcoin holders based on unrealized gains and losses across the network.
According to these indicators, Bitcoin might be entering a consolidation period lasting 6–12 months—a trend historically observed after significant bull runs.
If this theory holds, Bitcoin’s response to rising liquidity could manifest more gradually rather than immediately, echoing previous cycles where liquidity expansions took months to influence price movements positively.
Simultaneously, institutional challenges are intensifying. The U.S. government has recently adopted a Bitcoin Strategic Reserve, marking a pivotal shift in its perspective on Bitcoin as an asset.
However, this step has not been welcomed by international financial institutions. Max Keiser, an ardent Bitcoin supporter and a senior advisor to the government of El Salvador, highlights that the IMF and credit rating agencies have begun downgrading the U.S. credit rating, attributing this to Bitcoin’s “destabilizing effect.”
Keiser warns that the IMF is now advocating for the swift liquidation of the BSR, stirring worries about potential political pressure on U.S. Bitcoin reserves.
If the U.S. government begins selling its Bitcoin holdings in response to such pressures, it could create additional downward pressure, at least in the short term.
Investors should exercise caution regarding imminent volatility, paying close attention to liquidity trends and government interventions. Bitcoin’s trajectory in the coming months may require a wait-and-see approach before notable movements manifest.
Invest wisely and ensure you never invest more than you can afford to lose.
Disclaimer: This article is not intended as investment advice. The content and materials provided here are meant for educational purposes only.