- Bitcoin is encountering resistance near its 200-day EMA at $85,500; a strong close above this level may signal a recovery is forthcoming.
- Ethereum is finding support around the $1,861 mark, indicating a potential rebound is on the horizon.
- XRP is facing rejection near the 50-day EMA at $2.50; a close above this point suggests a recovery is likely.
Bitcoin (BTC) and Ripple (XRP) are both experiencing resistance at critical levels; a solid close above these may suggest a recovery, whereas Ethereum (ETH) appears to have support at a vital level, hinting at an upcoming bounce.
Bitcoin could rebound if it finishes above the 200-day EMA
The price of Bitcoin has been encountering resistance at the 200-day Exponential Moving Average (EMA) near $85,496 since Friday and is currently trading below this threshold. This level aligns closely with a daily resistance point at $85,000, establishing it as a significant resistance area. As of Wednesday, it is trading around $82,600.
The Relative Strength Index (RSI) indicates a strengthening momentum on the daily chart. The lower low in Bitcoin’s price seen on March 11 does not align with a higher high in the RSI for the same timeframe, which is recognized as bullish divergence, frequently leading to a trend reversal or short-term surge.
If this bullish divergence materializes and BTC manages to close above its 200-day EMA at $85,496, a recovery to $90,000 could be on the table.
BTC/USDT daily chart
Conversely, should BTC correct and close beneath $78,258 (the February 28 low), it may extend its decline to revisit the next support level at $73,072.
Ethereum could rebound if the $1,861 support remains intact
The price of Ethereum has been consistently finding support around its daily level of $1,861 since last week. As of Wednesday, it is trading slightly above $1,930.
If the daily support at $1,861 holds, the price of ETH may continue its recovery and aim to retest the March 7 high of $2,258.
The RSI on the daily chart reads 36 after bouncing off its oversold level of 30 last week, signaling a decline in bearish momentum. However, for a sustained recovery rally, the RSI must rise above its neutral level of 50.
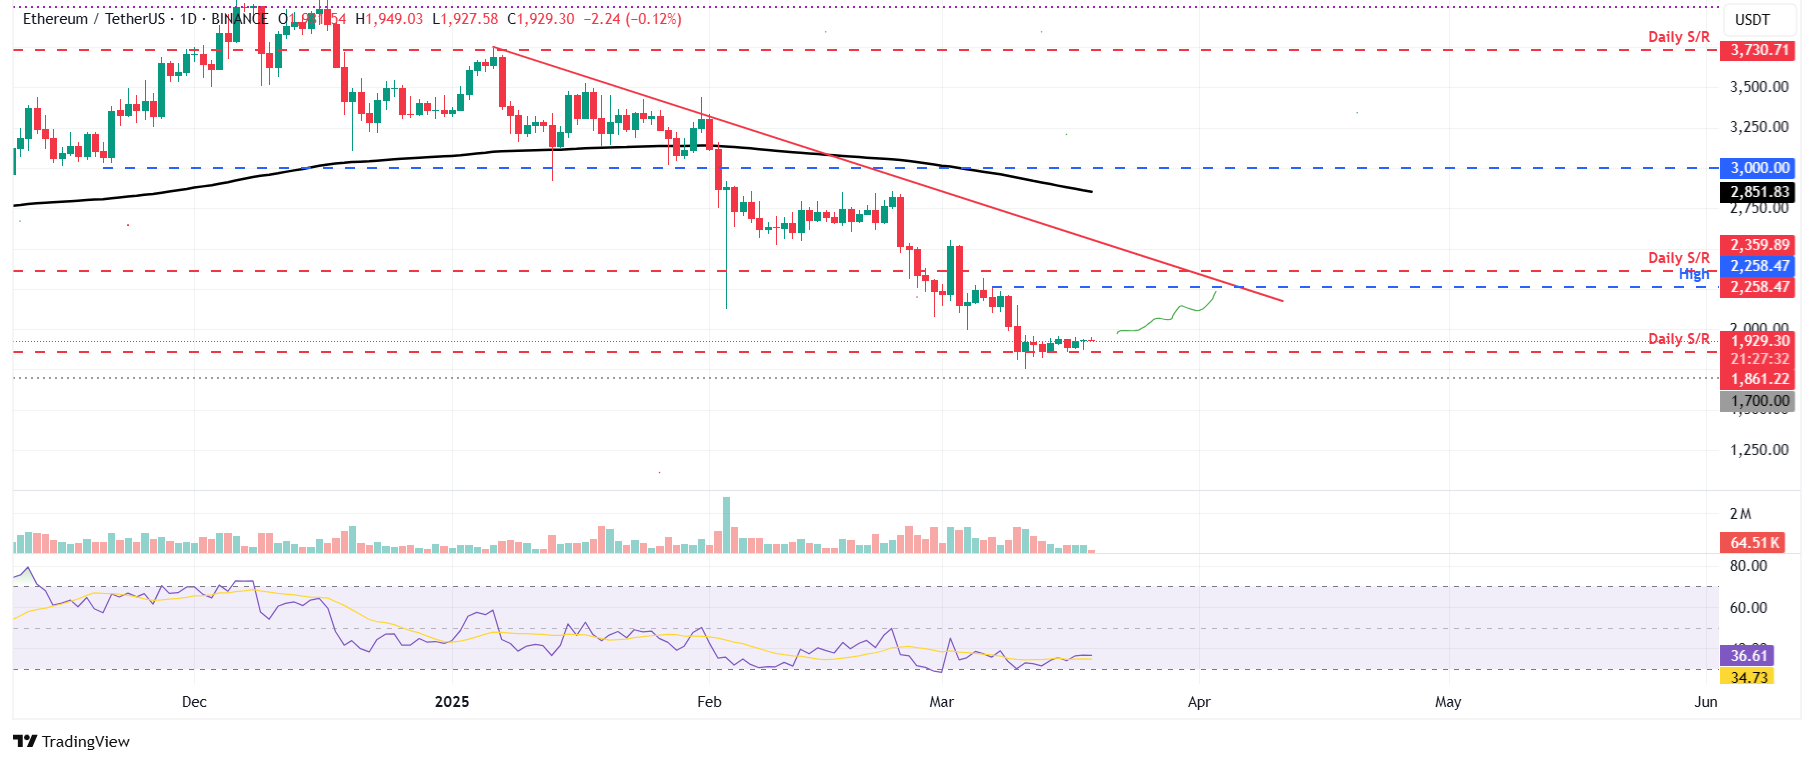
ETH/USDT daily chart
On the flip side, if ETH falls below the daily support at $1,861, it could further decline to retest the next support level at $1,700.
XRP momentum indicators reflect indecision among traders
Ripple’s price tested its daily support at $1.96 on March 11 and made a recovery of 10.14% in the following four days. However, it met resistance at the 50-day EMA near the $2.50 mark on Saturday, leading to a decline of 4.38% by Tuesday. As of Wednesday, the price hovers around $2.27.
If XRP breaks above and maintains a close over the 50-day EMA at $2.50, it may continue its recovery to challenge the $2.72 level.
The RSI on the daily chart stands at 46, lingering near the neutral level of 50, suggesting a lack of clear direction among traders. For bullish momentum to persist, the RSI needs to rise past its neutral mark of 50.
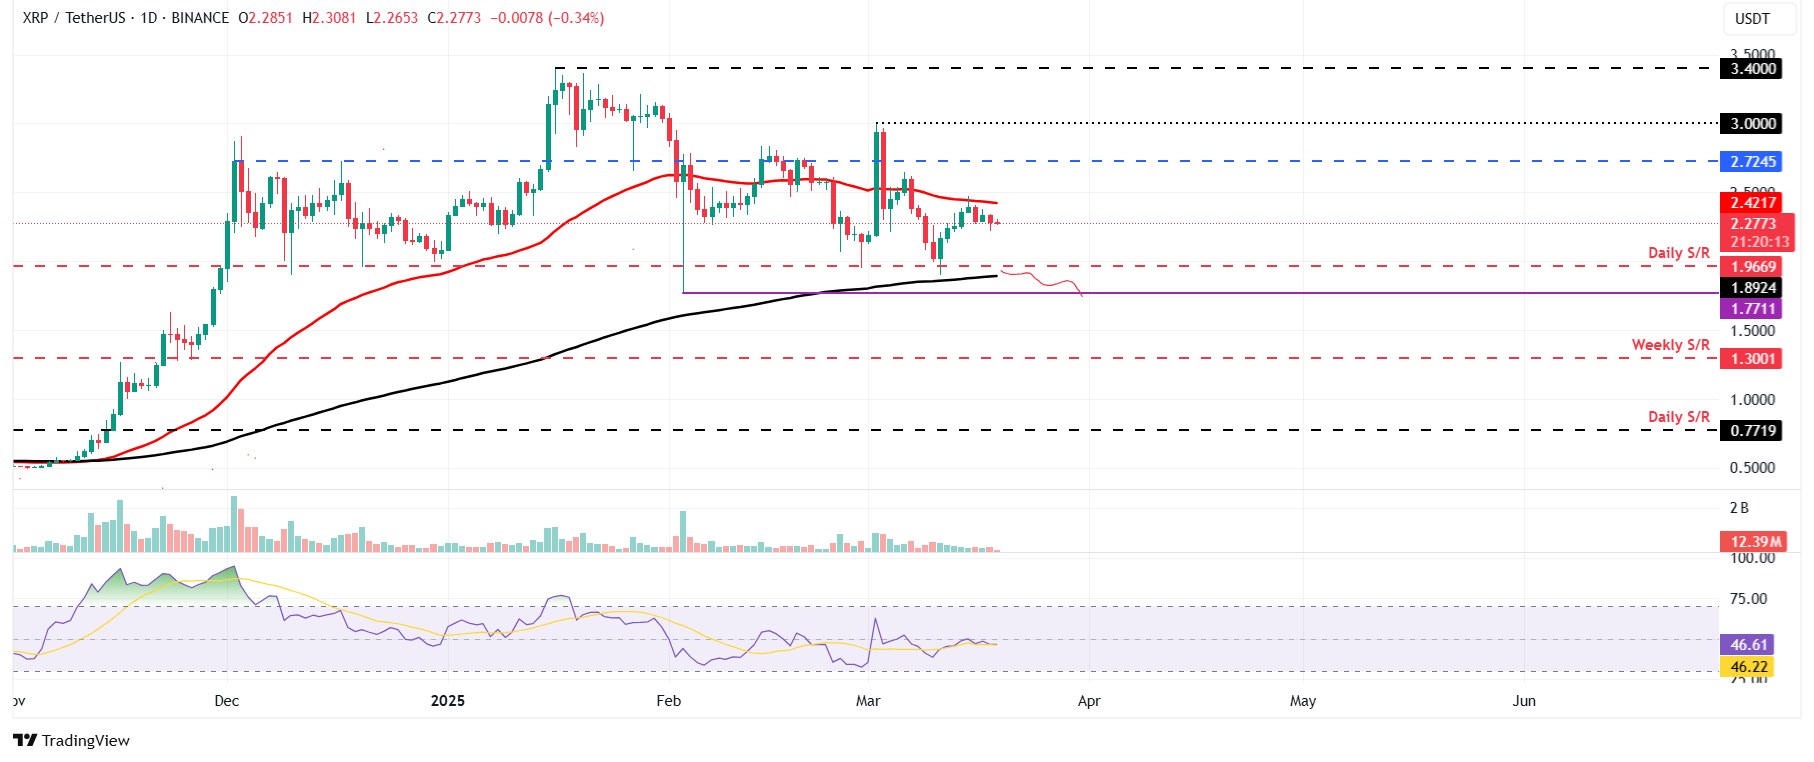
XRP/USDT daily chart
Nevertheless, if XRP undergoes a correction and closes below the daily support of $1.96, it could lead to another decline to test the February 3 low at $1.77.
Bitcoin, Altcoins, and Stablecoins FAQs
Bitcoin is recognized as the leading cryptocurrency by market capitalization, serving as a virtual currency intended for financial transactions. It operates without the oversight of any singular person, group, or organization, ensuring that third-party involvement during transactions is not necessary.
Altcoins refer to any cryptocurrencies aside from Bitcoin. Some view Ethereum as an exception, as forking primarily occurs between these two cryptocurrencies. If this is accepted, then Litecoin is deemed the first altcoin, derived from the Bitcoin protocol and thus an “enhanced” version of it.
Stablecoins are designed to maintain a steady value, typically backed by reserves of the assets they represent. By pegging the value of a stablecoin to a commodity or financial asset like the US Dollar (USD), the supply can be regulated through algorithms or market demand. Stablecoins aim to provide an accessible entry and exit point for investors interested in cryptocurrency and to allow for value storage amidst the inherent volatility of the crypto market.
Bitcoin dominance refers to the proportion of Bitcoin’s market capitalization relative to the total market capitalization of all cryptocurrencies combined. It offers insight into Bitcoin’s appeal among investors. Typically, high BTC dominance is observed before and during a bullish market phase when investors prefer the stability and high market capitalization associated with Bitcoin. Conversely, a decrease in BTC dominance usually signals that investors are reallocating their funds to altcoins in search of greater returns, frequently resulting in significant altcoin rallies.