- Bitcoin is encountering resistance near its 200-day EMA at $85,500; a stable close above this level could indicate a possible recovery.
- US spot Bitcoin ETFs have experienced inflows for the second consecutive day this week.
- A recent report from K33 indicates that Bitcoin has been on a downward trend, with increasing correlations reflecting a broader risk-averse sentiment.
As of Wednesday, Bitcoin (BTC) is trading at approximately $83,300, having met resistance at its 200-day Exponential Moving Average (EMA) around $85,500 since last week. A breakout above this level might suggest a possible recovery. The US spot Bitcoin Exchange Traded Funds (ETFs) have registered inflows for the second day this week, pointing to a decrease in selling pressure. In addition, the K33 report shows a consistent downtrend in Bitcoin, with rising correlations indicating a wider risk-off attitude in the market.
Potential for Bitcoin Volatility Surrounding the FOMC Meeting
A recent report from K33 highlights a downward trend in Bitcoin, with increasing correlations reflecting a growing risk-averse sentiment. Traders are minimizing their exposure amid uncertainty, and the forthcoming Federal Open Market Committee (FOMC) meeting is not expected to significantly alter this trend as the market remains focused on fiscal policies and Scott Bessent’s 10-year yield strategy.
The analysis suggests that for Wednesday’s FOMC meeting, the market consensus is unchanged interest rates, despite easing inflation pressures and a slight uptick in the US unemployment rate. However, expectations of interest rate cuts in future FOMC meetings are rising, with market estimates indicating a 22% chance of a 25 basis point cut in May, increasing to 56.3% by June.
These probabilities indicate potential volatility as the market reacts to the dot plot and forward guidance from Federal Reserve Chair Jerome Powell during the FOMC press conference. While the FOMC often causes significant market fluctuations, recent US fiscal policies have been the primary drivers of market movements.
The report also notes that the back-and-forth over tariffs has caused considerable downside volatility, raising concerns over an economic slowdown. Reciprocal tariffs scheduled for April 2 are likely to create further volatility as countries respond to shifting trade policies. Fears of a slowing economy have contributed to a decrease in the 10-year Treasury yield, which has been a focal point for US Treasury Secretary Scott Bessent, who aims to lower the 6.7% US deficit to GDP.
Target rate probabilities for upcoming FOMC meetings chart.
“Current fiscal measures might hinder the economy in the short term, with Bessent viewing them as a detox from a market reliant on government spending. Amidst this detox, markets have declined. Whether or not reduced corporate taxes and deregulation will alleviate this process remains heavily debated, but for now, investors appear to be avoiding risk,” commented a K33 analyst.
In an exclusive discussion, Tracy Jin, COO of the crypto exchange MEXC, stated, “Bitcoin is anticipated to maintain a trading range between $81,000 and $86,000.”
Jin further mentioned that the new target for this week is set at $91,000 to $92,000. A failure to quickly breach $87,000 to $88,000 may create pressure on buyers, and surpassing this level will depend on future developments and market participant responses.
“Significant geopolitical events and decisions related to ongoing conflicts may have a stronger influence on Bitcoin’s price than US market developments. Recently, gold has reached an all-time high, reinforcing its role as a safe-haven asset. Consequently, any geopolitical upheaval could potentially drive Bitcoin’s price down into the range of $56,000 to $72,000,” Jin explained.
Signs of Modest Improvement in Bitcoin Institutional Demand
This week, there are slight indications of improved institutional interest in Bitcoin. Data from Coinglass reveals that the Bitcoin spot ETF registered a second consecutive day of net inflow, amounting to $209.10 million on Tuesday, following a net inflow of $156.50 million the previous day. Continued and increasing inflows could lead to further recovery for Bitcoin as sell-side pressure decreases.
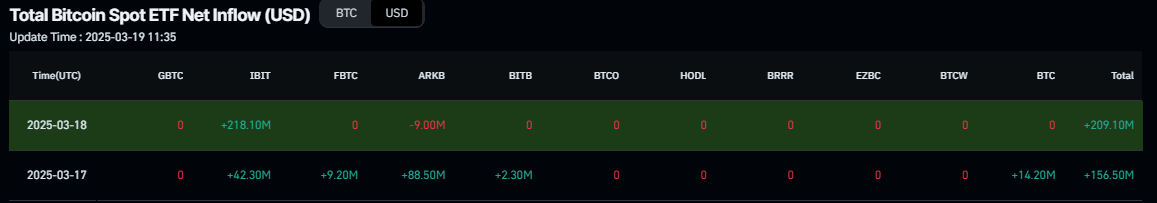
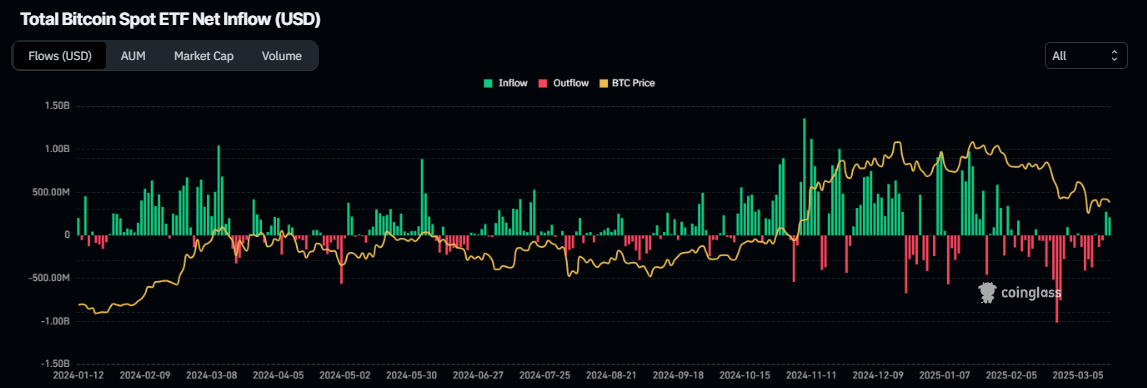
Total Bitcoin spot ETF net inflow chart.
Nevertheless, despite the modest increase in institutional demand, Ki Young Ju, founder of CryptoQuant, shared on social media that the “Bitcoin bull cycle has concluded, and we might expect 6–12 months of bearish or sideways price movement.”
Ju elaborates that all on-chain metrics indicate a bearish market, with fresh liquidity drying up and new whales offloading Bitcoin at lower prices.
Bitcoin Price Outlook: Potential Rally If It Surpasses the 200-Day EMA
Bitcoin’s price has been resisted at the 200-day Exponential Moving Average (EMA) positioned at $85,502 since Friday and is currently trading below this mark. This resistance coincides with the daily resistance level of $85,000, making it a crucial zone. As of Wednesday, BTC trades around $83,300.
The Relative Strength Index (RSI) indicates a lack of momentum on the daily chart, remaining below its neutral value of 50. However, the lower low formed by Bitcoin’s price on March 11 does not correspond with the higher high shown by the RSI during the same timeframe. This scenario is often identified as a bullish divergence, which can indicate a potential trend reversal or short-term rally.
If this bullish divergence plays out and BTC manages to close above its 200-day EMA at $85,502, a recovery extension towards $90,000 may follow.
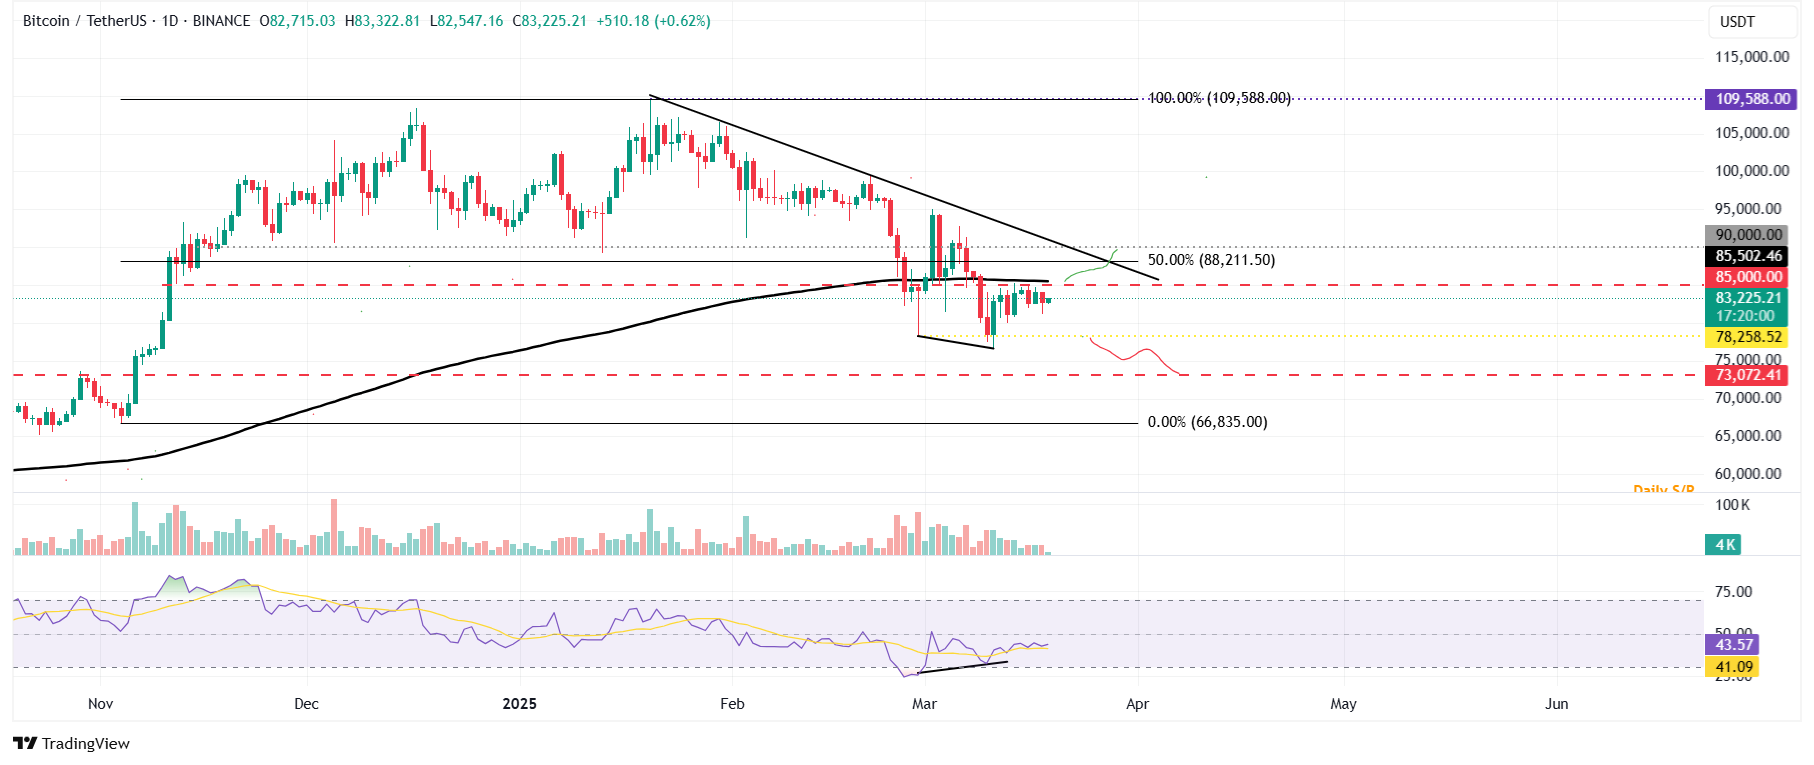
BTC/USDT daily chart
Conversely, if BTC retraces and closes below $78,258 (the low from February 28), it may trigger a further decline towards its next support level at $73,072.
Bitcoin, Altcoins, Stablecoins FAQs
Bitcoin is the leading cryptocurrency by market capitalization, functioning as a digital currency intended for transactions. It is decentralized, meaning it is not controlled by any single individual, group, or organization, thereby eliminating the need for intermediaries in financial transactions.
Altcoins refer to any cryptocurrency apart from Bitcoin. Some consider Ethereum as a non-altcoin because forking primarily occurs from these two. If this is the case, then Litecoin, which was forked from the Bitcoin protocol, is the first altcoin and regarded as an “improved” version of Bitcoin.
Stablecoins are cryptocurrencies aimed at maintaining a stable value, with their worth secured by reserves of the asset they represent. To achieve this stability, a stablecoin’s value is pegged to a commodity or financial instrument, such as the US Dollar (USD), with its supply managed through an algorithm or market demand. The primary purpose of stablecoins is to offer an on/off-ramp for investors interested in trading and investing in cryptocurrencies, as well as to provide a means for storing value given the general volatility of cryptocurrencies.
Bitcoin dominance refers to the percentage of Bitcoin’s market cap relative to the total market capitalization of all cryptocurrencies. This metric helps illustrate Bitcoin’s popularity among investors. Typically, a high Bitcoin dominance occurs before and during a bullish market phase, where investors favor Bitcoin as a relatively stable investment. A decline in Bitcoin dominance often signifies that investors are reallocating funds to altcoins in search of greater returns, which can trigger surges in altcoin prices.