- The price of Bitcoin climbed by 4% to reach a 10-day high of $85,900 on Wednesday, aligning with the market’s expectations following the Federal Reserve’s decision to pause interest rates.
- Analysis from IntoTheBlock indicates a significant increase of $13 billion in large BTC transactions since the beginning of the week.
- Bitcoin ETFs experienced inflows exceeding $500 million in the three days leading up to the Federal Reserve’s meeting.
Bitcoin’s price jumped 4% to a ten-day peak of $85,900, driven by institutional interest and substantial inflows into Bitcoin ETFs surpassing $500 million before the Fed’s decision. What could be the next step for BTC?
Bitcoin (BTC) reaches a 10-day high following the Federal Reserve meeting
Bitcoin (BTC) broke through significant support levels after the US Federal Reserve announced a rate pause, which was in line with market predictions. Following signals of lower-than-expected inflation from the CPI and PPI data earlier in the month, market participants anticipated a high probability of this rate pause.
Bitcoin price movement | BTCUSDT
On Wednesday, Bitcoin surged by 4%, reaching a 10-day high of $85,900. This movement was influenced by macroeconomic conditions and positive sentiment surrounding the SEC’s decision to drop charges against Ripple, which both acted as catalysts for a broader market rally.
Bitcoin ETFs attract $500M in inflows as large transactions surge by $13B
Although Bitcoin only saw a 4% increase on Wednesday, other critical indicators suggest rising whale accumulation leading up to the Fed’s rate decision. After a three-week period of selling, Bitcoin ETFs reversed this trend this week, registering $512 million in total inflows across the last three trading days according to data from SosoValue.
On Wednesday alone, Bitcoin ETFs garnered $209 million in net inflows, following $32 million and $274 million earlier in the week. Remarkably, this is the first time since January 31 that Bitcoin ETFs have experienced positive net flows over three consecutive days.
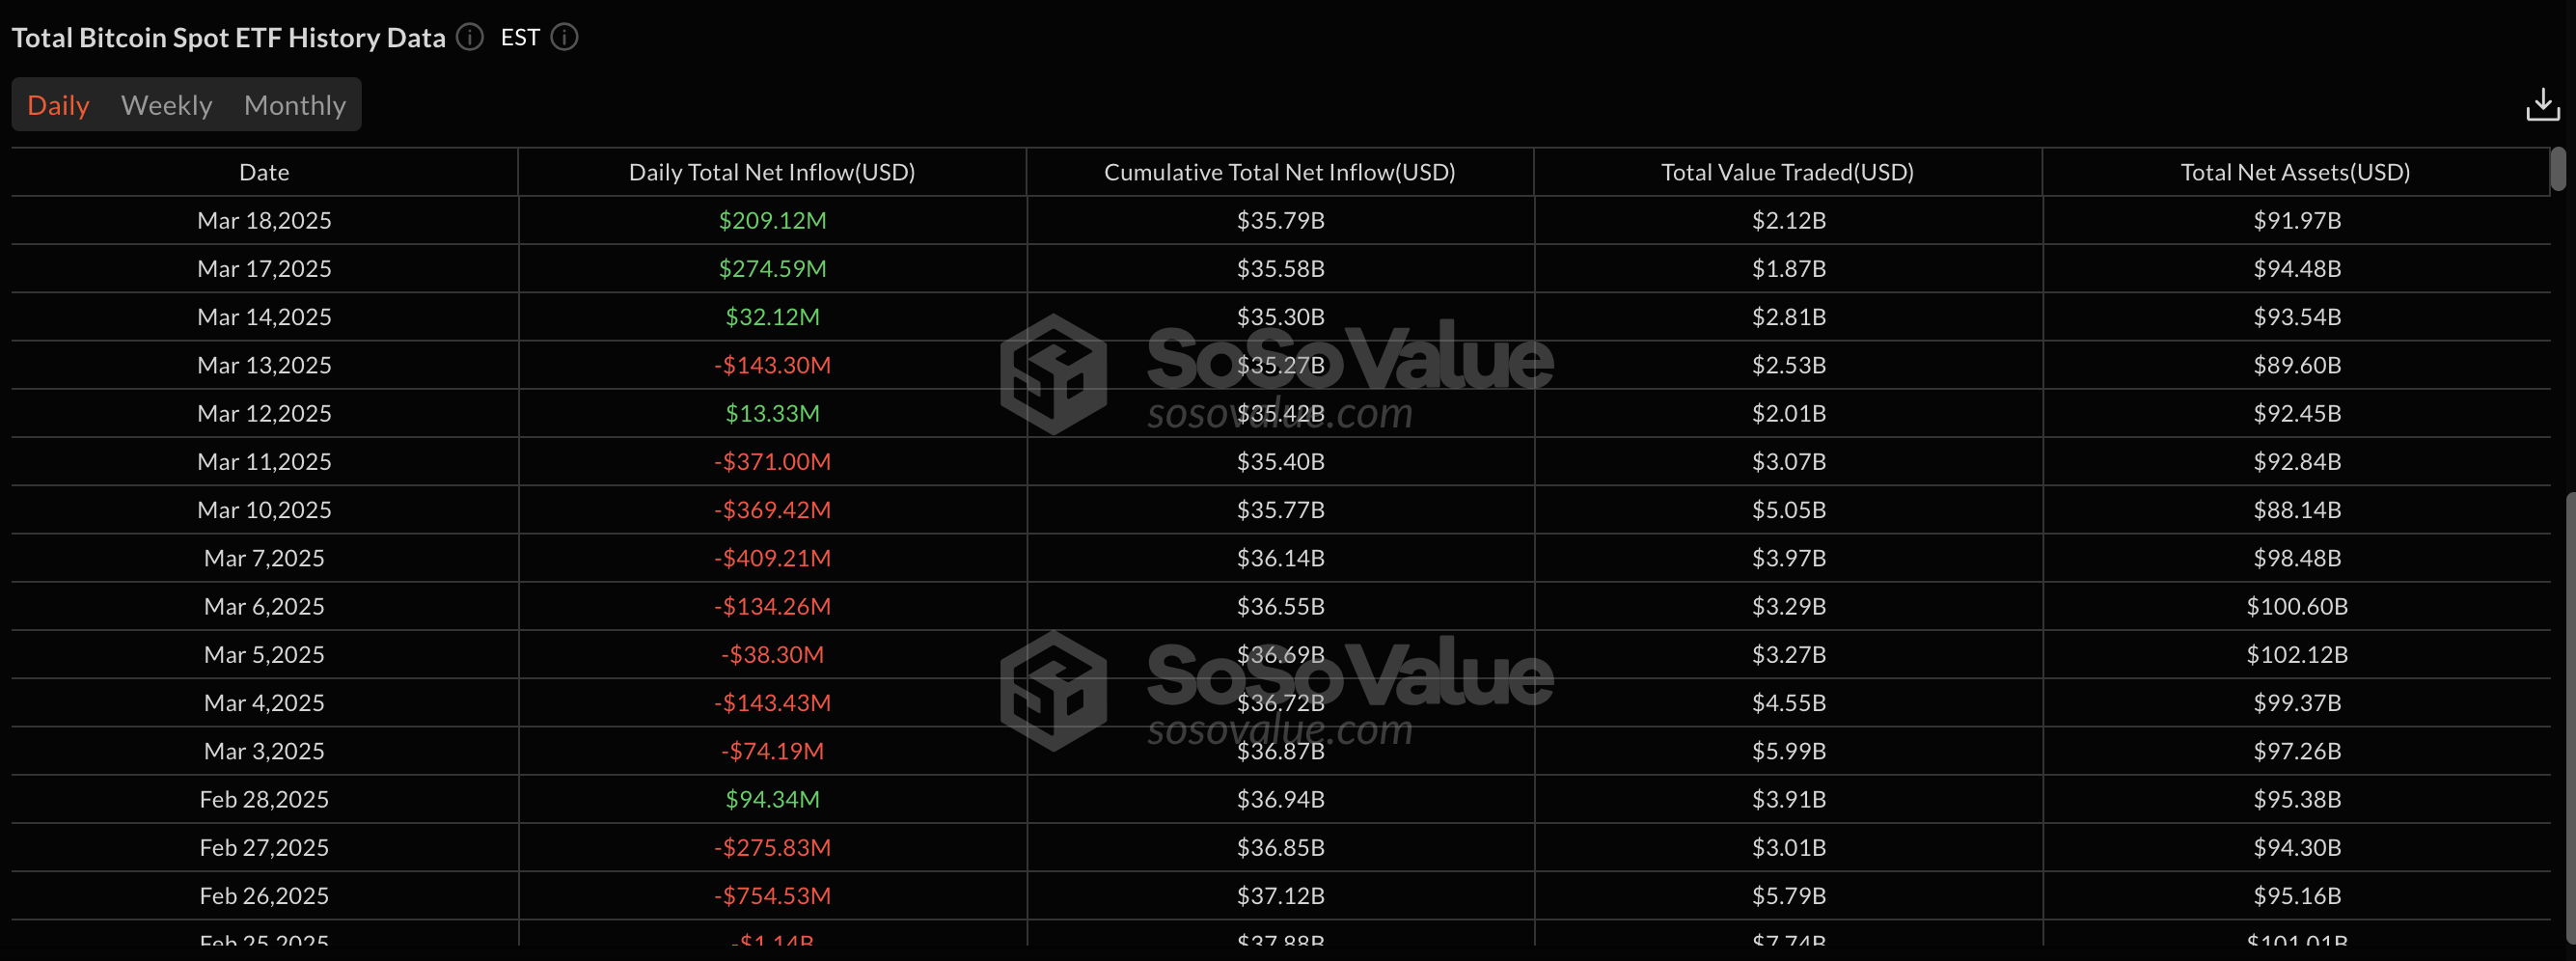
Bitcoin ETF Flows | SosoValue
Moreover, on-chain data from IntoTheBlock confirms that Bitcoin whales significantly increased buying pressure in the days leading up to the Fed’s rate announcement.
The BTC Large Transactions chart tracks the total value of Bitcoin transactions exceeding $100,000 within a single day, providing real-time insights into the capital used by whale traders and major corporate investors in response to key market events.
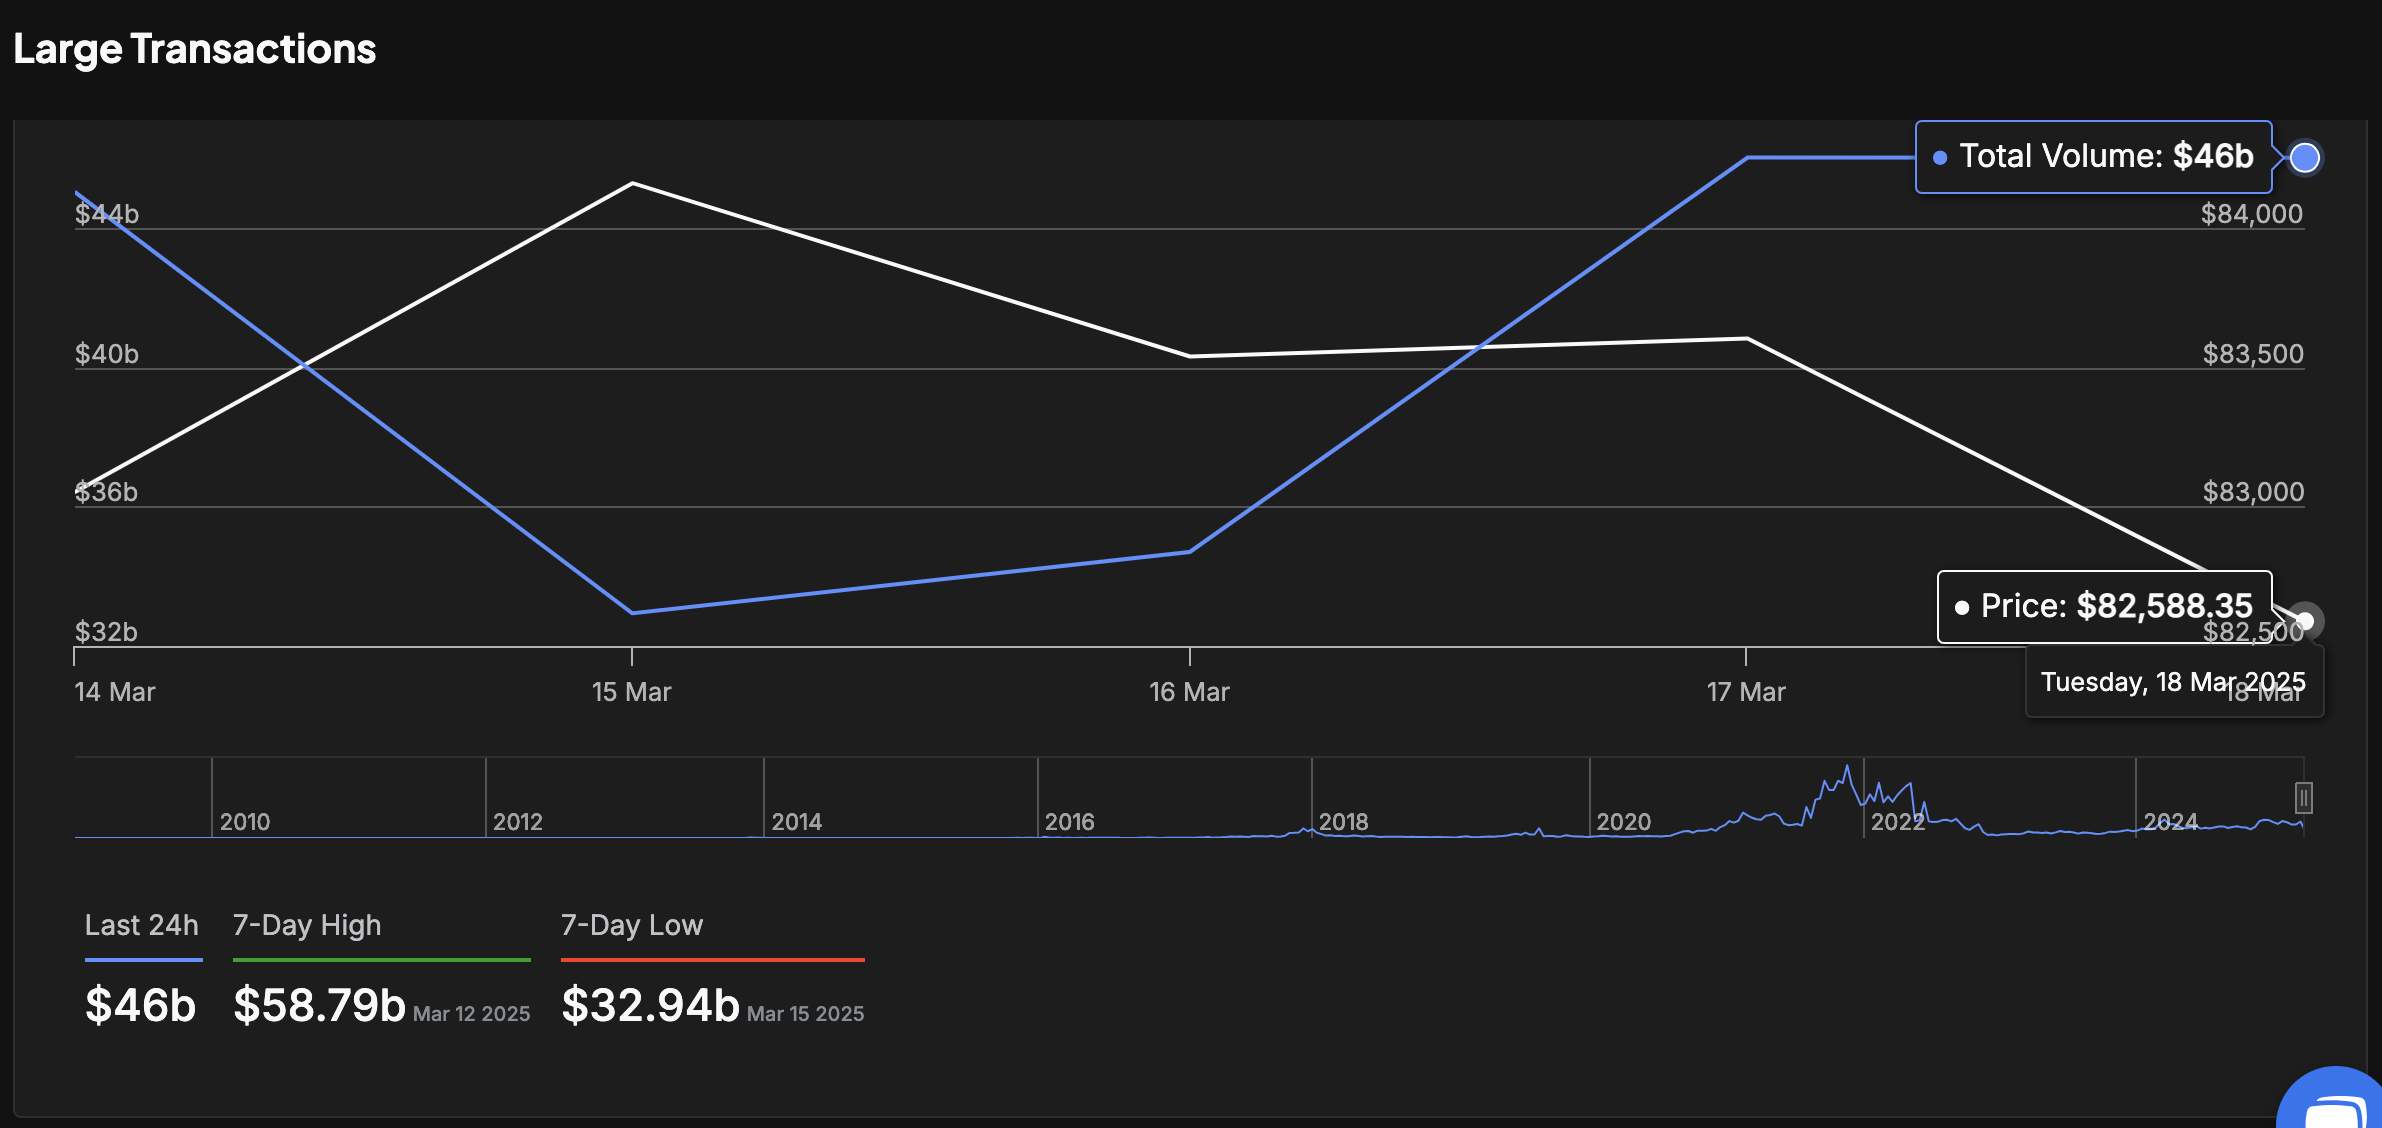
Bitcoin Whale Transaction volumes rise $13 billion ahead of US Fed Meeting
As noted, Bitcoin recorded $32 billion in large transactions at the start of the week on March 15.
Since then, BTC large transactions have surged by 40% to reach $42.9 billion as of Wednesday.
This indicates an increase in demand from BTC whales of $13 billion ahead of the Federal Reserve’s rate decision.
Bitcoin price prediction: Potential pullback to $80K from sell-the-news strategies
Bitcoin’s 4% climb on Wednesday was accompanied by strong whale activity.
However, large purchases by whales leading up to significant market events often heighten the risk of a sell-the-news scenario. If these large investors decide to take strategic profits, Bitcoin may face a sharp correction in the subsequent trading sessions.
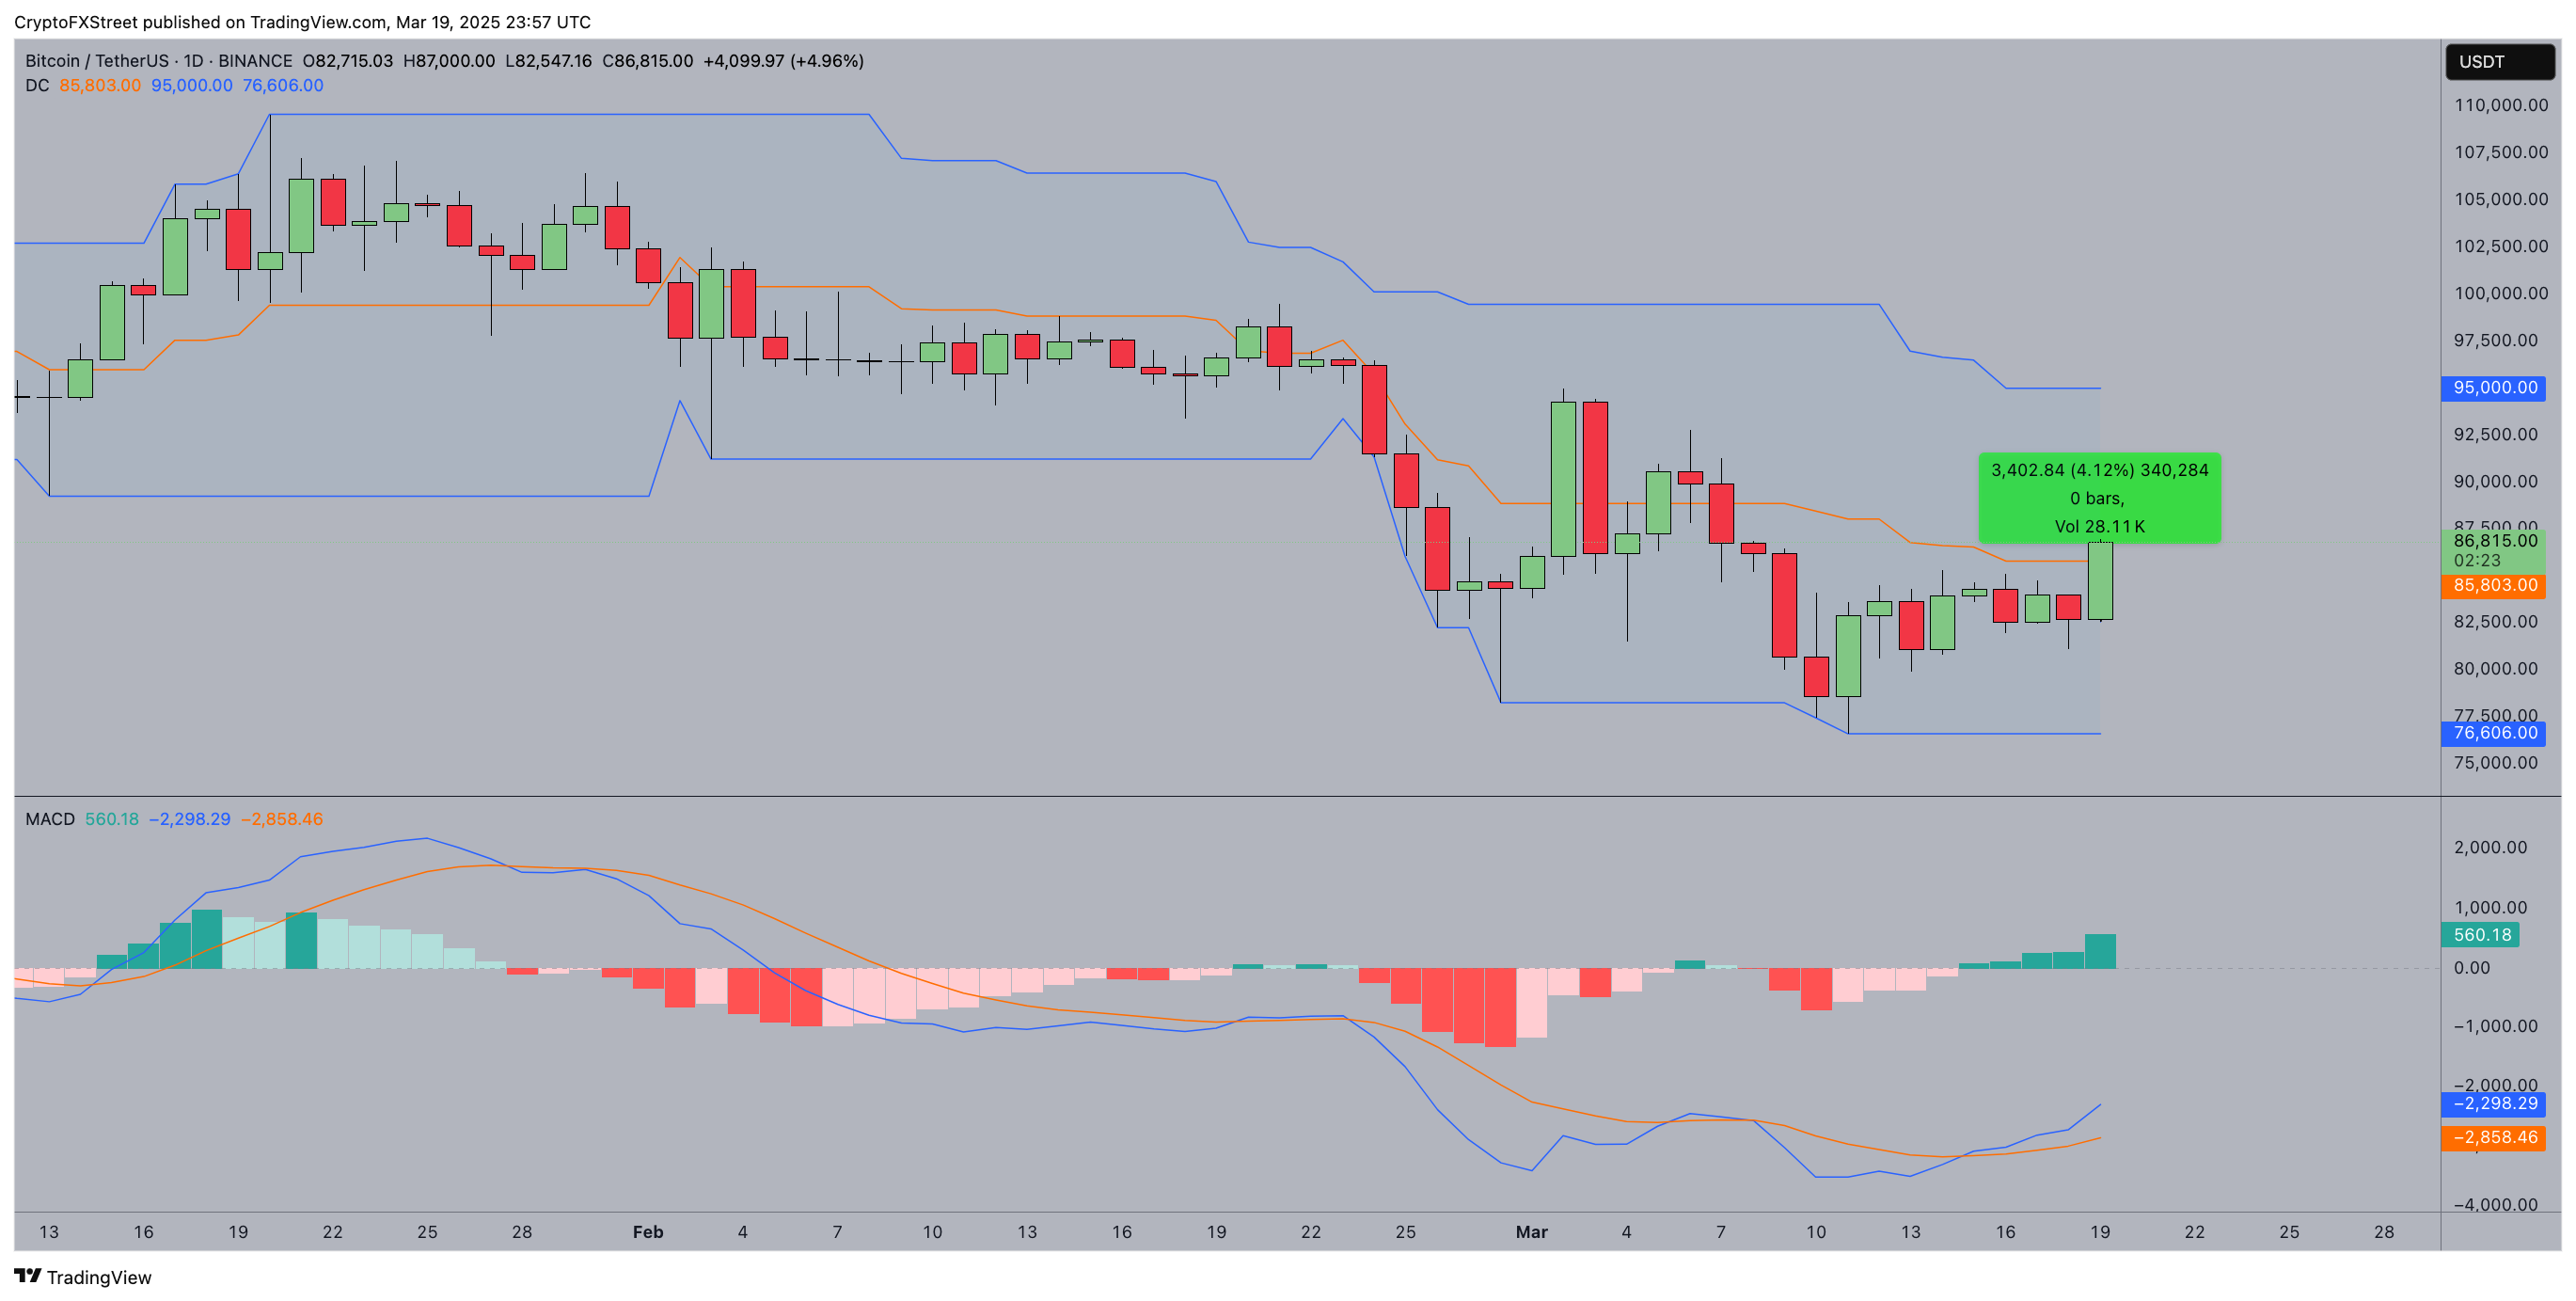
Bitcoin price forecast | BTC
Nonetheless, Bitcoin’s short-term momentum remains predominantly positive, as shown by the Moving Average Convergence Divergence (MACD) indicator in the chart above.
The MACD histogram has turned green, confirming a shift in momentum to the upside, while the MACD line is nearing a bullish crossover above the signal line.
This pattern typically indicates the possibility of extended gains if buying pressure remains steady.
Additionally, BTC’s price has broken above the middle band of the Donchian Channel at $85,803, indicating bullish dominance as it targets the upper band resistance near $96,000.
Conversely, failing to surpass the $90,000 psychological resistance could lead to profit-taking from whales and short sellers, spurring a retracement.
The MACD’s negative values suggest lingering bearish pressure, while the lower boundary of the Donchian Channel at $76,606 serves as a critical downside target.