The price of Ethereum has plummeted by more than 52% from its peak in December, and both technical analysis and on-chain indicators suggest further declines may be on the horizon.
Ethereum (ETH) reached a high of $4,105 in December but was priced at $1,970 as of March 20. This significant drop marks it as one of the weakest blue-chip cryptocurrencies currently available.
The decline in Ether’s value is fueled by ongoing concerns regarding its future. Recently, analysts from Standard Chartered revised their price prediction downward by 60%, lowering it from $10,000 to $4,000. They attribute this adjustment to the increasing competition from layer-1 and layer-2 networks that have impacted its revenue generation.
Layer-2 solutions on Ethereum, such as Coinbase’s Base, Arbitrum, and Optimism, have attracted a larger user base due to their more affordable fees. For instance, recent data indicates that decentralized exchanges (DEX) operating on Ethereum facilitated over $9.8 billion in trading volume over the past week.
Arbitrum alone accounted for $2.87 billion, while Base recorded $2.8 billion. Previously, this trading volume would have predominantly occurred on Ethereum’s mainnet.
Moreover, Ethereum faces stiff competition from layer-1 chains like Solana (SOL) and BNB Chain. DEX platforms on the BNB Smart Chain processed over $13 billion in trading volume during the last seven days.
Additionally, Ethereum is unlikely to benefit significantly from developing technologies such as Real World Asset tokenization due to its higher transaction costs and slower processing speeds. Instead, developers may prefer to utilize more scalable and cost-effective networks like Mantra (OM) and BNB Chain.
Ethereum presents weak on-chain indicators
Recent statistics reveal a decline in the number of unique active addresses on Ethereum over the past several months. Analytics illustrate that there were 461,000 active addresses on Wednesday, a decrease from 717,000 earlier this year.
Another crucial metric, Ethereum’s realized cap HODL wave, has dropped to its lowest level since August of last year, indicating that long-term holders are starting to sell off their holdings.
The 365-day mean dollar invested age (MDIA), which measures the time each coin remains in an address and the total funds used to acquire it, has also fallen to its lowest point since September.
Technical analysis of Ethereum’s price
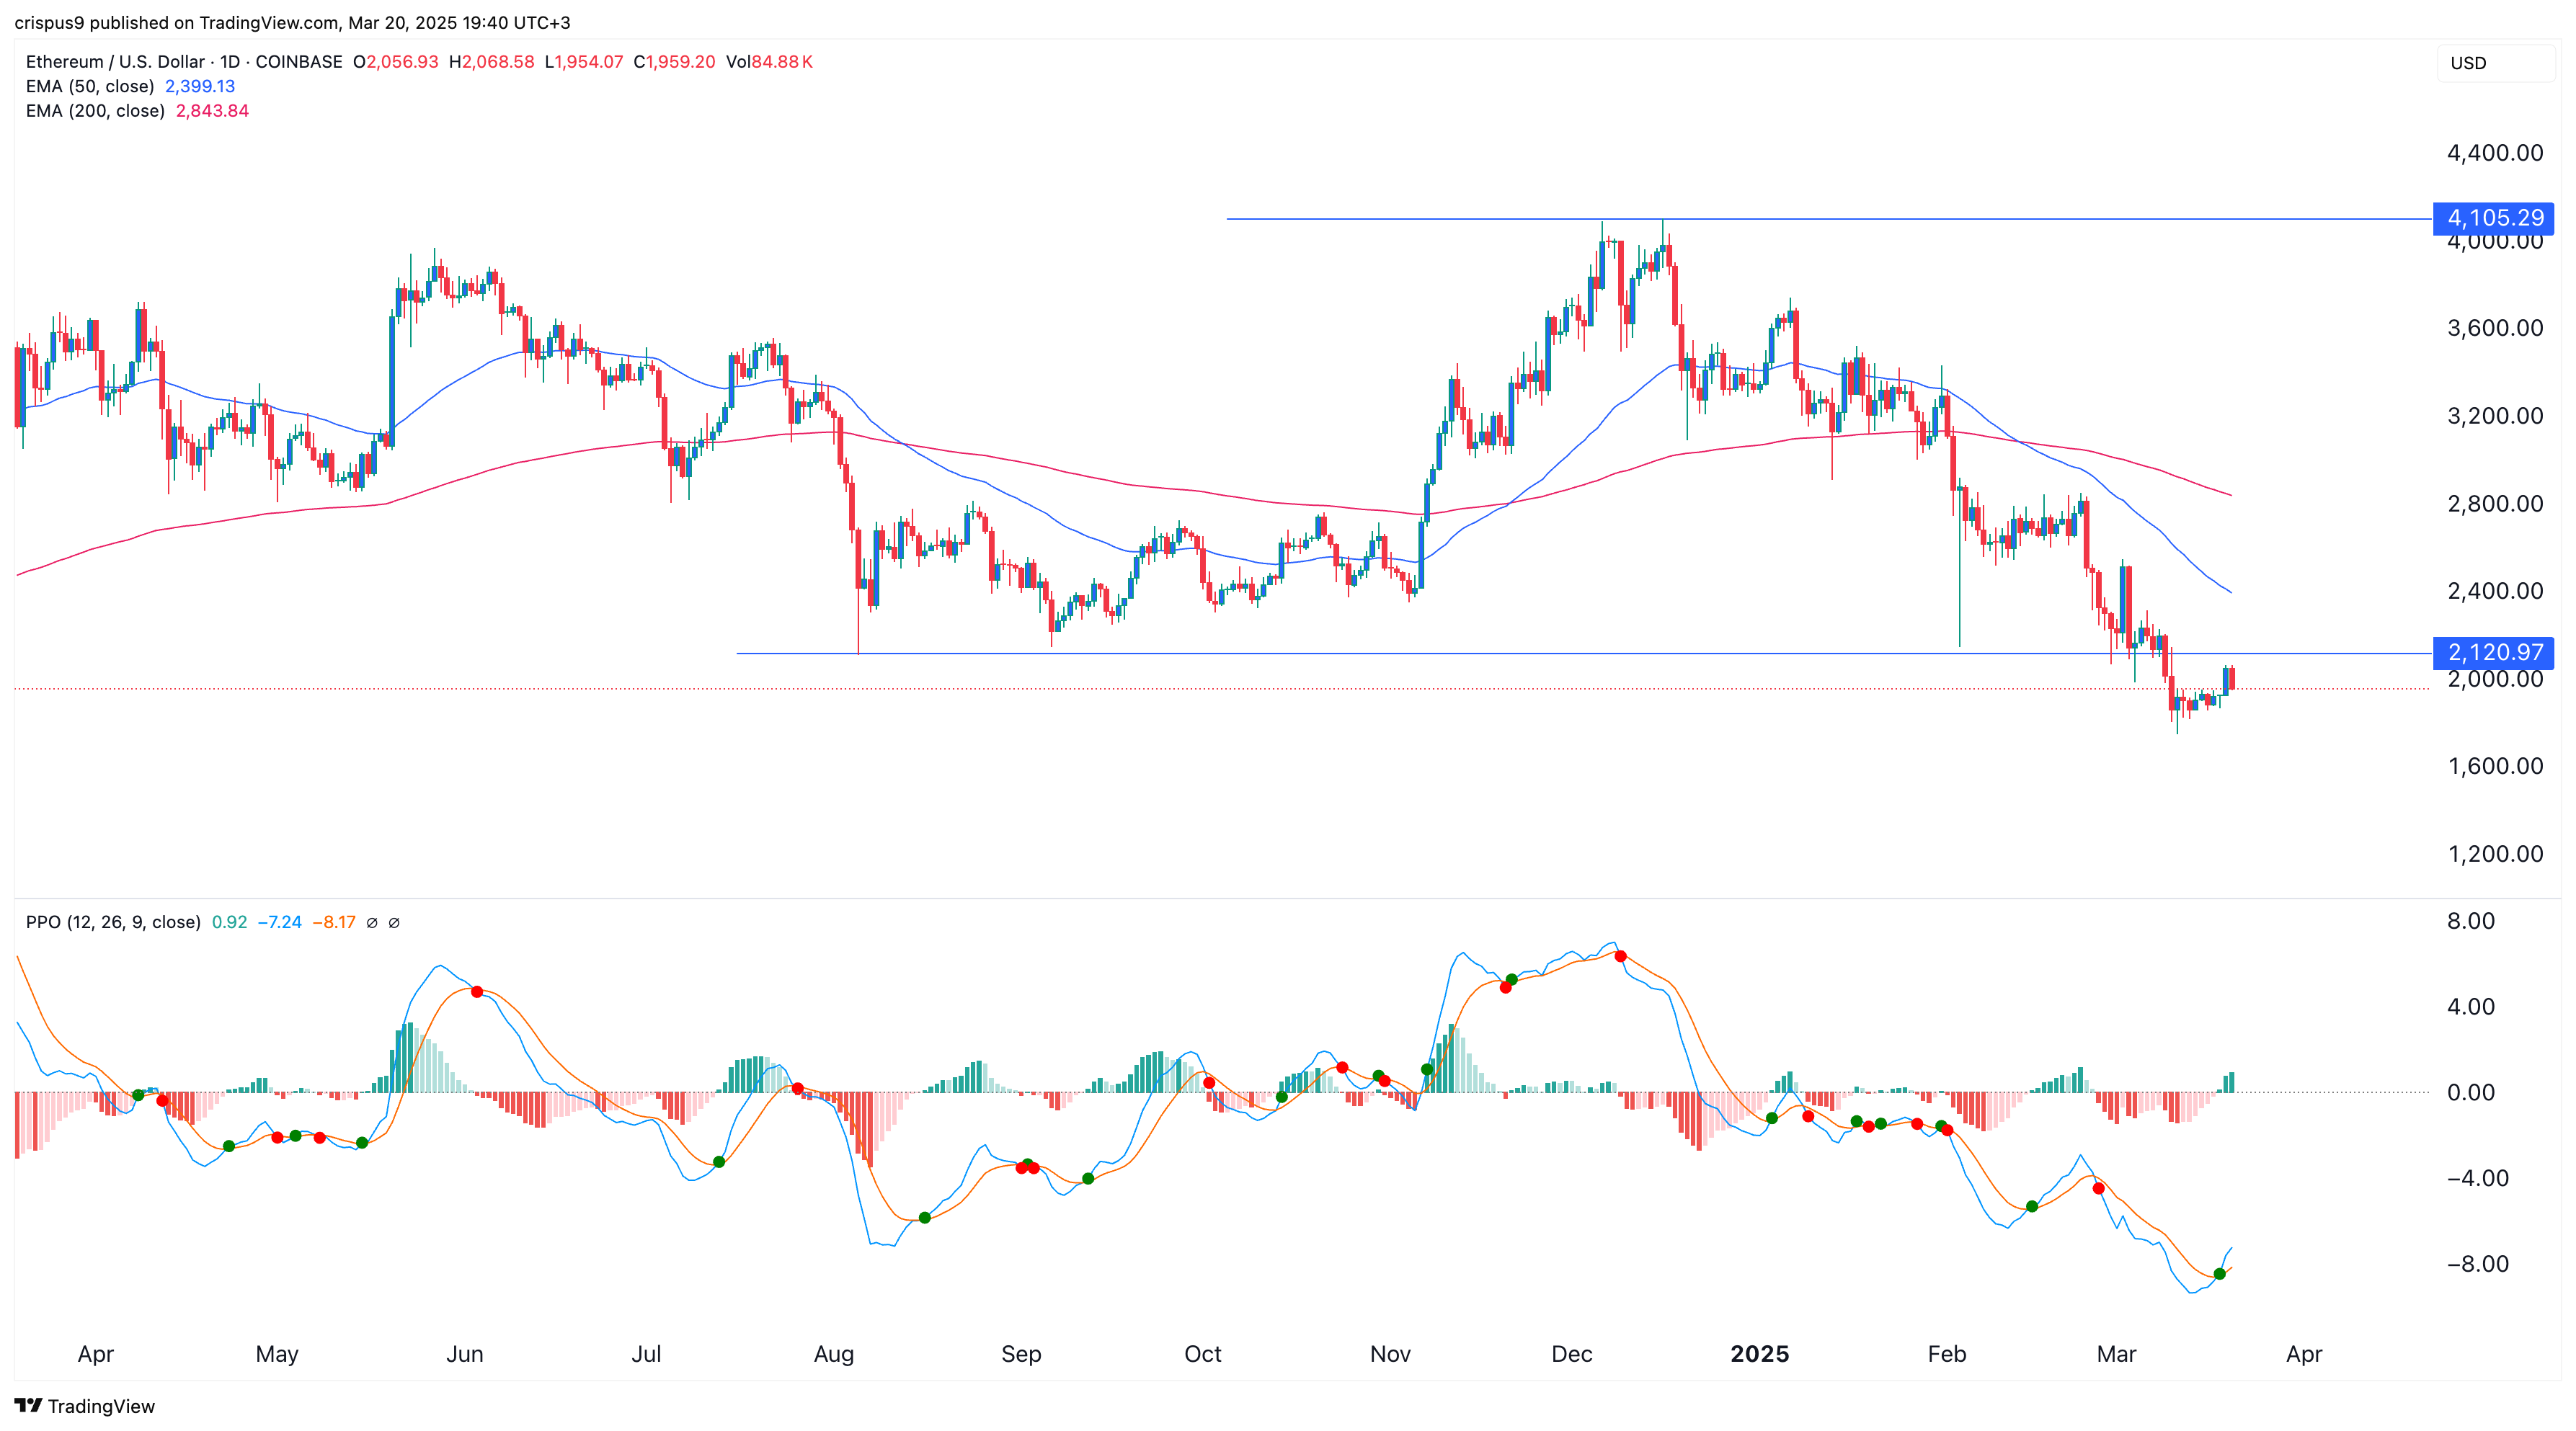
The daily chart illustrates that the ETH price has been on a pronounced downward trajectory over recent months. This downturn began after the formation of a triple-top pattern at $4,000, with the supportive neckline positioned at $2,120.
Following this, the coin exhibited a death cross pattern as the 50-day and 200-day moving averages intersected. This pattern typically signals increased downward momentum. Additionally, various well-known indicators such as the Relative Strength Index and Percentage Price Oscillator have also shown declines.
Consequently, it is likely that the price will continue to fall, with sellers targeting the psychological threshold of $1,500, representing a drop of approximately 25% from its current value.