Notable cryptocurrencies such as Bitcoin, Ethereum, and Ripple are exhibiting various risky trends as the market braces for the much-anticipated triple-witching event.
The price of Bitcoin (BTC) has decreased to $83,580 from a weekly peak of $87,158, while Ethereum (ETH) has dipped below the $2,000 mark. Ripple (XRP) has also retreated from this week’s high of $2.59 to $2.35.
This price movement may be attributed to traders anticipating the quarterly triple-witching event on Wall Street, which occurs on the third Friday of March, June, September, and December. This day is notable for the simultaneous expiration of stock options, stock index futures, and index options.
The forthcoming triple-witching event will see options and futures contracts valued over $4.5 trillion expire. Historically, both stocks and cryptocurrencies have experienced increased volatility before, during, and after such events.
For instance, during the last triple-witching event on December 20, Bitcoin opened at $97,777, dropped to $92,200, and closed the day at $97,000.
This quarter’s upcoming triple witching event comes amidst ongoing concerns regarding Donald Trump’s tariffs and follows a muted interest rate decision from the Federal Reserve. While officials have cautioned about the possibility of stagflation, Jerome Powell indicated that inflationary pressures might be temporary. The Fed has also suggested a potential reduction in its quantitative tightening measures in the near future.
Bitcoin forms a rising wedge
There is a concern that Bitcoin’s price could decline ahead of or following the triple-witching event. It has established a rising wedge pattern that consists of two converging and ascending trendlines. This pattern emerges atop a double-top at $108,150 and a death cross witnessed on March 14. These indicators suggest potential further declines for Bitcoin, with an immediate target of $76,890, representing its March low.
Ethereum features a triple-top formation
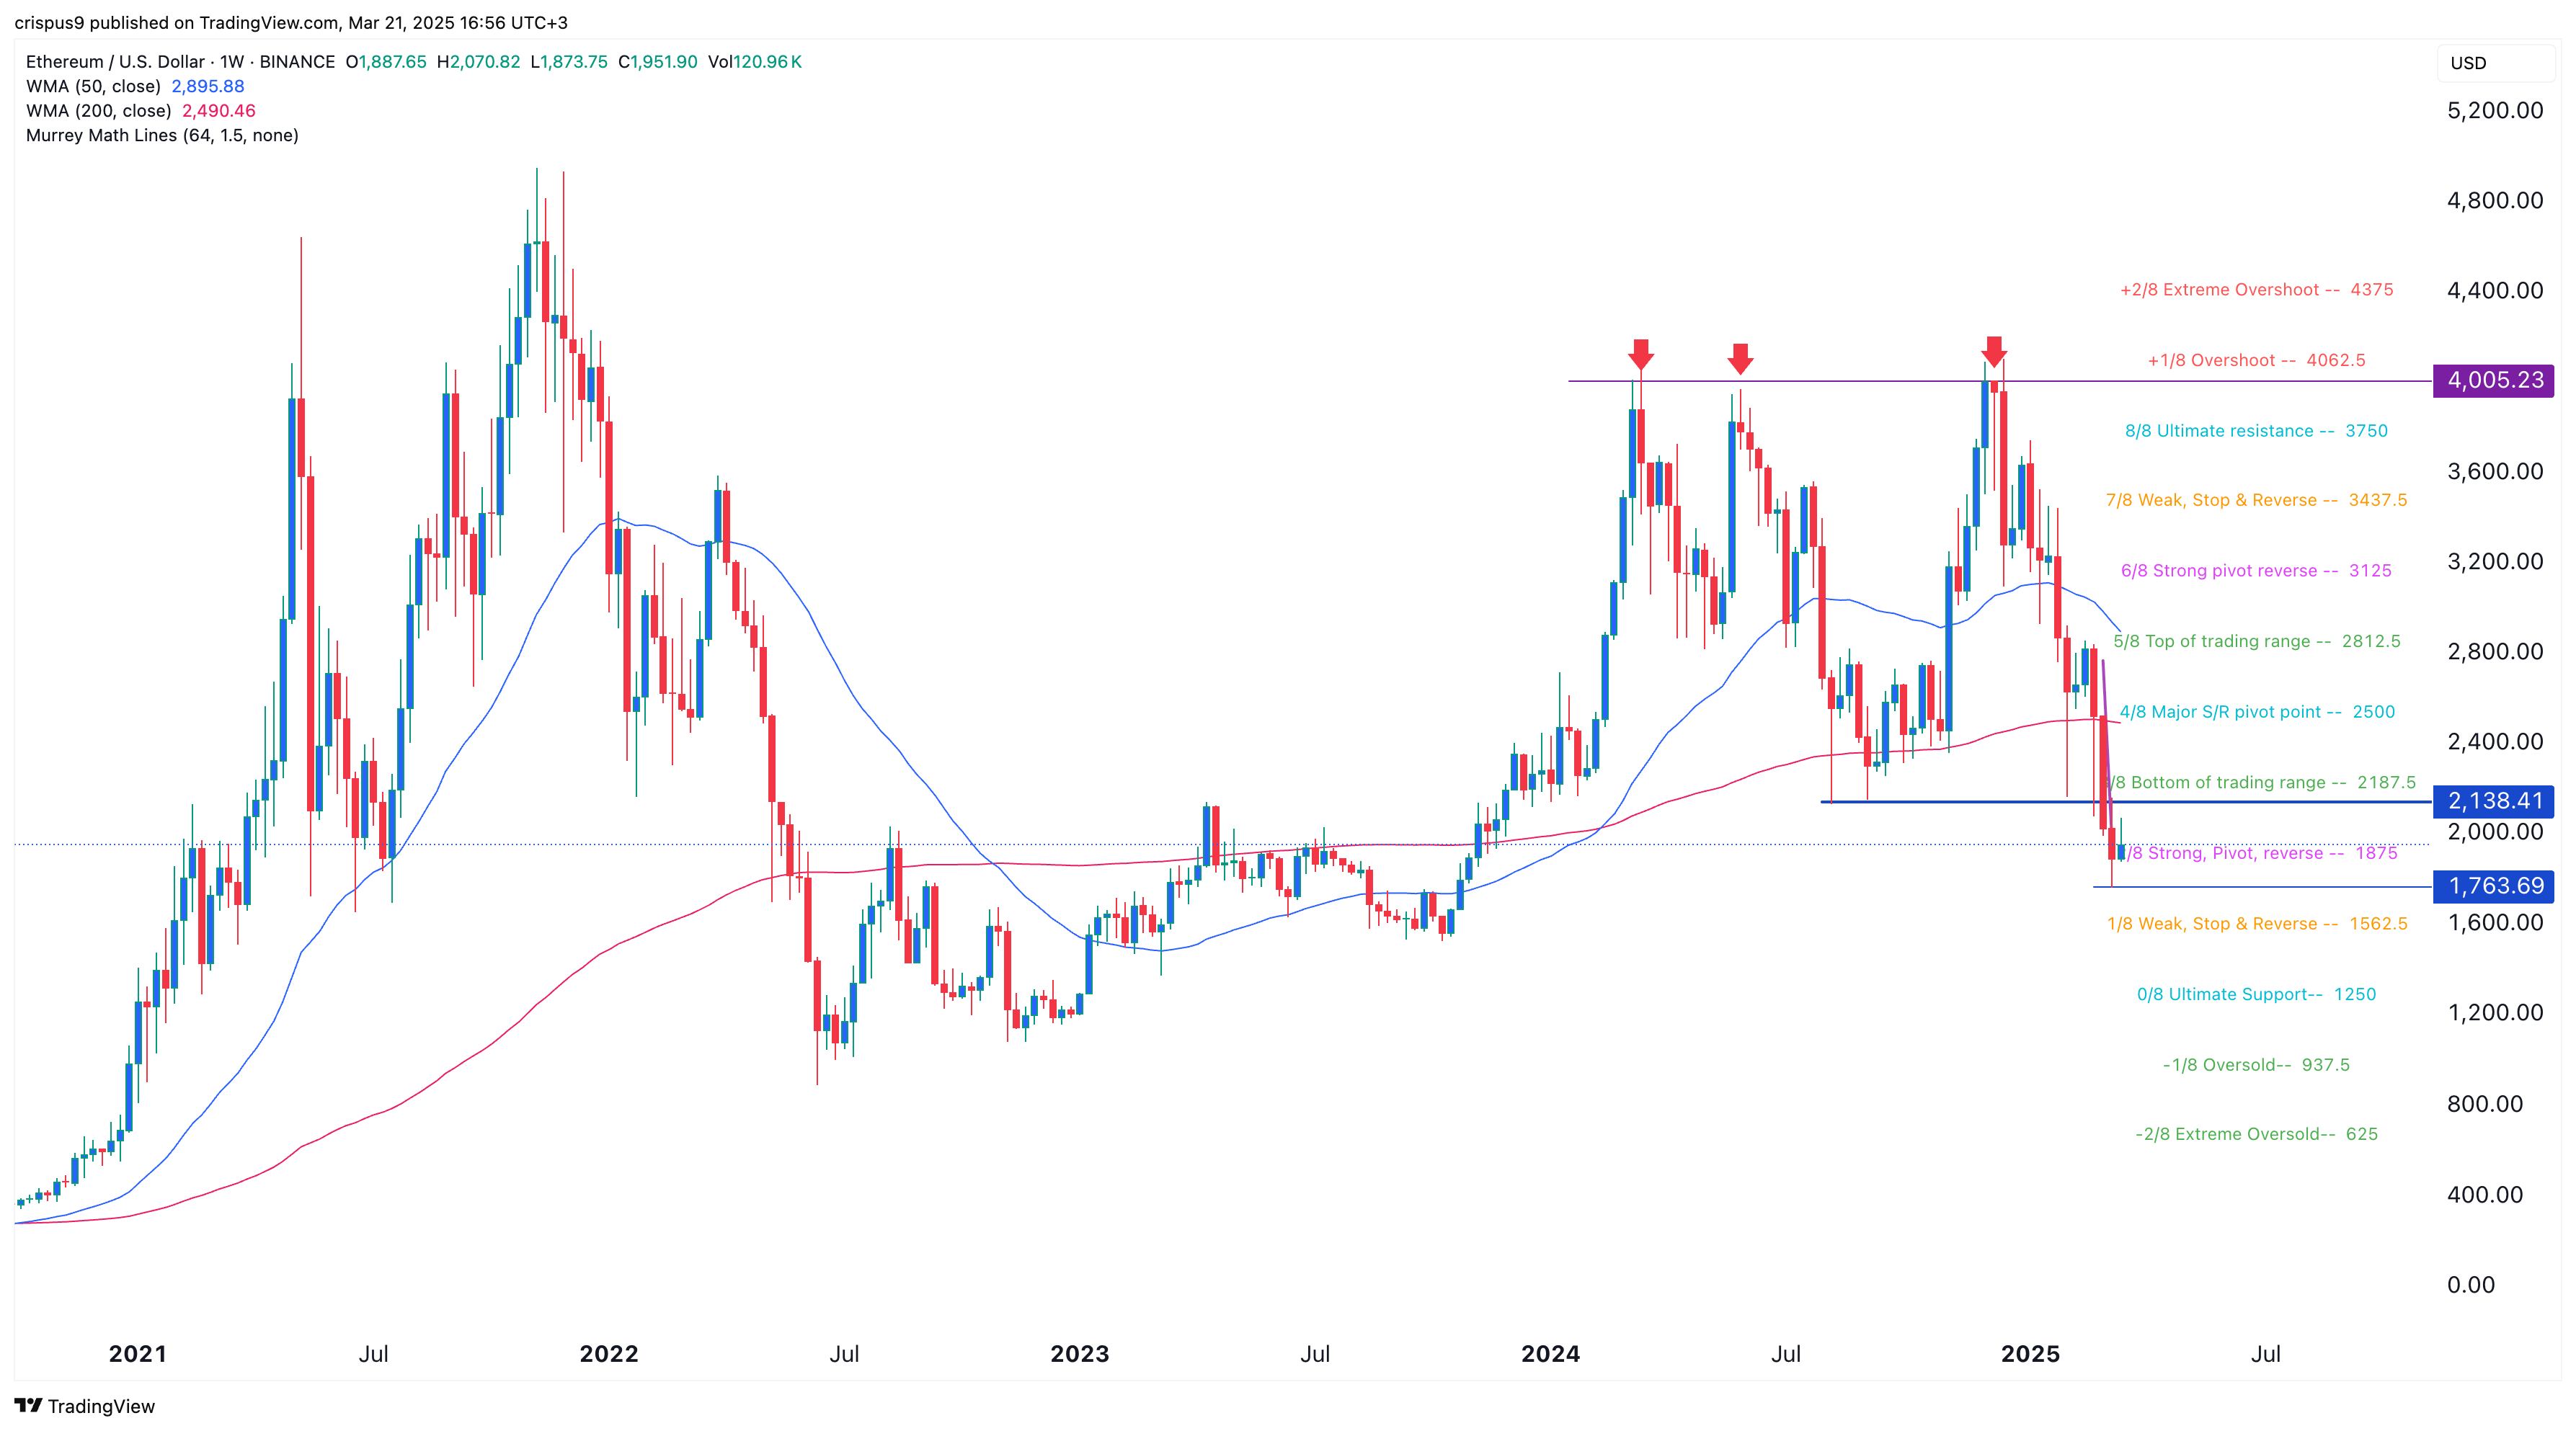
Ethereum has developed a triple-top pattern at the $4,005 level, with a neckline positioned at $2,140. Such a formation often precedes a substantial bearish breakout, and in this case, it has fallen below the neckline. Furthermore, it has dipped below both the 50-week and 200-week moving averages, indicating potential further declines, possibly down to the psychological barrier at $1,500.
XRP displays a head and shoulders pattern
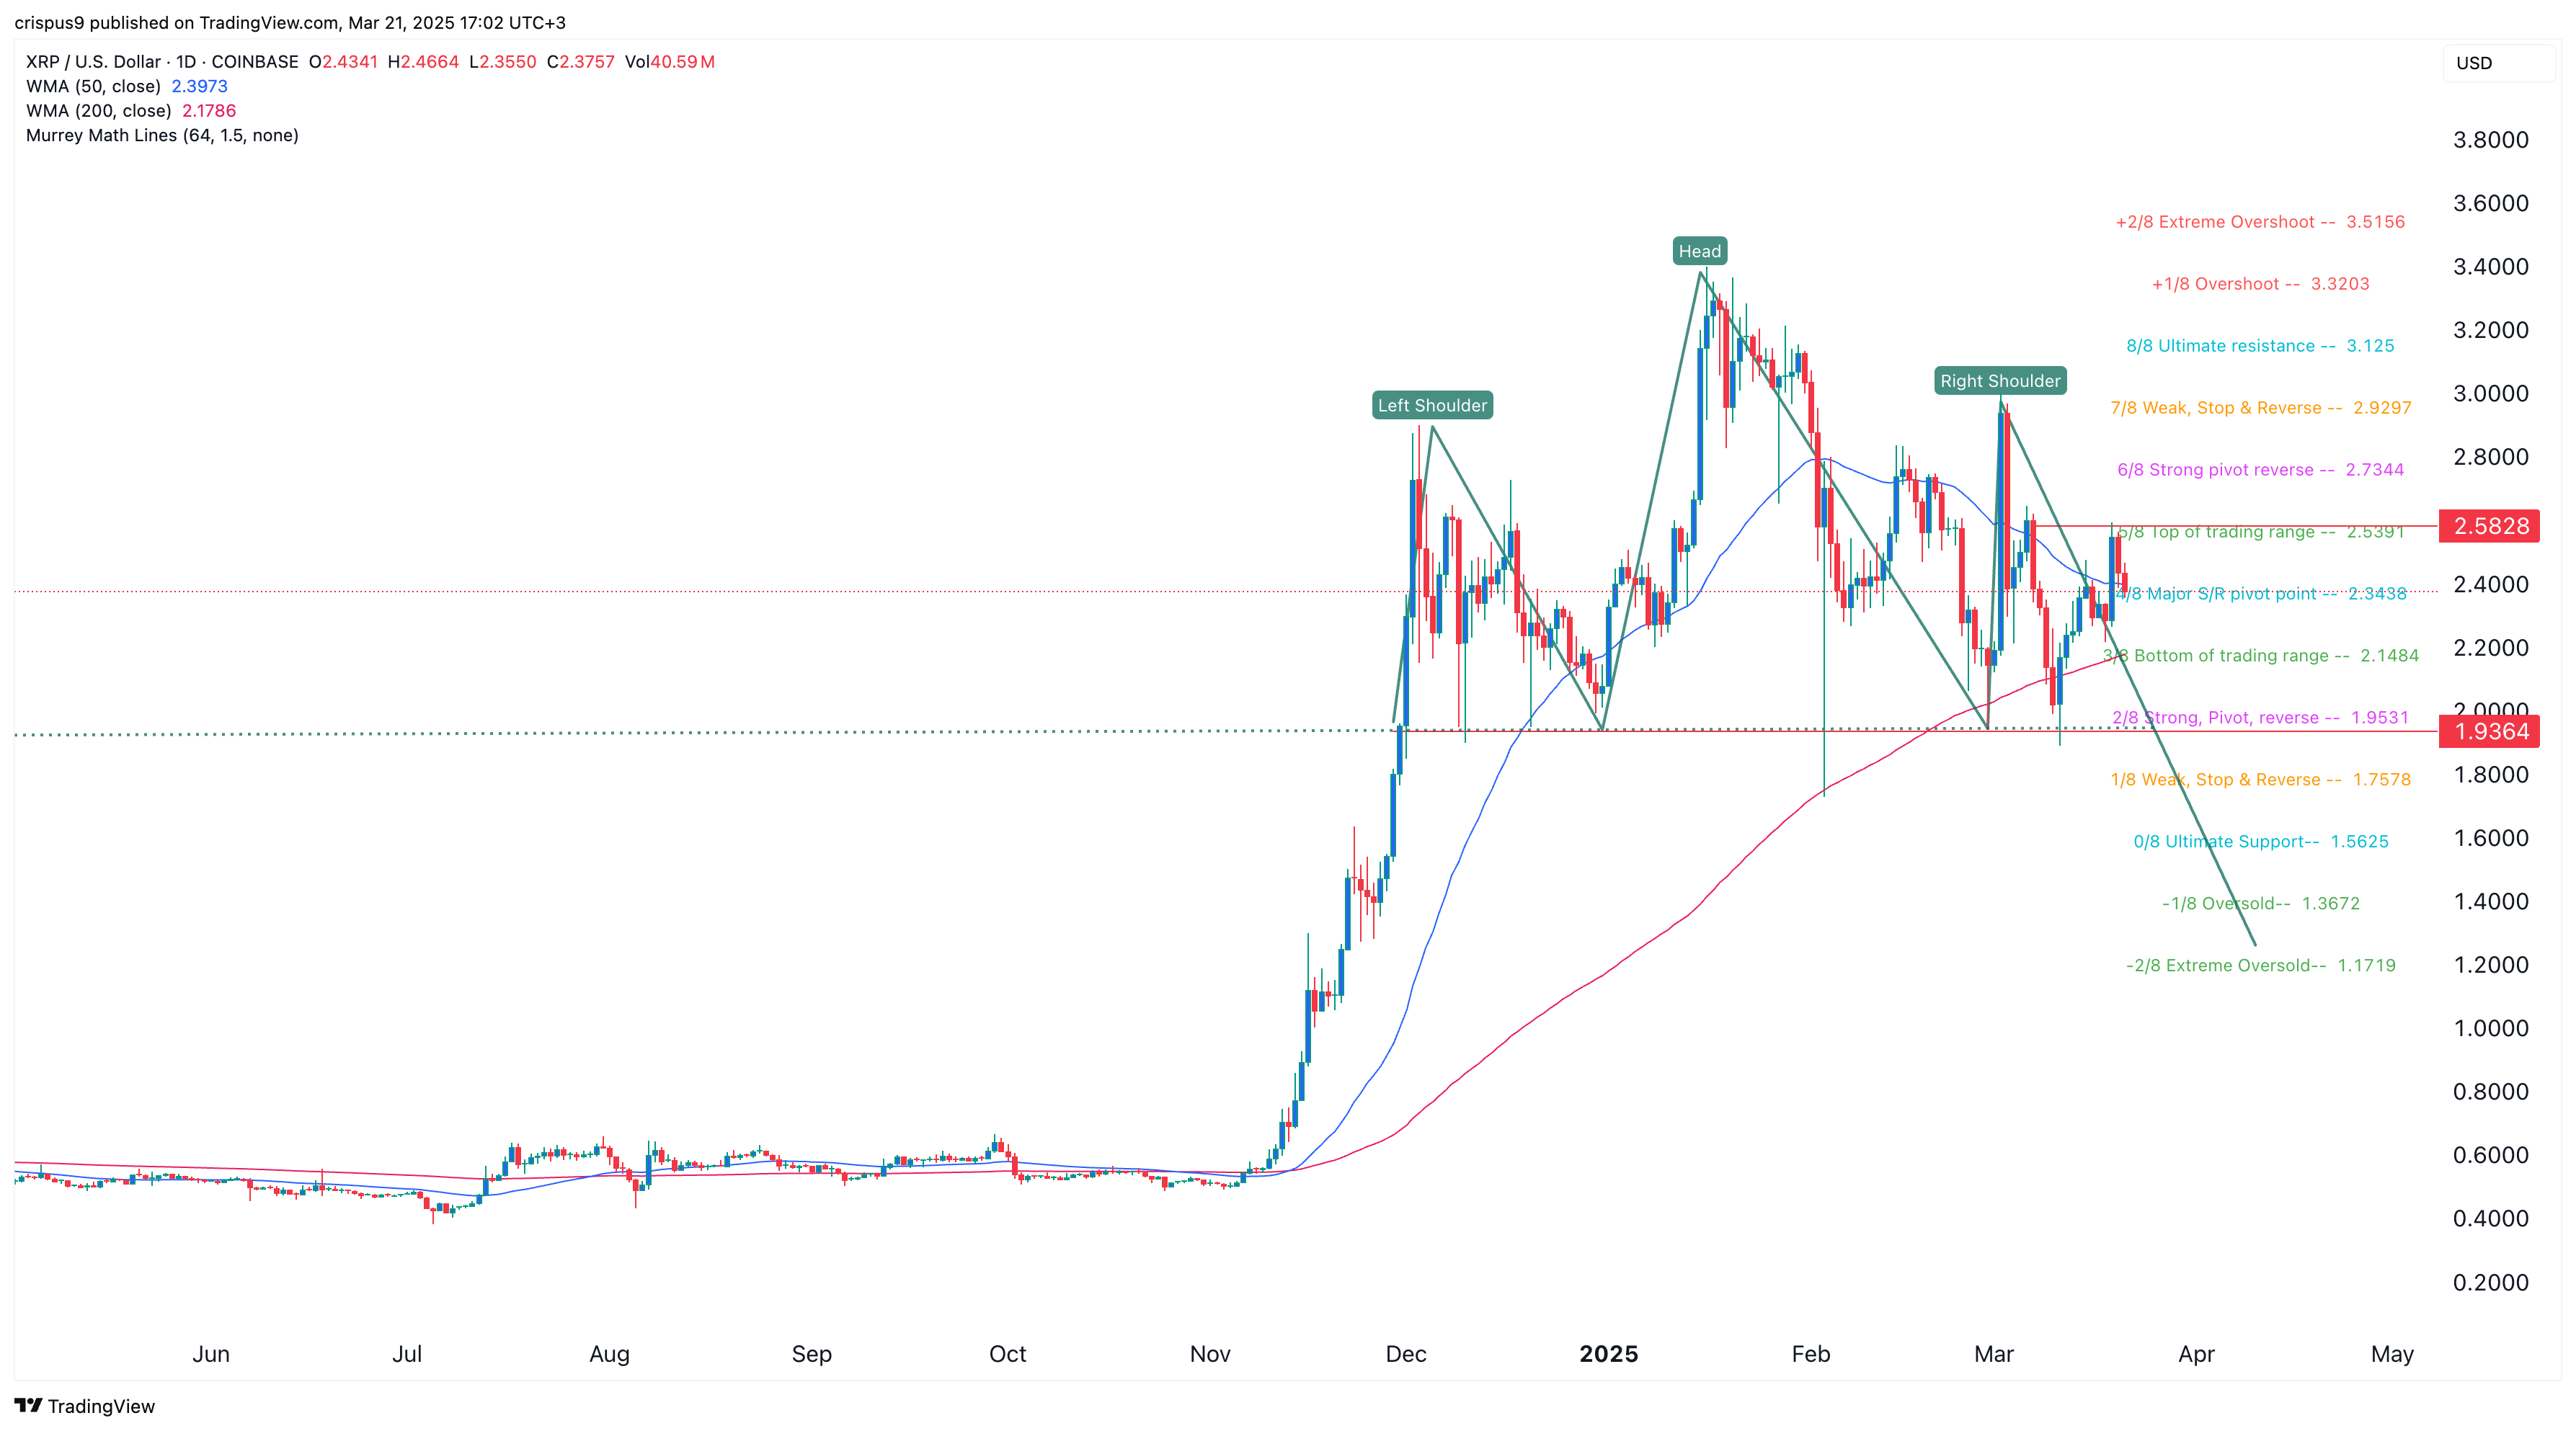
In a similar vein, XRP’s price is at risk of experiencing a downturn even after the resolution of the SEC case against Ripple. This is primarily due to the formation of a head and shoulders pattern, with its neckline situated at $1.93 and shoulders at $3. The cryptocurrency failed to invalidate this pattern by breaking above the shoulders this week, thus a movement below the neckline at $2 could lead it to drop to $1.