Cardano’s price is gradually developing a well-known bullish pattern, indicating a potential significant bullish breakout in the coming weeks or months.
Cardano (ADA), a widely recognized proof-of-stake cryptocurrency, continues to experience a bear market, having fallen nearly 50% from its peak in November.
Nonetheless, certain on-chain metrics and technical analysis suggest a strong bullish breakout could be on the horizon.
Recent data shows that the Mean Dollar Invested Age (MDIA) has been steadily increasing over the past few months. The 180-day MDIA metric has surged to 10.68, a rise from -3.2 in February.
In a similar vein, the 2-year MDIA has climbed to 103, compared to a year-to-date low of 94. This widely followed indicator has historically preceded significant rebounds, as it reflects the average age of each dollar invested in a cryptocurrency.
This indicator specifically examines whether older, inactive wallets are reintroducing their tokens into circulation. A rising MDIA is often interpreted as a bullish signal, while a decline tends to indicate that holders are selling their assets.
Cardano, much like other cryptocurrencies, has seen a decline in recent months. This drop is partially due to profit-taking by some traders following its strong performance in the fourth quarter.
Additionally, ongoing concerns surrounding tariffs imposed by President Donald Trump have contributed to the downturn.
Technical Analysis of Cardano’s Price
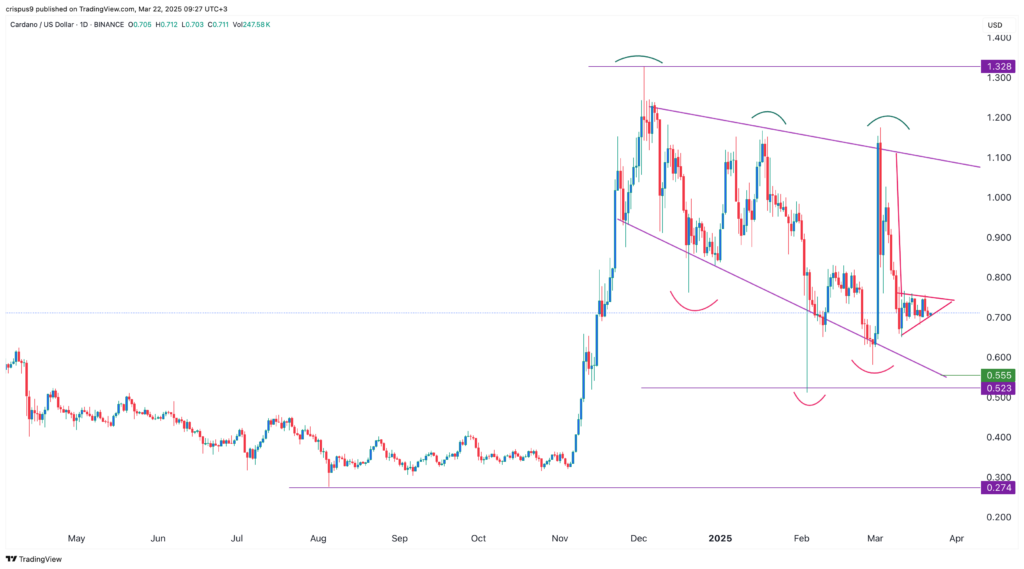
Analyzing the daily chart, we notice that ADA’s price has been in a slow downward trend over recent months, declining from a peak of $1.328 in December to approximately $0.70, as it established a series of lower lows and lower highs.
Recently, the cryptocurrency has formed a bearish pennant pattern characterized by a vertical line and a symmetrical triangle, typically signaling a strong bearish breakdown.
On a brighter note, it has also been shaping a falling broadening wedge pattern, defined by two descending and widening trendlines.
In most cases, this could lead to a substantial bullish breakout.
Consequently, the most plausible scenario is that the bearish pennant triggers a decline to the lower edge of the wedge at $0.555, followed by a resumption of an upward trend. A rebound could potentially propel it up to the psychological threshold of $1, with a further target being the prior year’s high of $1.32, marking a 90% increase from the current position.