Bitcoin (BTC) enthusiasts are working to reestablish their position by keeping prices above the 200-day simple moving average ($84,899) throughout the weekend. An analyst noted that Bitcoin needs to achieve a closing price above $85,000 this week to indicate strength and “avoid a decline to $76,000.” A closing price surpassing $87,000 would provide clearer bullish confirmation.
The impact of tariff conflicts has recently shaken both traditional and cryptocurrency markets. A market analyst believes that these pressures may persist until April 2. During a discussion, he mentioned that if tariffs are lifted, it could serve as “the most significant catalyst at this time.”
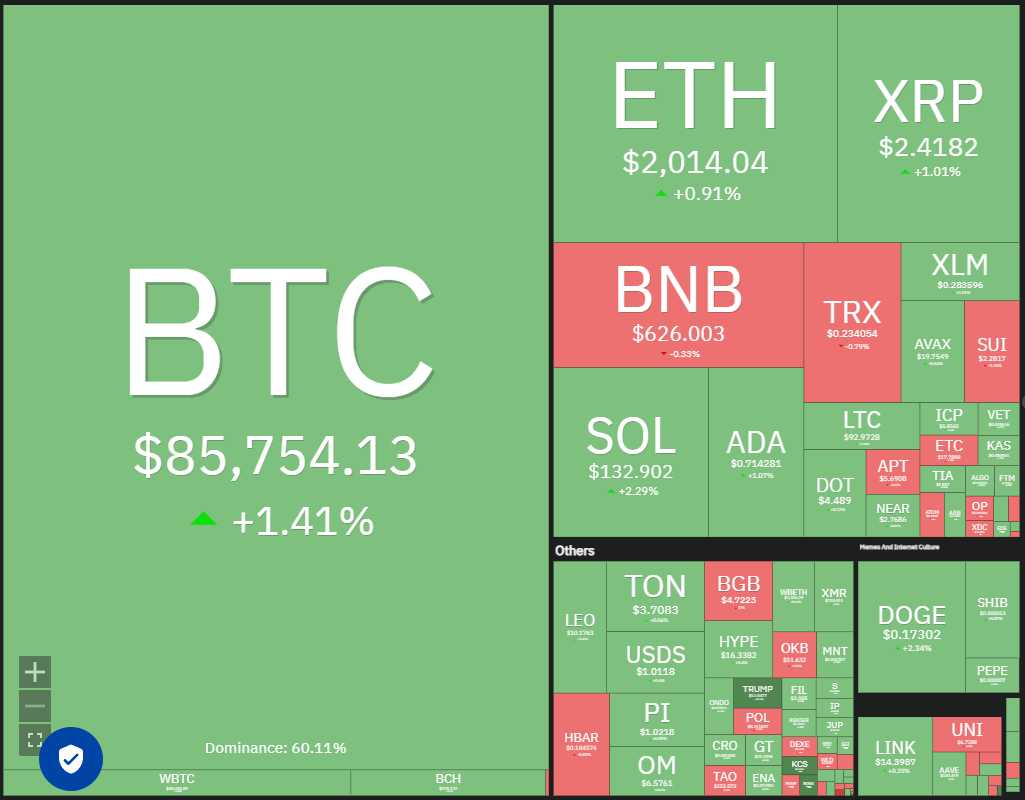
Daily overview of crypto market data.
While experts retain a bullish outlook for the long term, some predict a temporary decrease. Evaluating past bear market trends, a market analyst suggested that the current bear phase should last around 90 days. He anticipates a decline in the “next 30 days, followed by a 20-40% recovery after April 15.”
Should Bitcoin embark on a sustained recovery, several altcoins might also benefit. Which cryptocurrencies are showing positive signs on the charts?
Bitcoin Price Overview
Bitcoin faces challenges in climbing and remaining above the 20-day exponential moving average ($85,246), although there’s a silver lining as bulls seem to be holding their ground against bears.
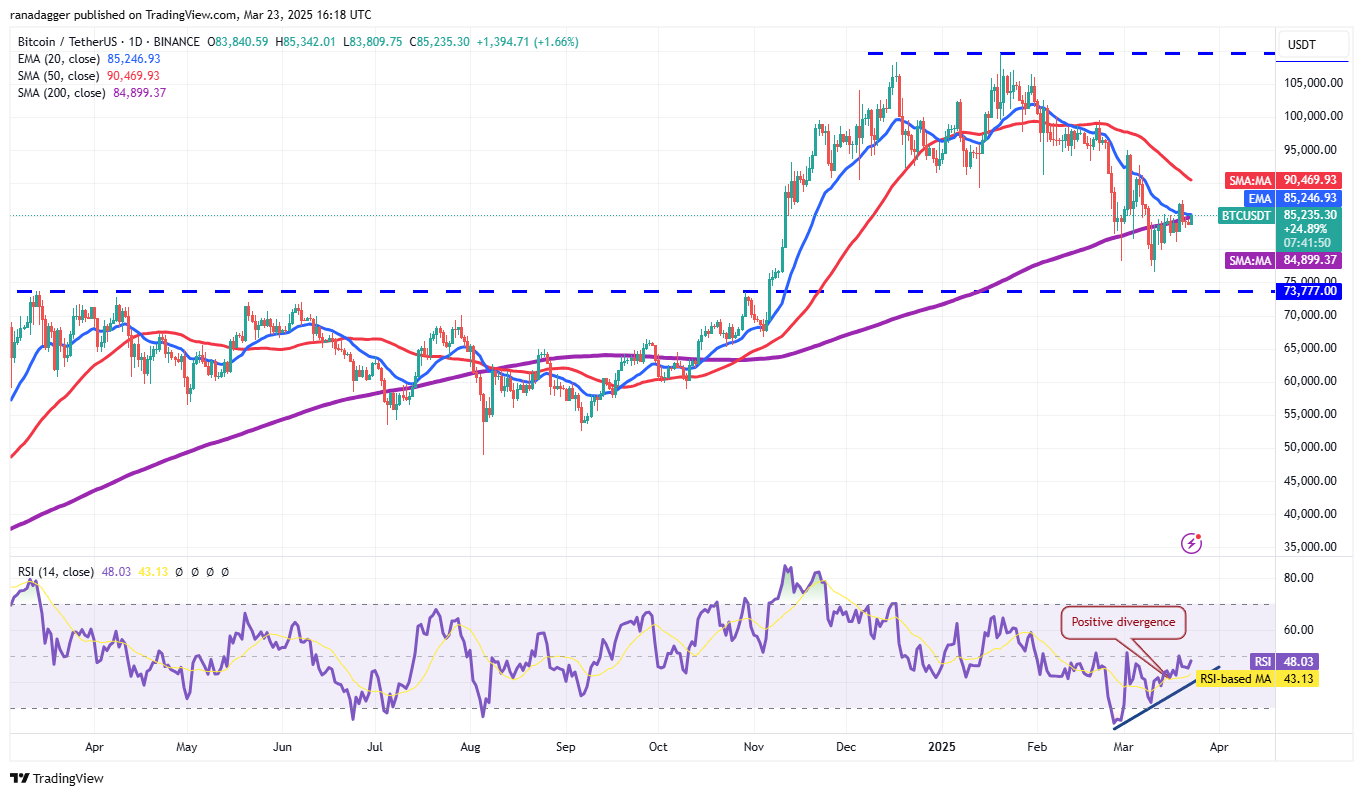
Daily BTC/USDT chart.
This scenario increases the likelihood of breaking above the 20-day EMA. If successful, the BTC/USDT pairing could rise to the 50-day SMA ($90,469) and then to $95,000.
Conversely, if the price declines from the 20-day EMA and falls below $81,000, it would indicate a retreat by the bulls. This could lead to a drop to $80,000 and further down to $76,606. Buyers are expected to defend the $76,606 level vigorously, as a breakdown there may extend the correction. Strong support exists at $73,777; if breached, the next target could be $67,000.
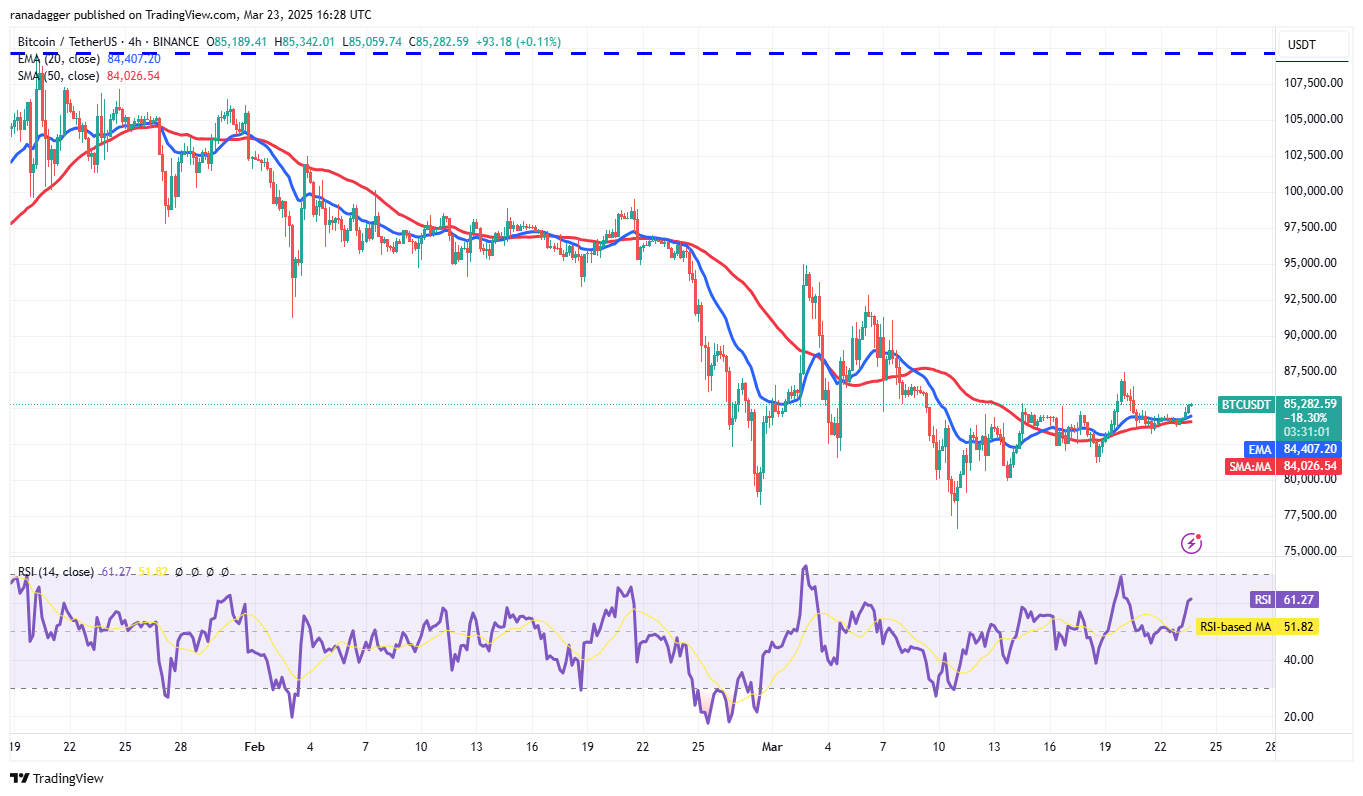
4-hour BTC/USDT chart.
Both moving averages appear relatively flat, but the relative strength index (RSI) has moved into positive territory, indicating a potential increase in bullish momentum. The first sign of strength will come with a close above $87,500, possibly paving the way for a rise to $92,500 and ultimately to $95,000.
On the other hand, a break and close below $80,000 would favor the bears, potentially sinking the pairing to solid support at $76,606.
Toncoin Price Overview
Toncoin (TON) encountered resistance at the $4 mark on March 20, yet the bulls have managed to keep the price above the moving averages.
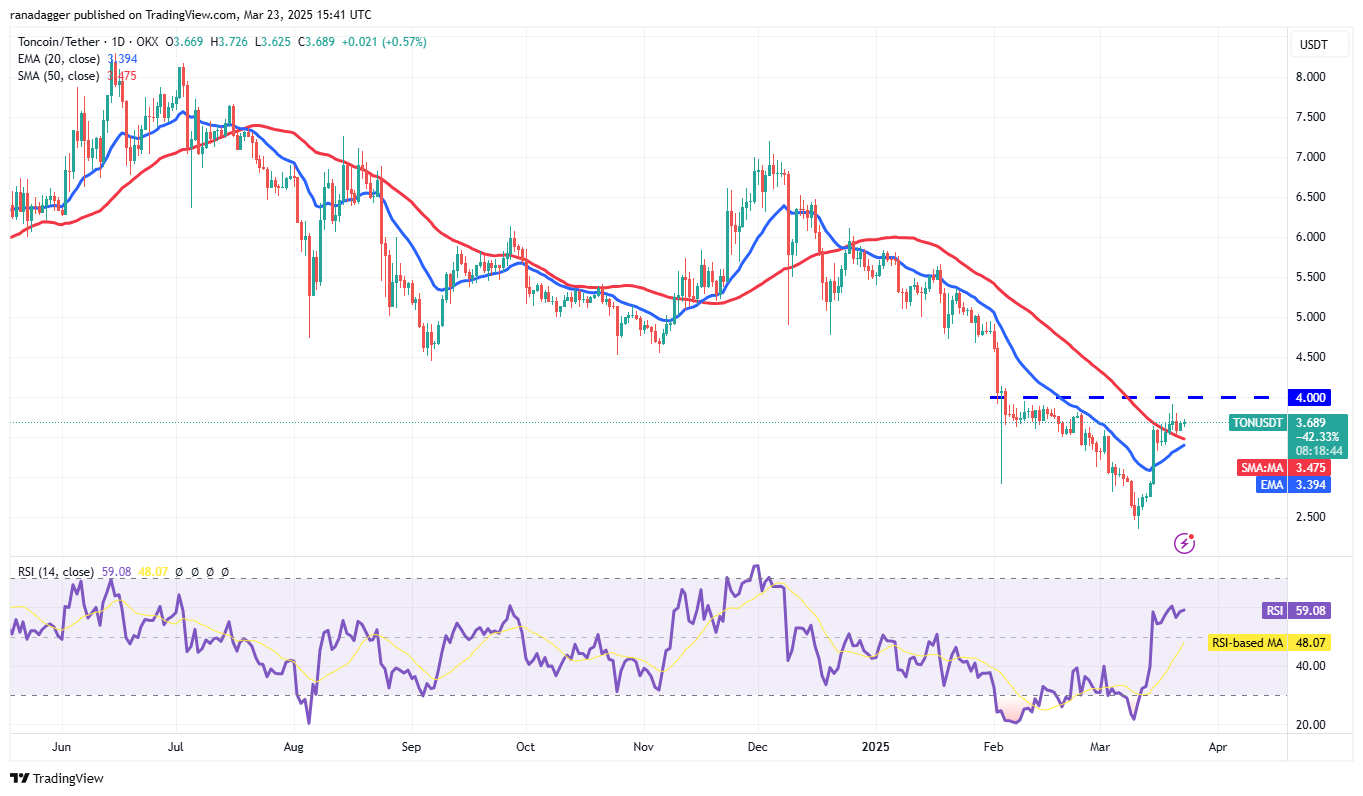
Daily TON/USDT chart.
The moving averages are near a bullish crossover, and the RSI has entered the positive zone, enhancing the chances of surpassing $4. If this occurs, the TON/USDT pairing might spike to $5.
This optimistic outlook could be challenged if prices fall below the 20-day EMA ($3.39), potentially dragging the pair down to $2.81, and then to solid support at $2.73.
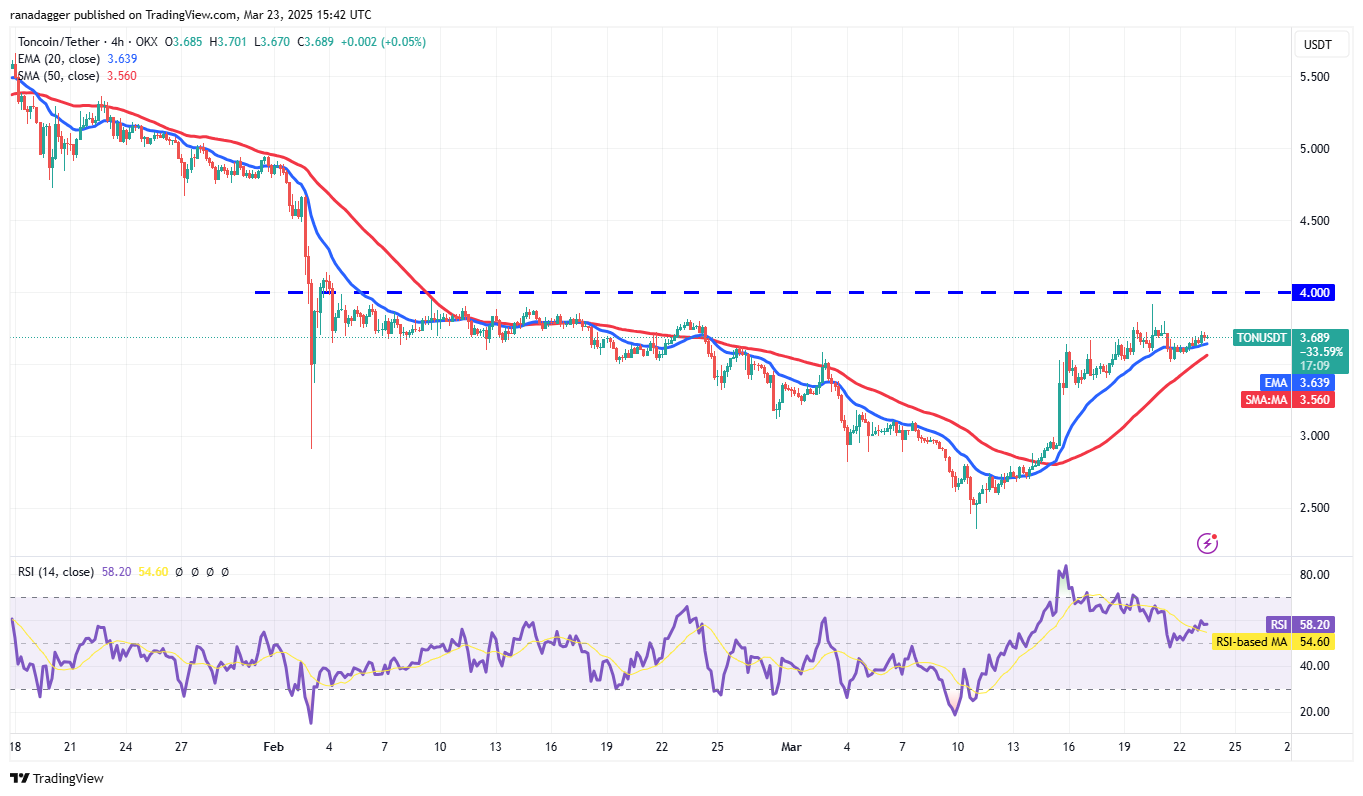
4-hour TON/USDT chart.
The pair has been finding support at the 20-EMA on the 4-hour chart, indicating that bulls are purchasing on dips. However, bears are likely to defend the $3.80 to $4 overhead resistance fiercely. Should prices close below $3.28, sellers would regain control, leading to a potential drop toward $2.90.
On the upside, a break and close above $4 would signal a shift in favor of buyers. While minor resistance exists at $4.14, it is expected to be surpassed, and the pair could target $4.67.
Avalanche Price Overview
Avalanche (AVAX) has experienced a pronounced downtrend; however, positive divergence on the RSI indicates that bearish momentum could be waning.
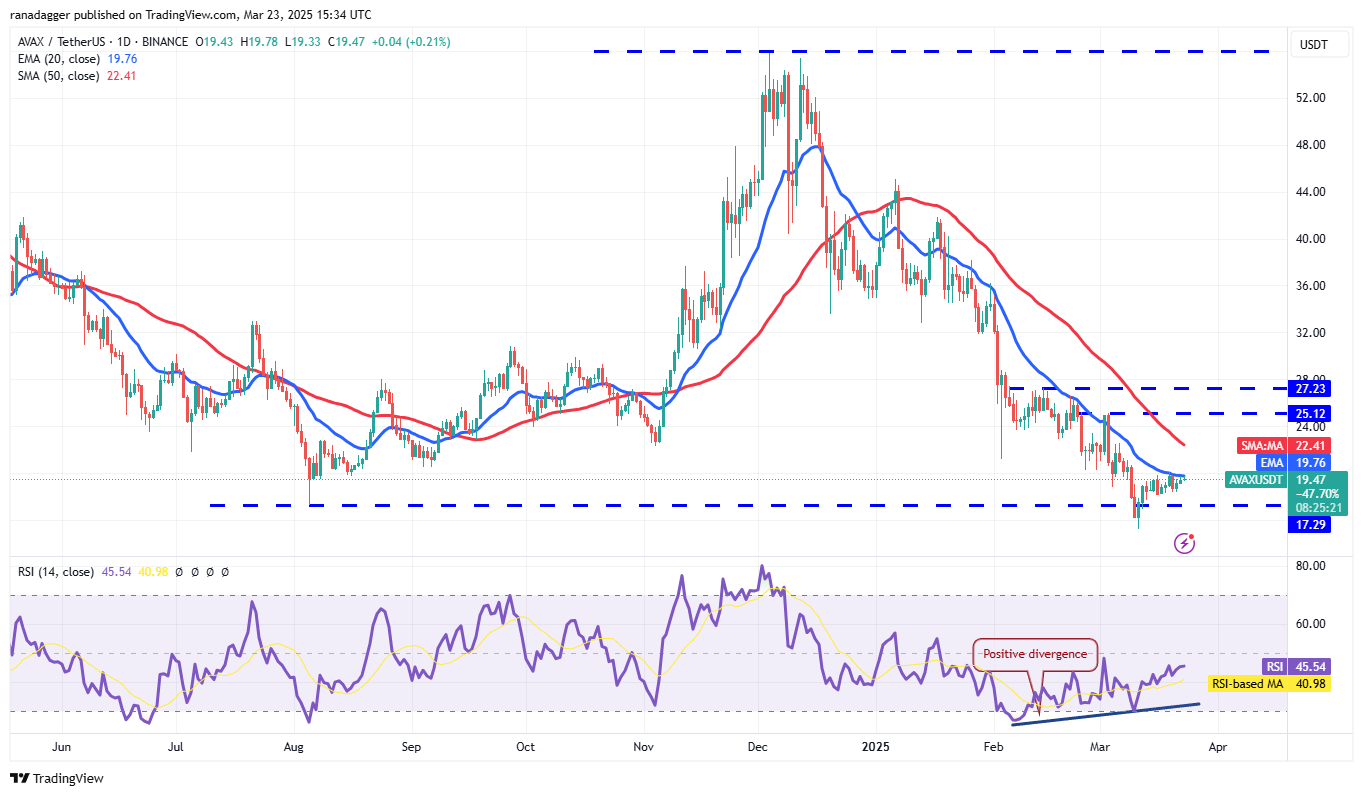
Daily AVAX/USDT chart.
The AVAX/USDT pairing has been hovering near the 20-day EMA ($19.76), raising the probability of a breakout. If successful, the pair could rise to the 50-day SMA ($22.41) and reach the $25.12 to $27.23 resistance zone. Such a move would suggest a potential end to the downtrend.
Conversely, if prices decline from the 20-day EMA and dip below the $15.27 support level, the downtrend may resume, potentially dropping to $11.
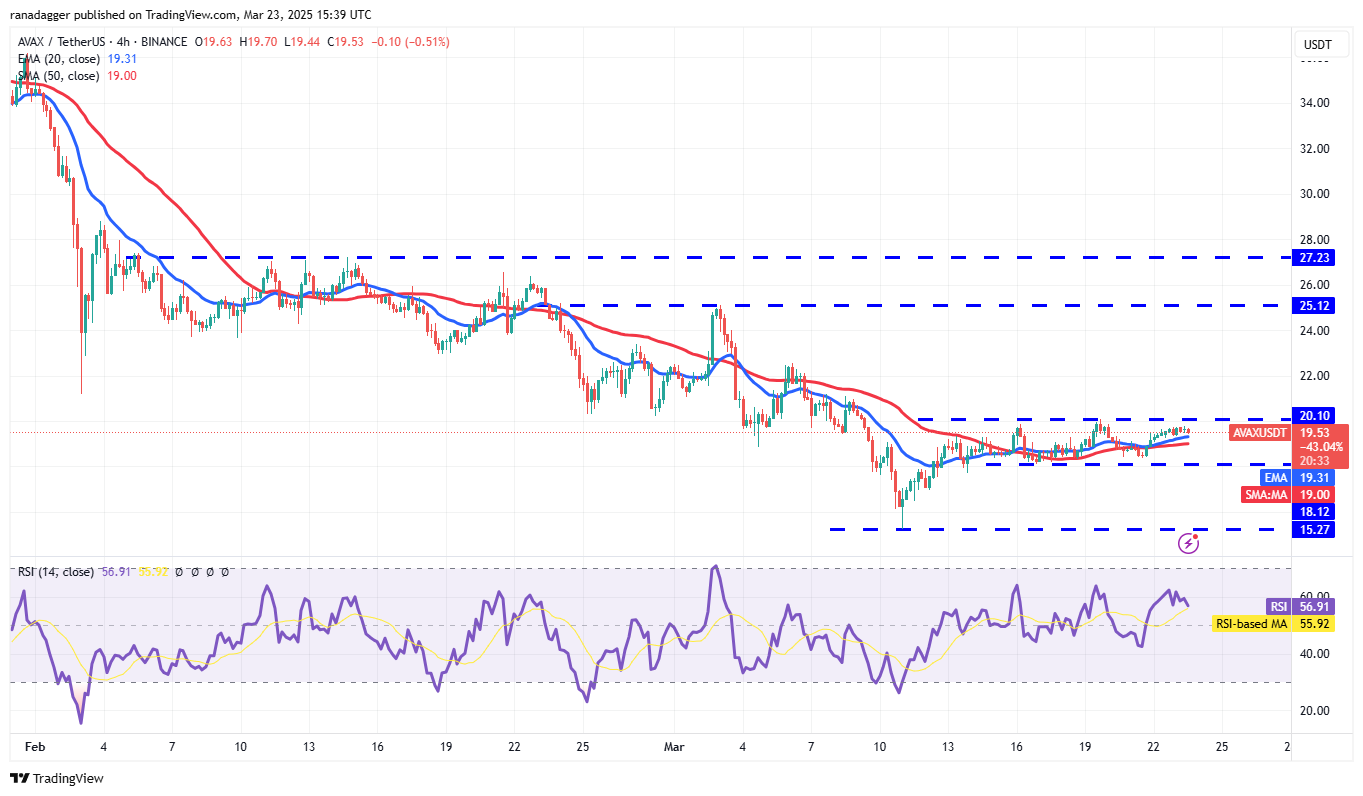
4-hour AVAX/USDT chart.
The pair has been trading within a tight range between $20.10 and $18.12 on the 4-hour chart. The 20-EMA is attempting to rise, and the RSI remains in positive territory, providing a slight edge to bulls. A break above $20.10 could lead to gains up to $21.20 and then to $22.50.
On the flip side, if the price drops and breaks below $18.12, it suggests that bears are regaining their hold. The pair might then fall to $16.95 and potentially to $15.27.
Near Protocol Price Overview
Near Protocol (NEAR) has also been on a downtrend but is showing early signs of a potential turnaround.
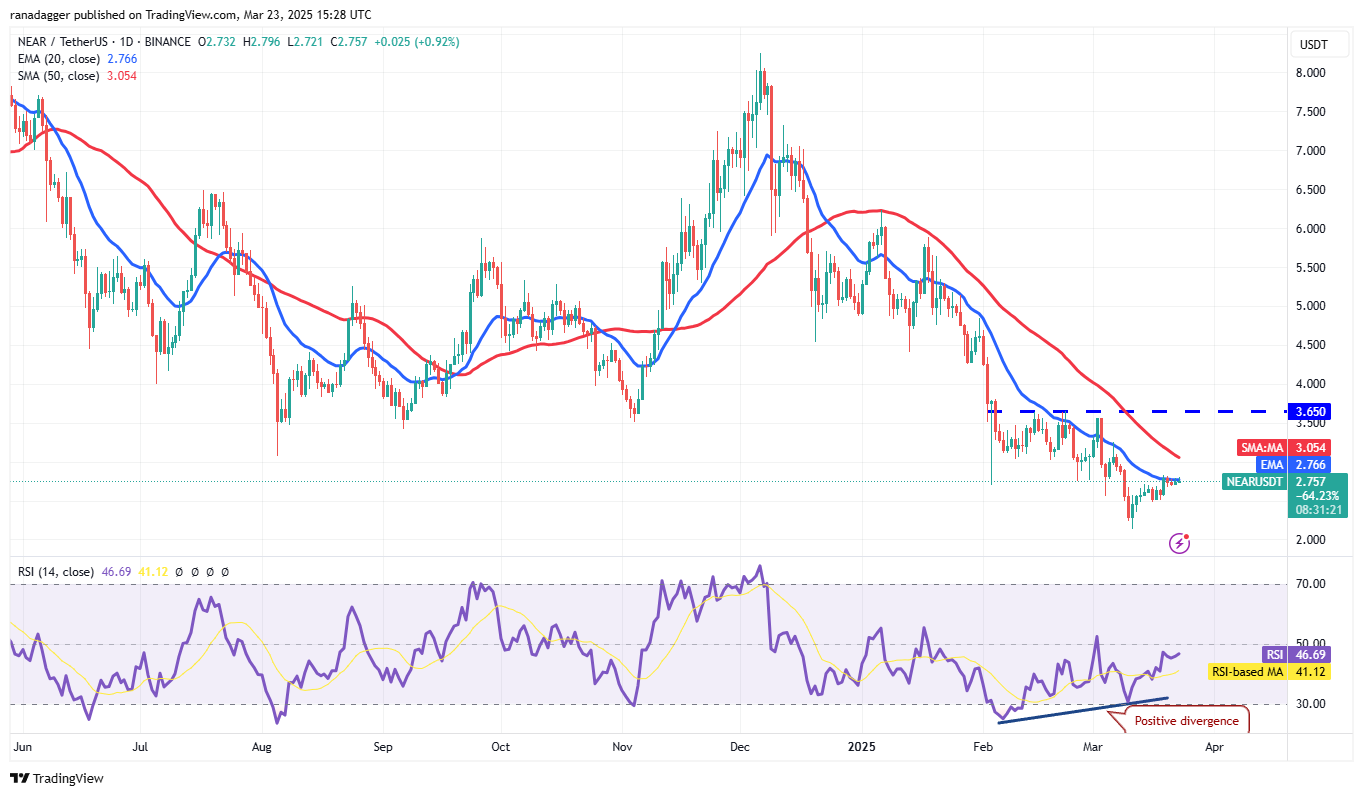
Daily NEAR/USDT chart.
Positive divergence in the RSI indicates that bearish control is weakening. A successful break and close above the 50-day SMA ($3.05) might energize bulls, allowing for a rally toward $3.65. However, sellers are likely to defend the $3.65 level aggressively; if bulls prevail, the NEAR/USDT pairing could potentially rise to $5.
On the other hand, if the price declines and falls below $2.48, it would indicate that bears continue to exert control, with the potential for a drop to solid support at $2.14.
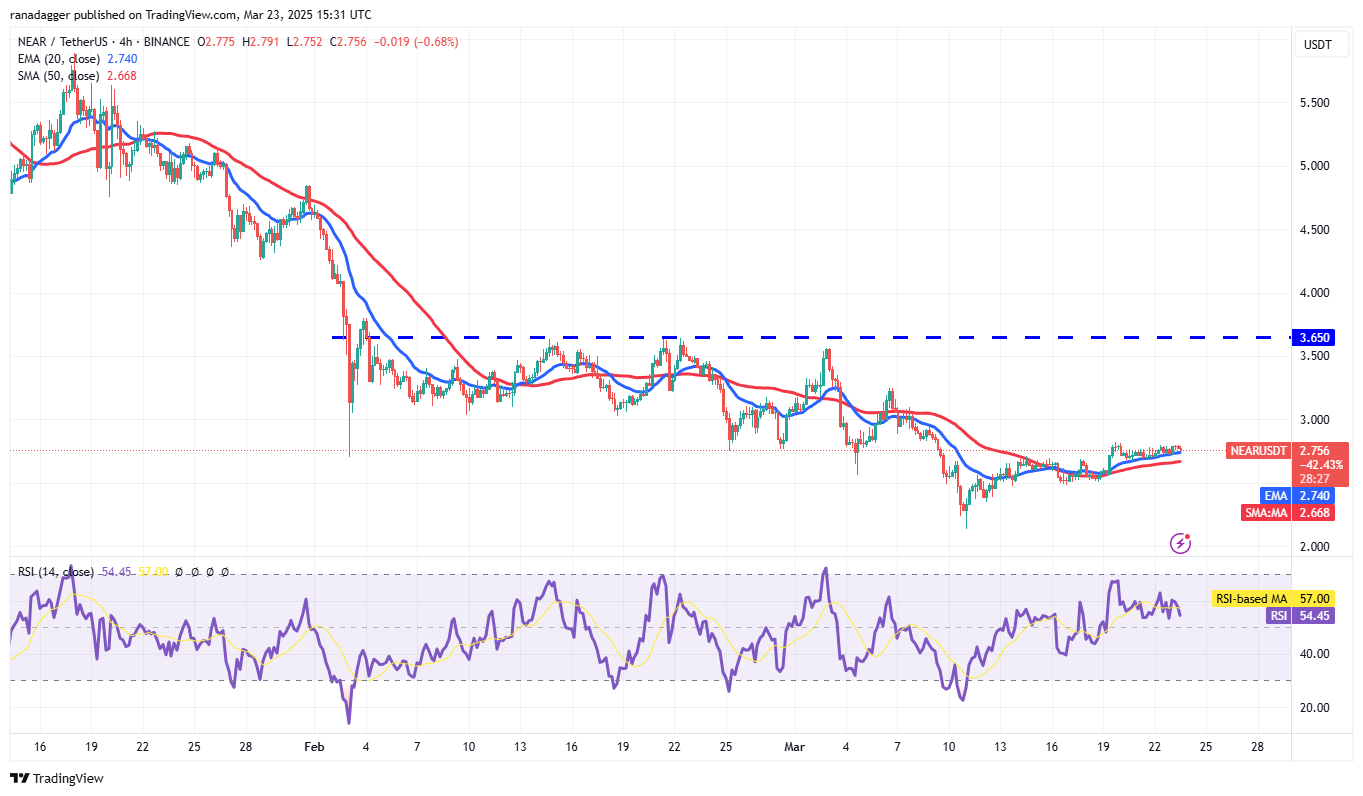
4-hour NEAR/USDT chart.
On the 4-hour chart, the pair has been trading above the 20-EMA, indicating that bulls are holding their positions in anticipation of another upward movement. A break above $2.83 could trigger a move toward $3.25. Sellers are expected to defend the $3.25 level, but if bulls break through the resistance, the next target may be $3.65.
This optimistic perspective would be challenged if the price drops and breaks below the moving averages, which could lead to further declines to $2.48 and then to $2.34.
OKB Price Overview
OKB (OKB) has been trading within a descending channel pattern, characterized by buying near the support line and selling near the resistance line.
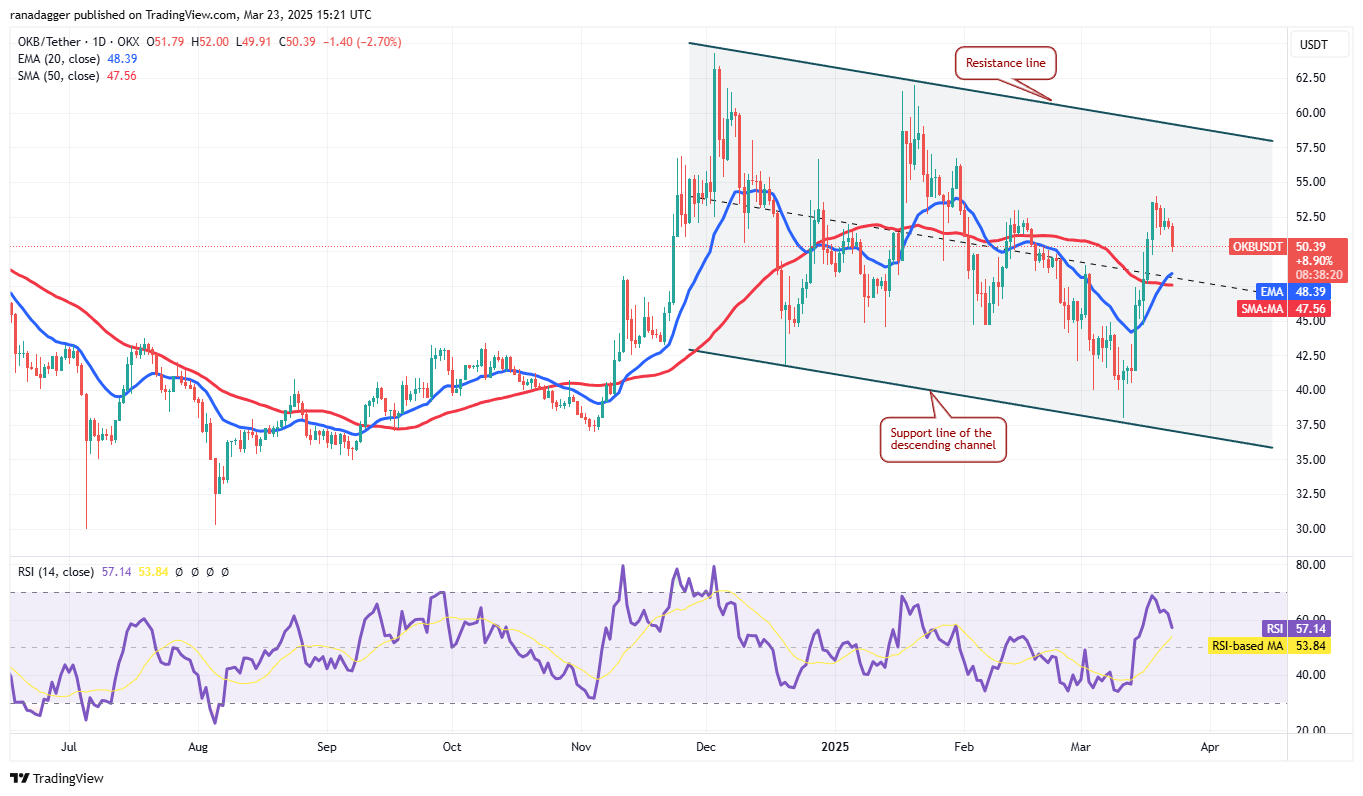
Daily OKB/USDT chart.
The OKB/USDT pair gained momentum after breaking above the 20-day EMA ($48.39) on March 14. However, it is now encountering selling pressure near $54, which might pull the price back to the 20-day EMA. This slight pullback indicates that bulls are not rushing to exit, increasing the likelihood of a rally toward the resistance line.
If the price declines further and breaks below the 50-day SMA ($47.56), it signals that bears are still retaining control at higher levels, and the pairing could drop to $45.
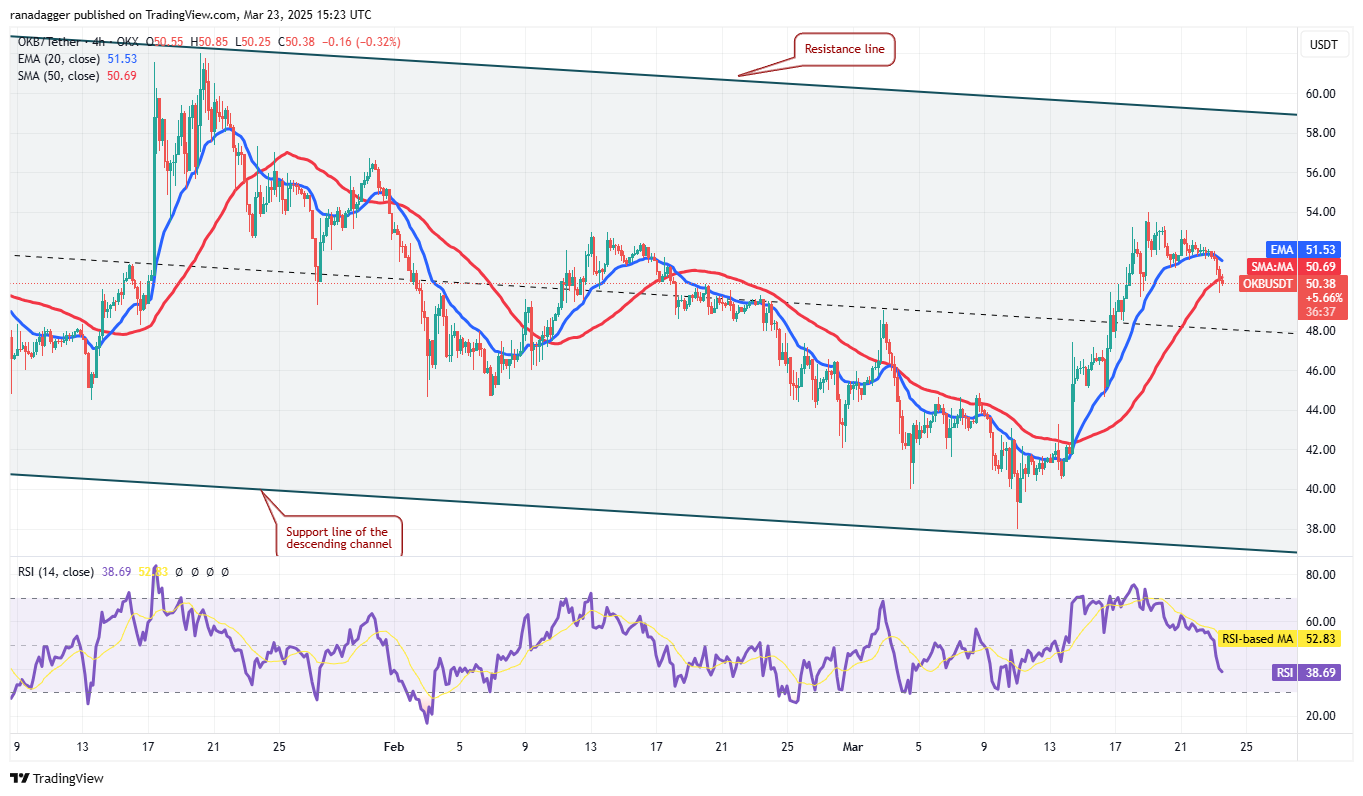
4-hour OKB/USDT chart.
Sellers are attempting to push the price below the 50-SMA on the 4-hour chart. If they succeed, it could dampen the bullish momentum. There’s support at $48; however, if that level is breached, the pair could decline to $45.
Conversely, a solid rebound off the 50-SMA would indicate that market sentiment remains positive and that bulls are buying on dips. An upward move could resume above $54, opening the way for a rally toward the resistance line.
Note: This piece does not serve as investment advice or recommendations. Each investment and trading decision carries risk, and readers are encouraged to conduct their own research prior to making a decision.