- Bitcoin hovers near $85,600 on Monday after a 4.25% recovery last week.
- Ethereum’s price finds stability around the $1,861 mark, indicating a potential rebound.
- XRP is trading at approximately $2.41 on Monday after climbing nearly 7% over the past week.
Bitcoin (BTC) is hovering around $85,600 on Monday after experiencing a 4.25% recovery last week. Ethereum (ETH) and Ripple (XRP) have mirrored BTC’s performance, stabilizing around their critical levels after both rose close to 7% the previous week.
Bitcoin bulls target the $90,000 milestone
Last week, Bitcoin’s price broke and settled above its 200-day Exponential Moving Average (EMA) at about $85,502 but struggled to maintain support at that level. It again broke and closed above the 200-day EMA on Sunday. As of Monday, it remains around $85,600.
If BTC can secure support near its 200-day EMA, it might continue its recovery and aim to retest the psychologically significant $90,000 threshold.
The Relative Strength Index (RSI) on the daily chart stands at 48, trending upward toward a neutral 50, which suggests diminishing bearish momentum. For the recovery to be sustainable, the RSI needs to rise above the neutral 50 mark. The Moving Average Convergence Divergence (MACD) indicator indicated a bullish crossover on the daily chart last week, signaling a buying opportunity and hinting at a bullish trend ahead. Moreover, it shows increasing green histogram values above the neutral zero line, pointing to strengthening upward momentum.
BTC/USDT daily chart
Nevertheless, if BTC fails to find support near its 200-day EMA and closes below $85,000, it may further decline to test the next support level at $78,258.
Ethereum may extend its recovery if it maintains the $1,861 support
The price of Ethereum has found support at its daily level of $1,861 for the last two weeks, experiencing a recovery of nearly 7% last week. As of Monday, it is hovering around $1,980.
Should the daily support at $1,861 hold, ETH’s price could continue to recover and aim to retest its March 7 high of $2,258.
The RSI on the daily chart reads 40, approaching its neutral level of 50, indicating diminishing bearish pressure. However, for a sustained recovery, the RSI needs to surpass the neutral 50 level. The MACD indicator showed a bullish crossover on the daily chart last week, providing a buy signal and suggesting a bullish trend is likely. Additionally, it shows increasing green histogram levels above the neutral zero mark, indicating strengthening upward momentum.
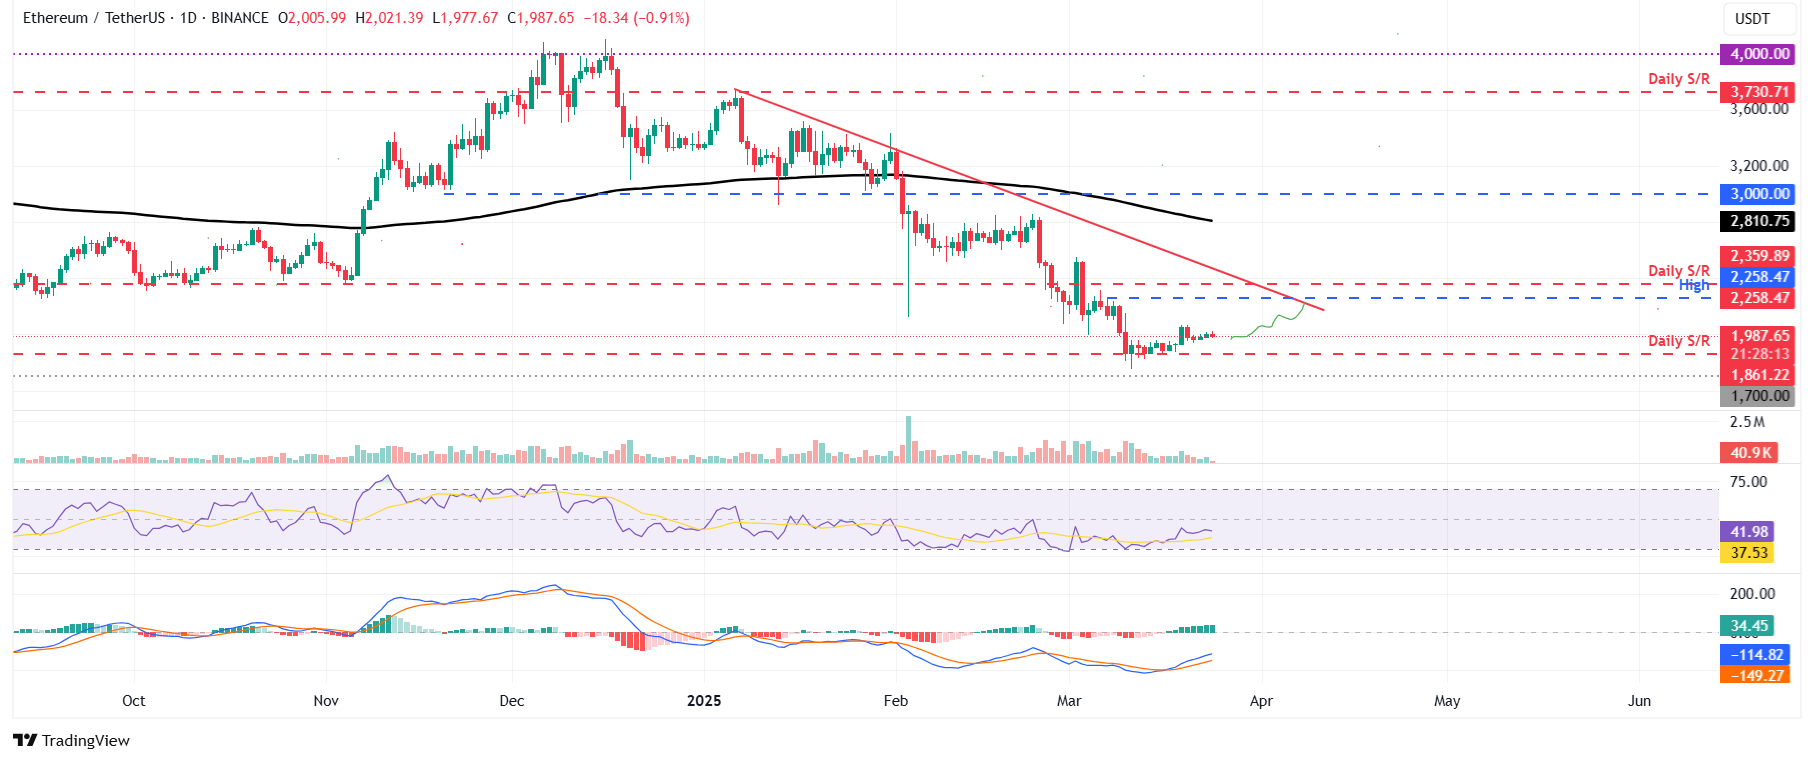
ETH/USDT daily chart
However, if ETH drops and closes below the crucial support at $1,861, it might extend its decline to the next support level at $1,700.
Ripple may rebound if it holds above the 100-day EMA
Ripple’s price broke above its 100-day EMA at $2.31 last week and has seen an approximate 7% recovery. As of Monday, it is trading around $2.42.
If the 100-day EMA at around $2.42 continues to hold, Ripple could extend its recovery and retest the next resistance level at $2.72.
The RSI on the daily chart sits at 51, hovering near the neutral 50 mark, indicating indecision among traders. For bullish momentum to sustain, the RSI must trend upward and move past the neutral 50 level. The MACD indicator showed a bullish crossover on the daily chart last week, providing a buy signal and suggesting a bullish outlook.
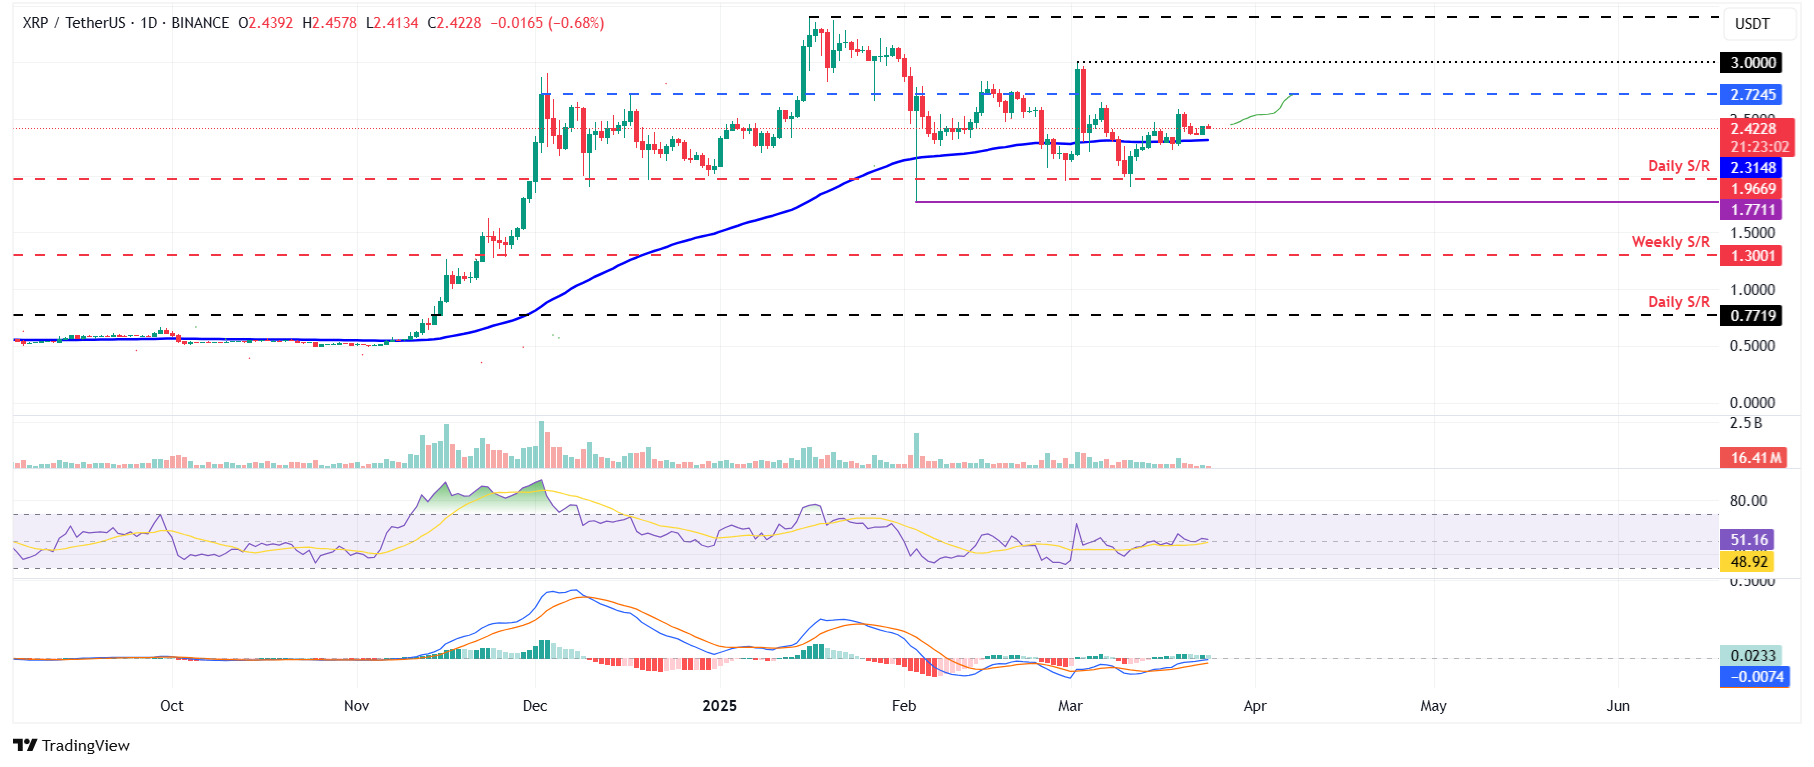
XRP/USDT daily chart
However, if XRP fails to maintain support around its 100-day EMA and closes below this level, it might see a further decline, testing the next support area at $1.96.
FAQs on Bitcoin, Altcoins, and Stablecoins
Bitcoin is the largest cryptocurrency by market cap, functioning as a virtual currency intended for use as money. This payment method is not governed by any individual, group, or organization, thereby removing the necessity for third-party involvement in financial transactions.
Altcoins refer to any cryptocurrency that is not Bitcoin. Some people do not consider Ethereum as an altcoin because it is from these two cryptocurrencies that forking occurs. If this perspective holds, then Litecoin can be viewed as the first altcoin, having forked from Bitcoin’s protocol and representing an “improved” version of it.
Stablecoins are cryptocurrencies designed to maintain a stable price, with their value backed by reserves of the asset they represent. To accomplish this, each stablecoin’s value is pegged to a commodity or financial instrument, such as the US Dollar (USD), with its supply regulated based on algorithms or demand. The primary aim of stablecoins is to provide a means for investors to transition into and out of cryptocurrencies. They also serve as a store of value, as cryptocurrencies generally experience volatility.
Bitcoin dominance is the measure of Bitcoin’s market capitalization relative to the total market capitalization of all cryptocurrencies combined. It reflects Bitcoin’s appeal among investors. A high Bitcoin dominance often precedes and coincides with bull runs, as investors typically seek out stable, high market cap cryptocurrencies like Bitcoin. A decrease in Bitcoin dominance often indicates that investors are reallocating their capital and/or profits towards altcoins in hopes of achieving higher returns, which can trigger significant rallies in the altcoin market.