XRP has experienced a decline of almost 30% from its seven-year peak of $3.39 reached in January.
However, positive developments—such as the potential settlement in Ripple’s SEC case and a new license in Dubai—have contributed to a recovery. As of March 24, XRP was trading as high as $2.47, reflecting a 38% increase from its year-to-date low of $1.79.
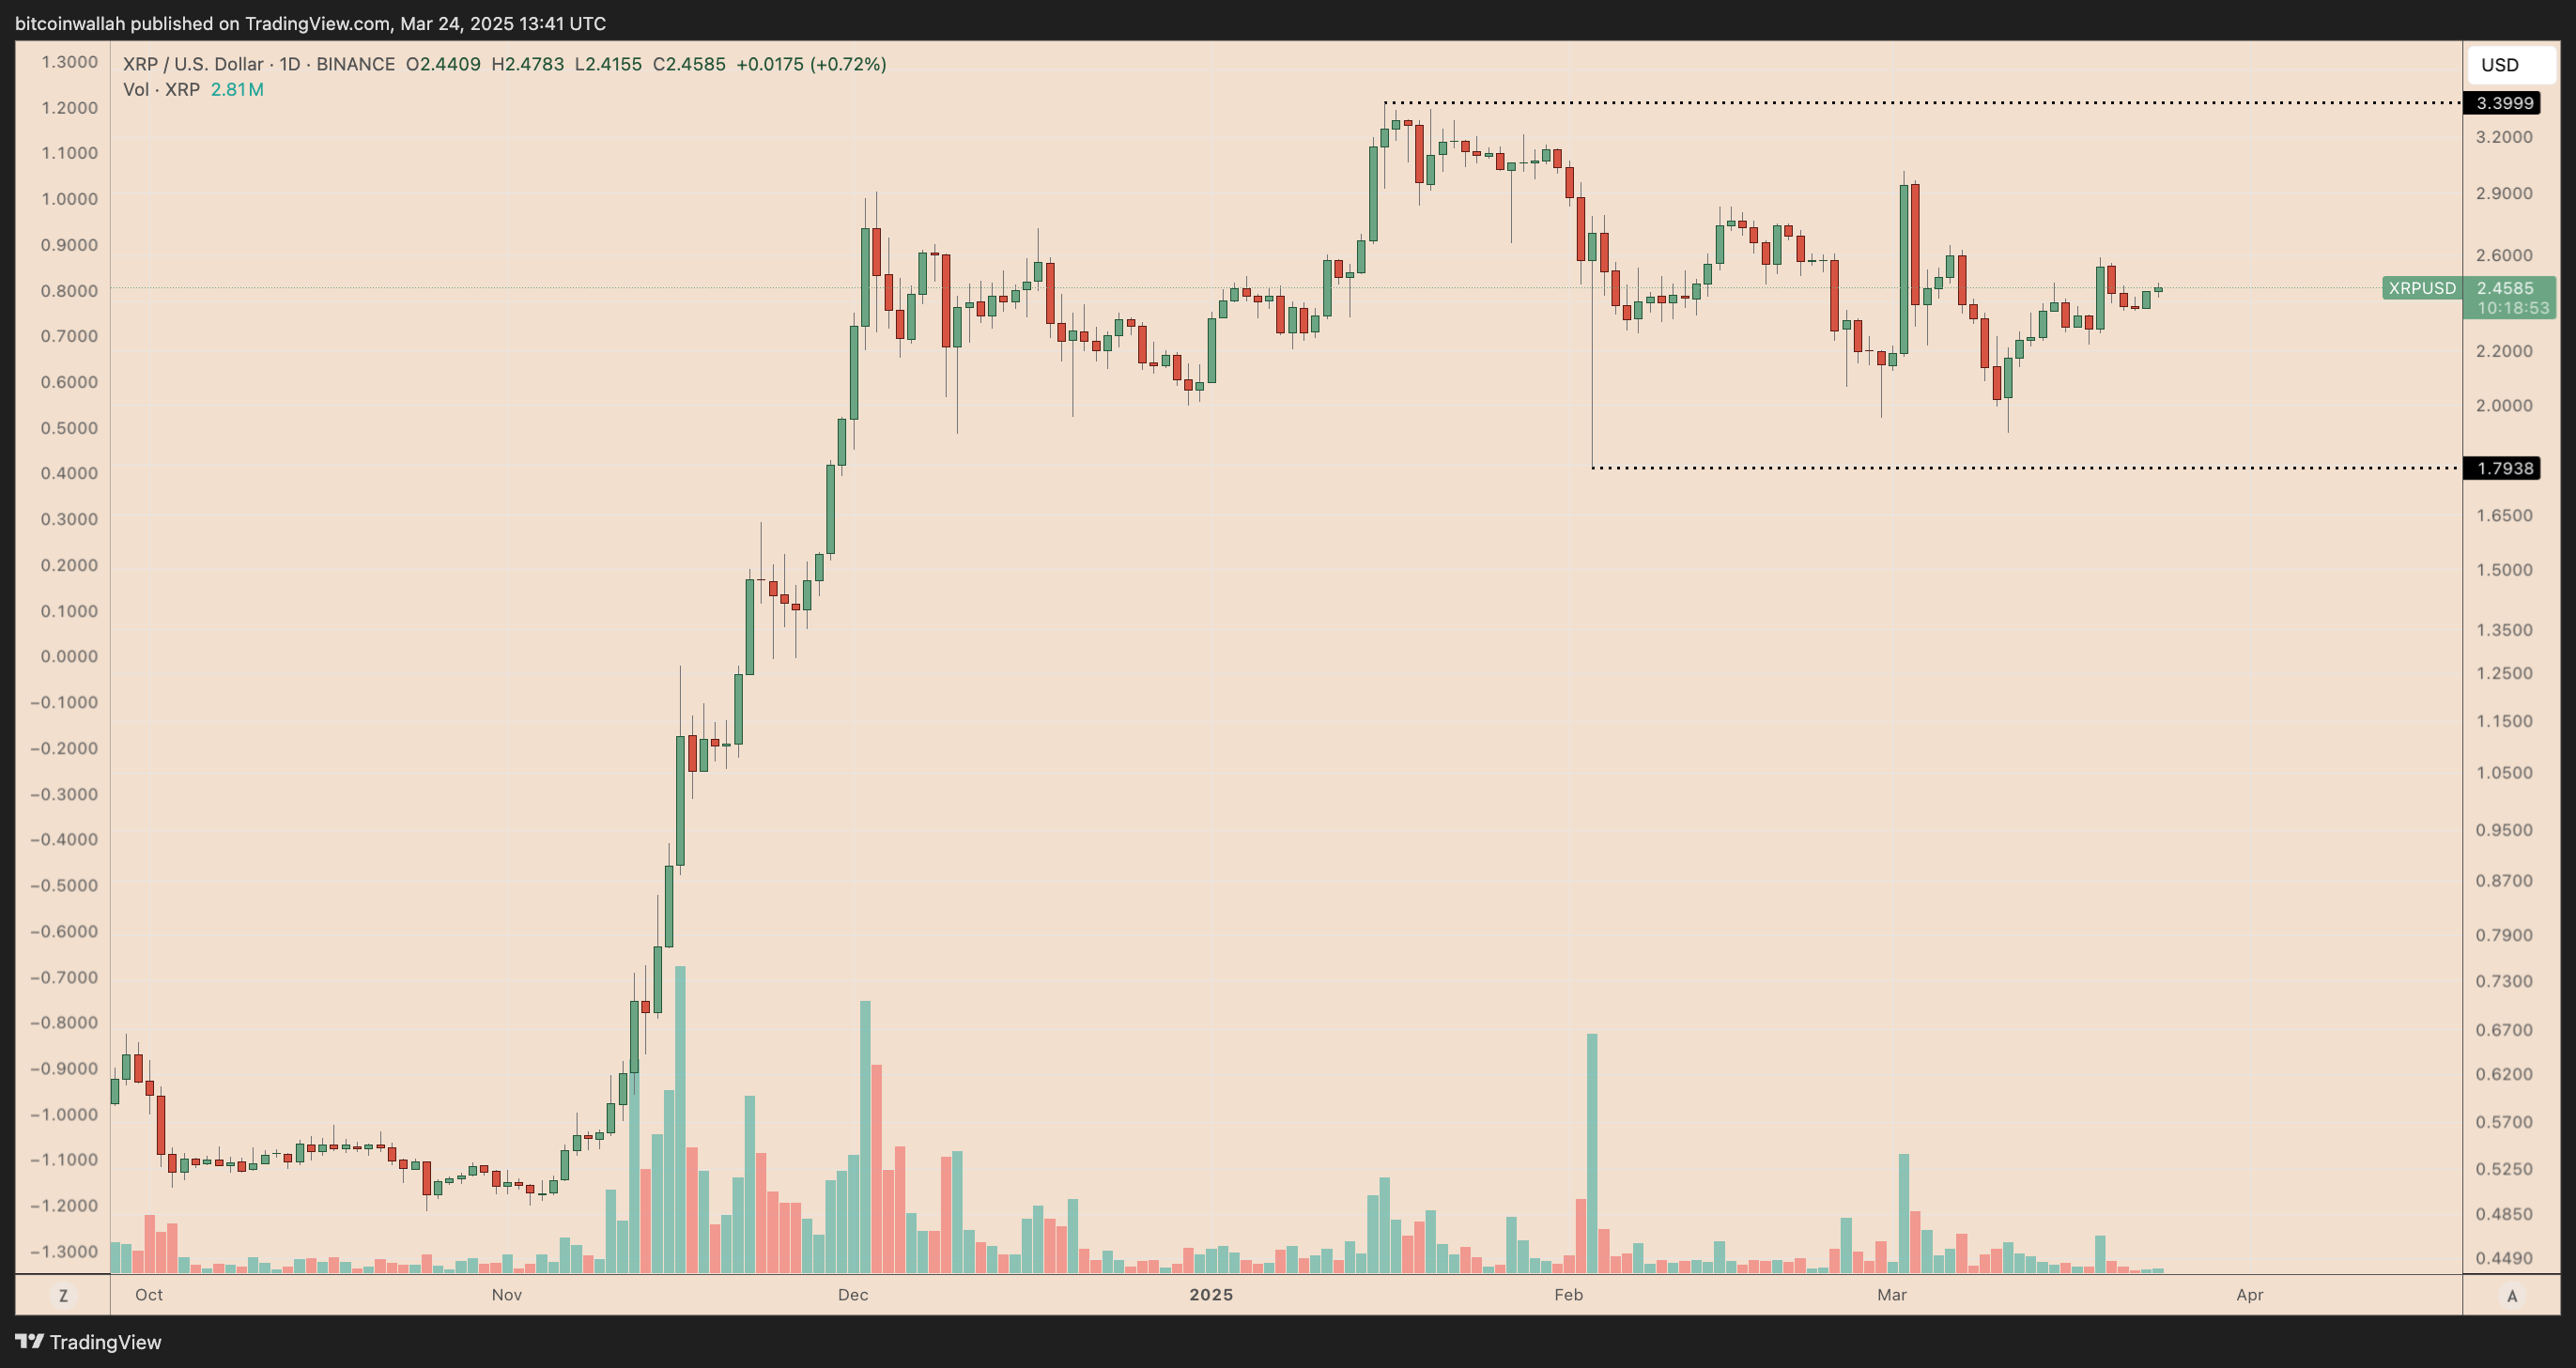
XRP/USD daily price chart. Data from TradingView
What could be the future price trajectory for XRP? Let’s take a closer look.
XRP’s rising channel suggests a $2.77 target
XRP is making gains within an ascending parallel channel, indicating strength as it approaches a vital resistance level.
Key observations include:
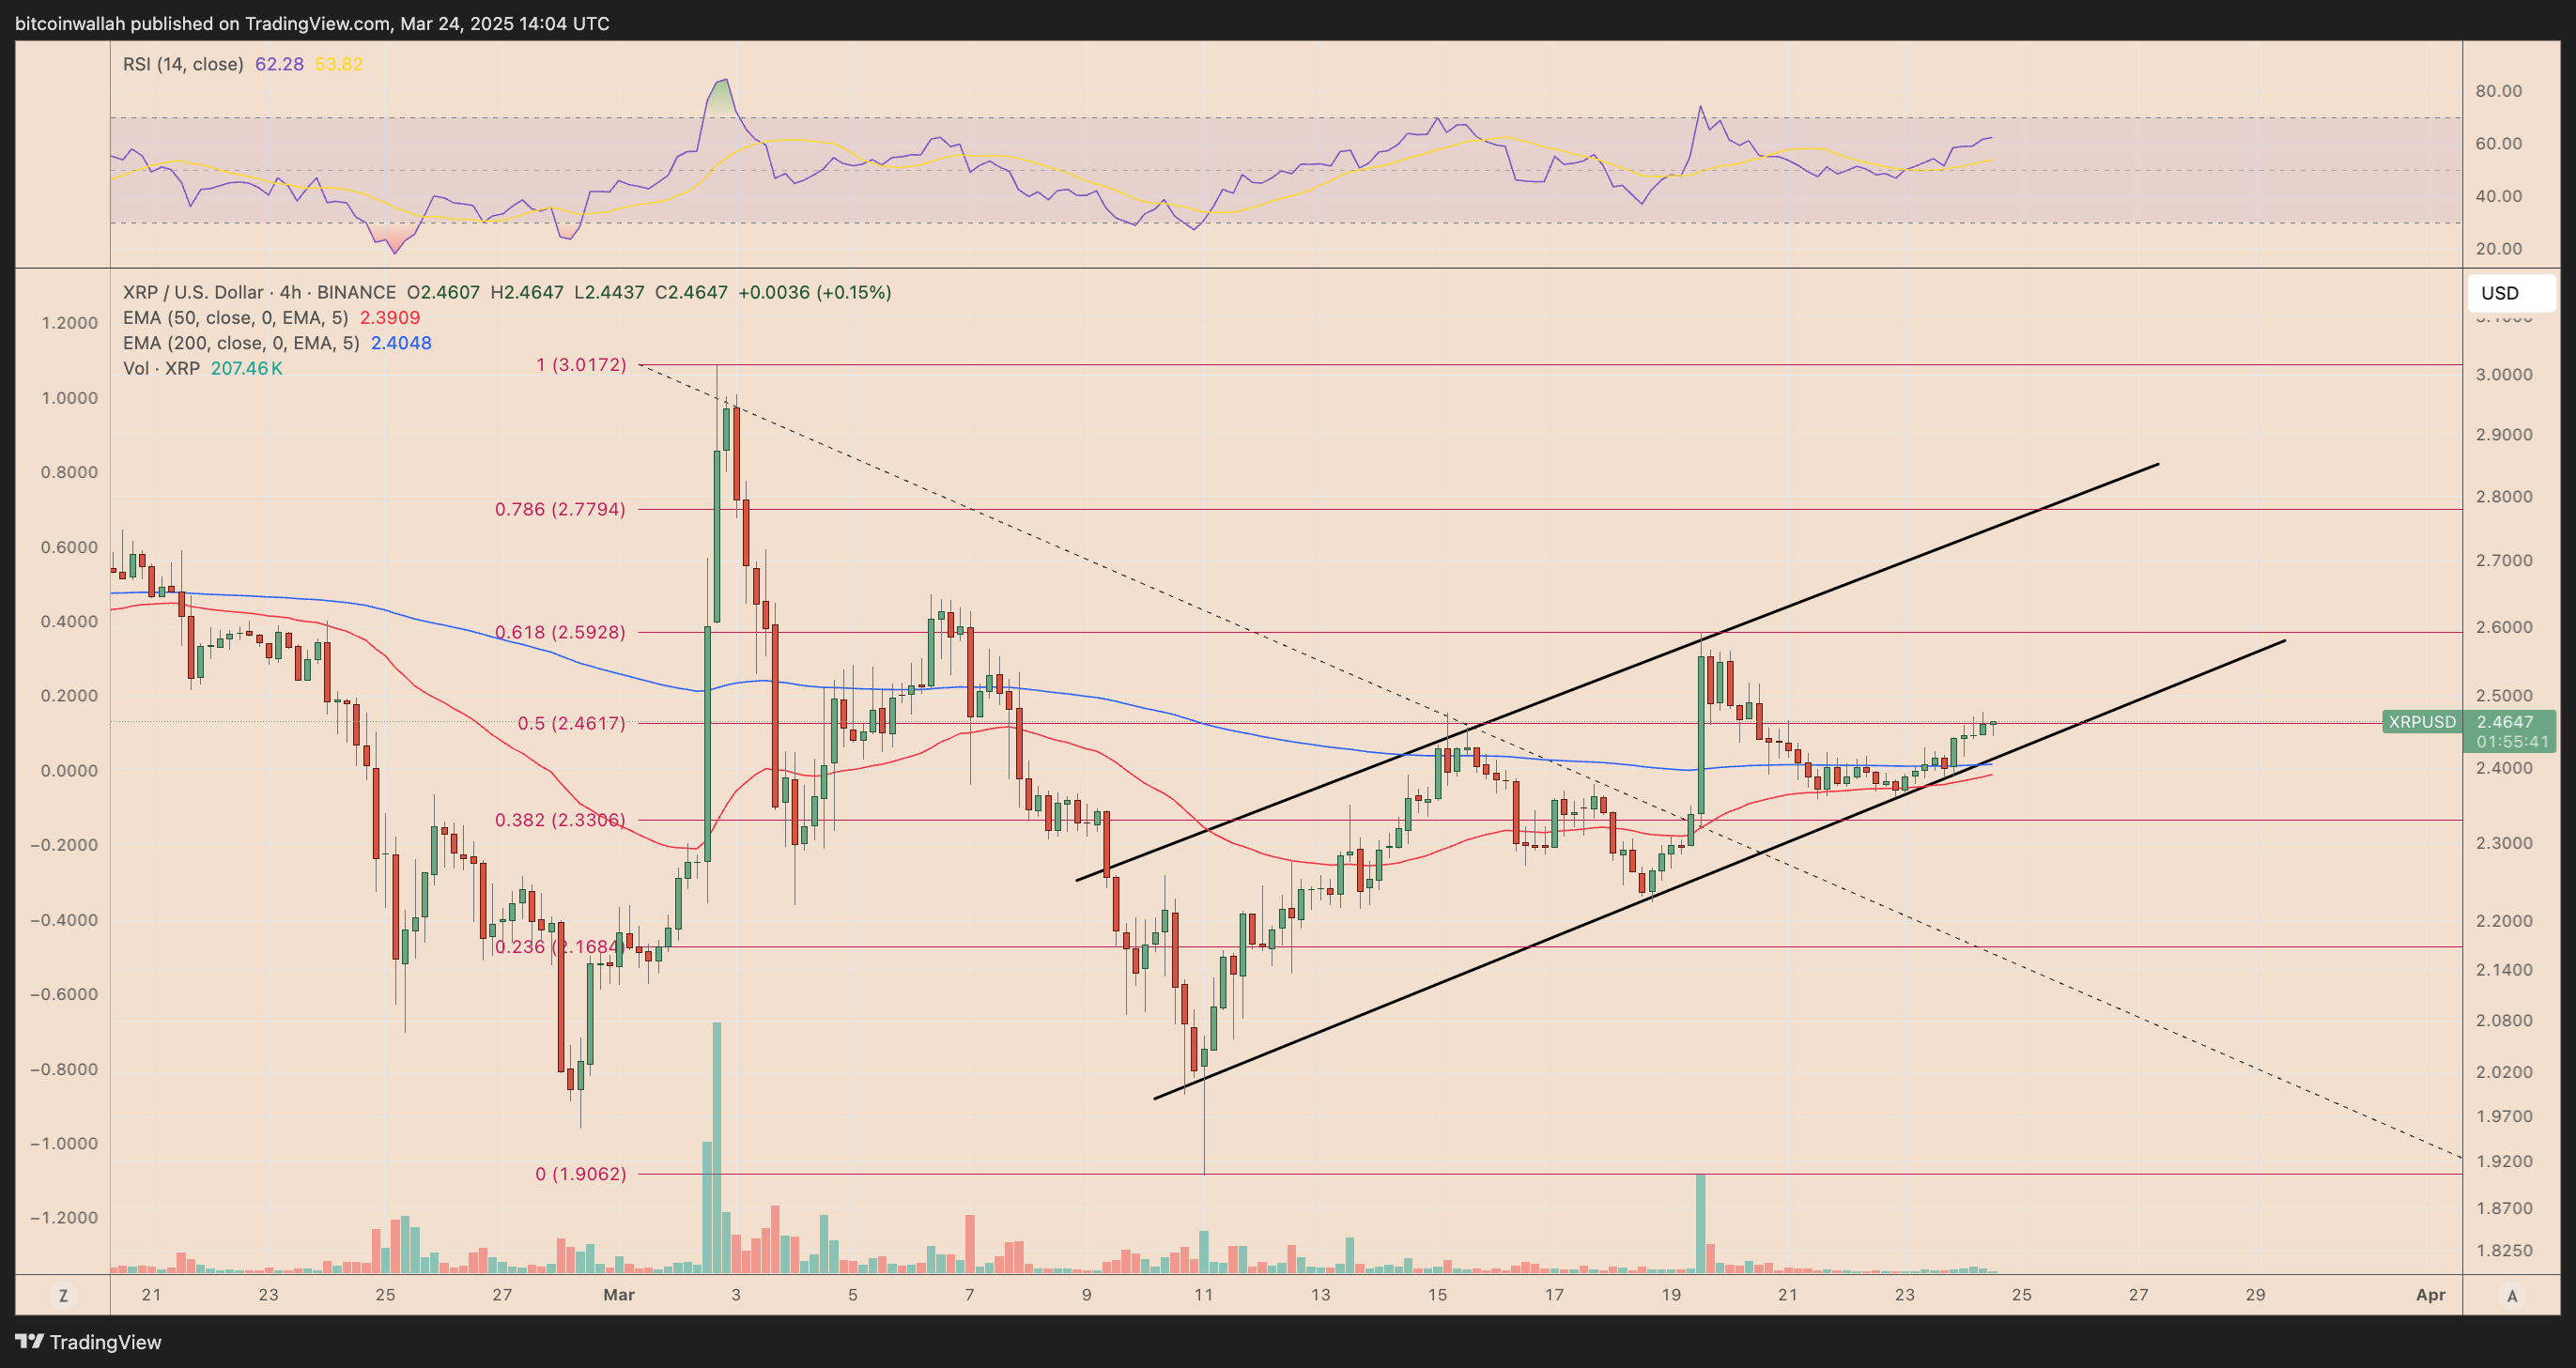
XRP/USD four-hour price chart. Data from TradingView
-
The asset is now looking to retest $2.59—the 0.618 Fibonacci retracement level—which previously served as significant resistance during the rally on March 19.
-
A successful breakout past this resistance could lead XRP to test the upper trendline of the channel, situated around $2.77—which meshes with the 0.786 Fibonacci level.
-
A market analyst noted that XRP needs to stabilize above $2.50, aligning with its all-time high volume-weighted average price (VWAP), to maintain bullish momentum.
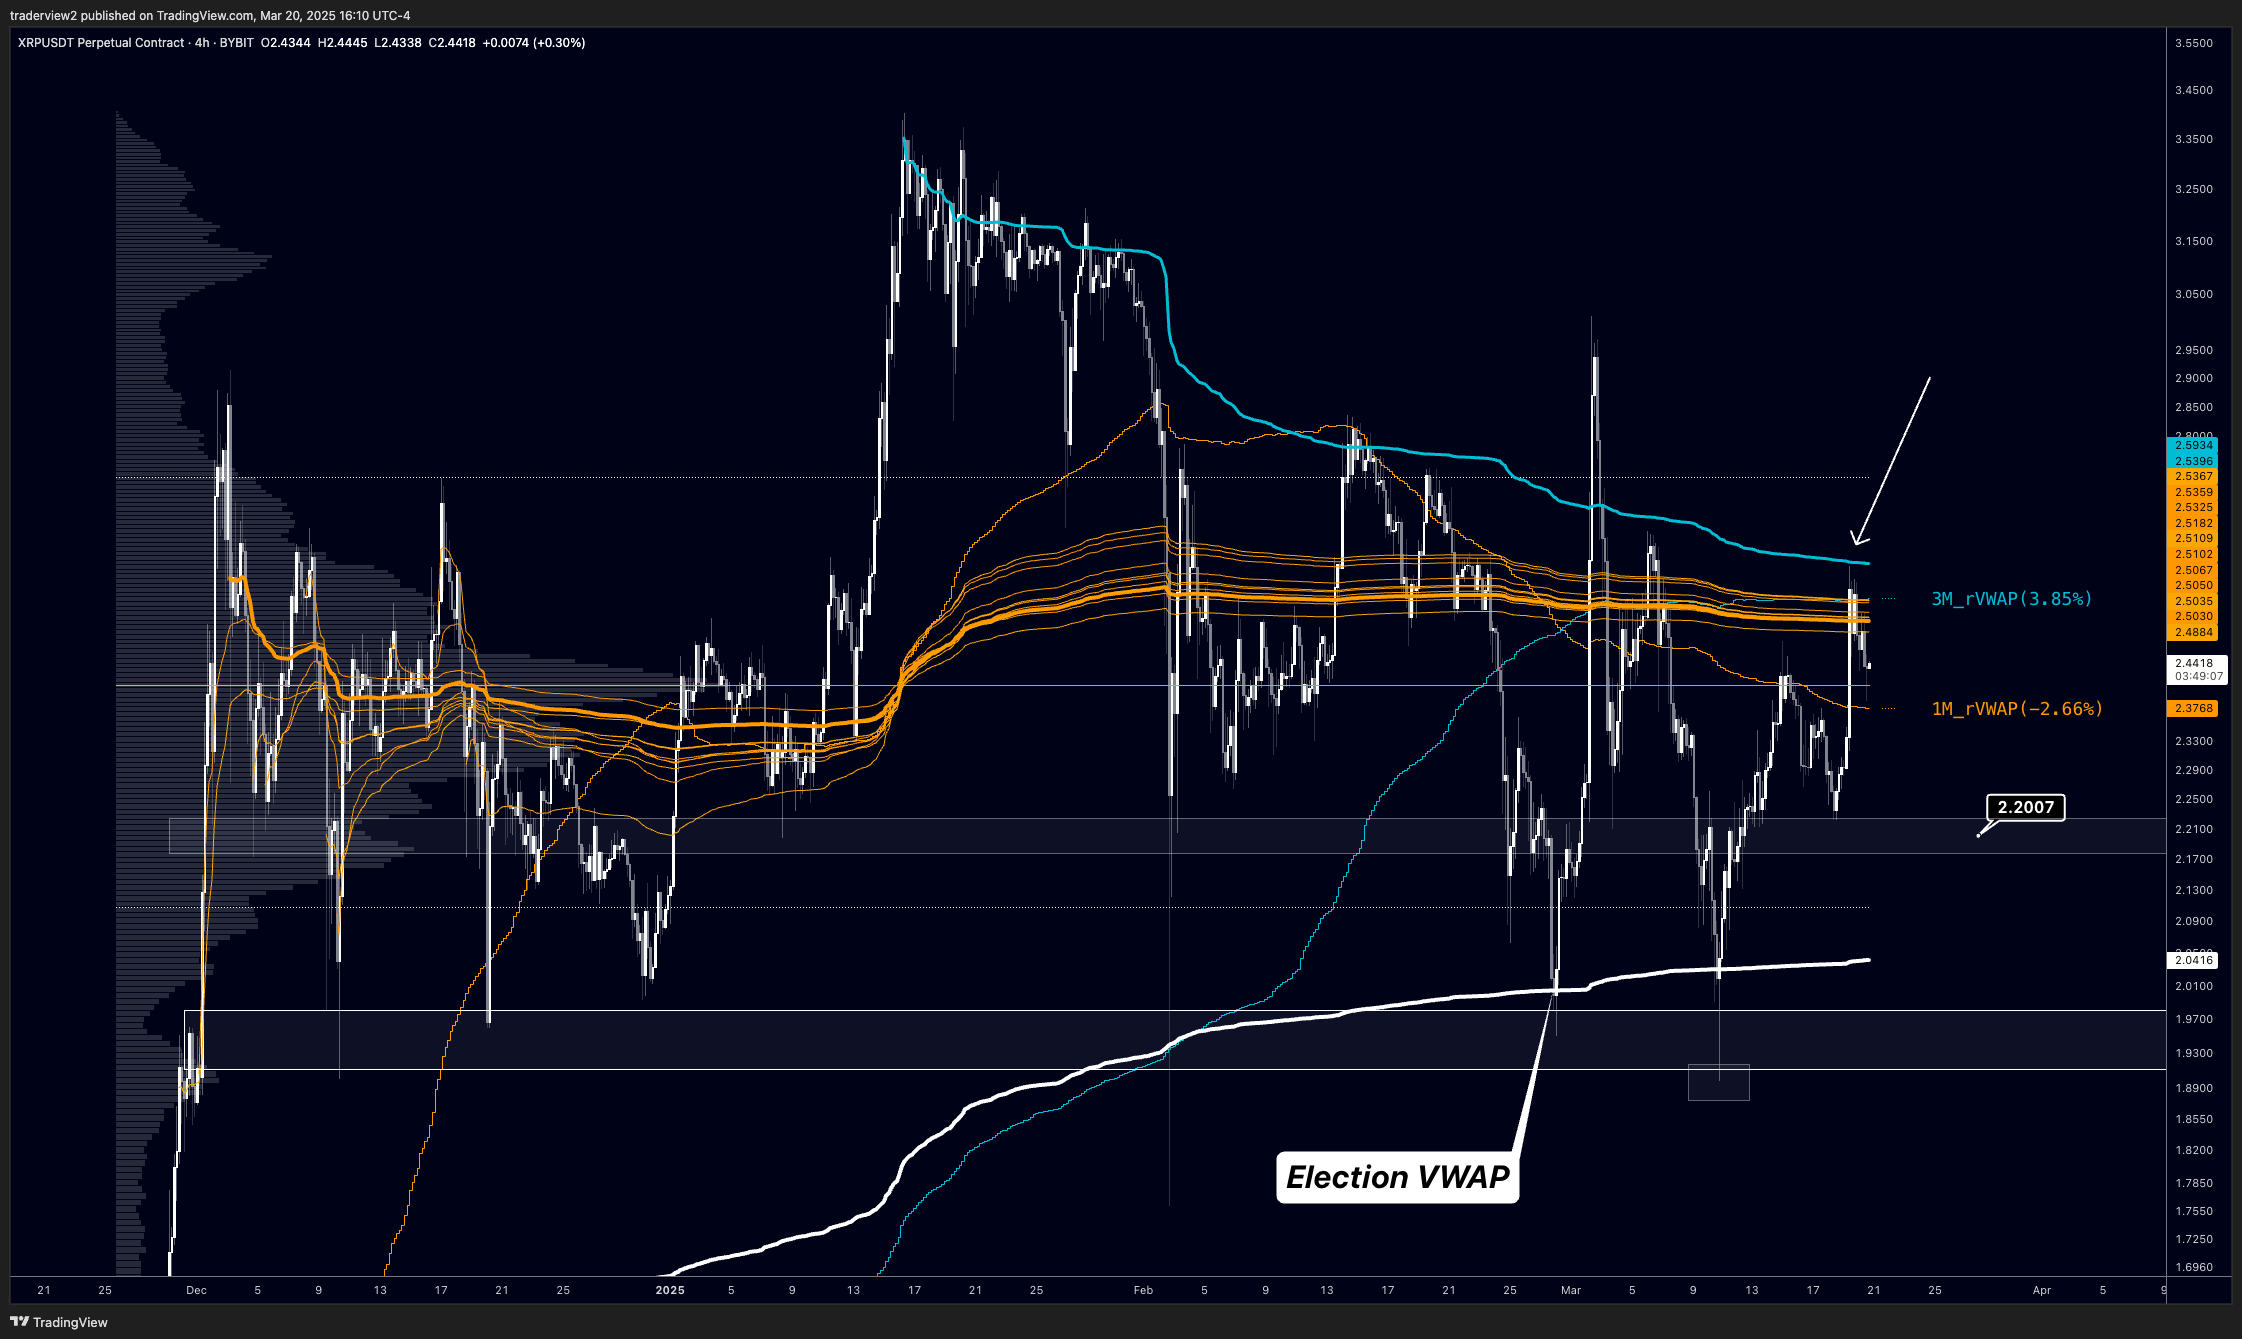
XRP/USD four-hour price chart. Data from TradingView
-
The Relative Strength Index (RSI) is showing a reading above 60, indicating escalating bullish momentum without reaching overbought conditions.
Potential breakout from XRP’s symmetrical triangle
XRP is signaling a significant bullish potential in higher timeframe charts, as price movements are consolidating within a symmetrical triangle, hinting that a breakout may be imminent.
Here’s what to know:
-
A symmetrical triangle forms when the price moves within a triangular structure following a notable uptrend or downtrend.
-
This pattern usually resolves with a breakout in the direction of the prior trend, potentially moving the price as much as the triangle’s height.
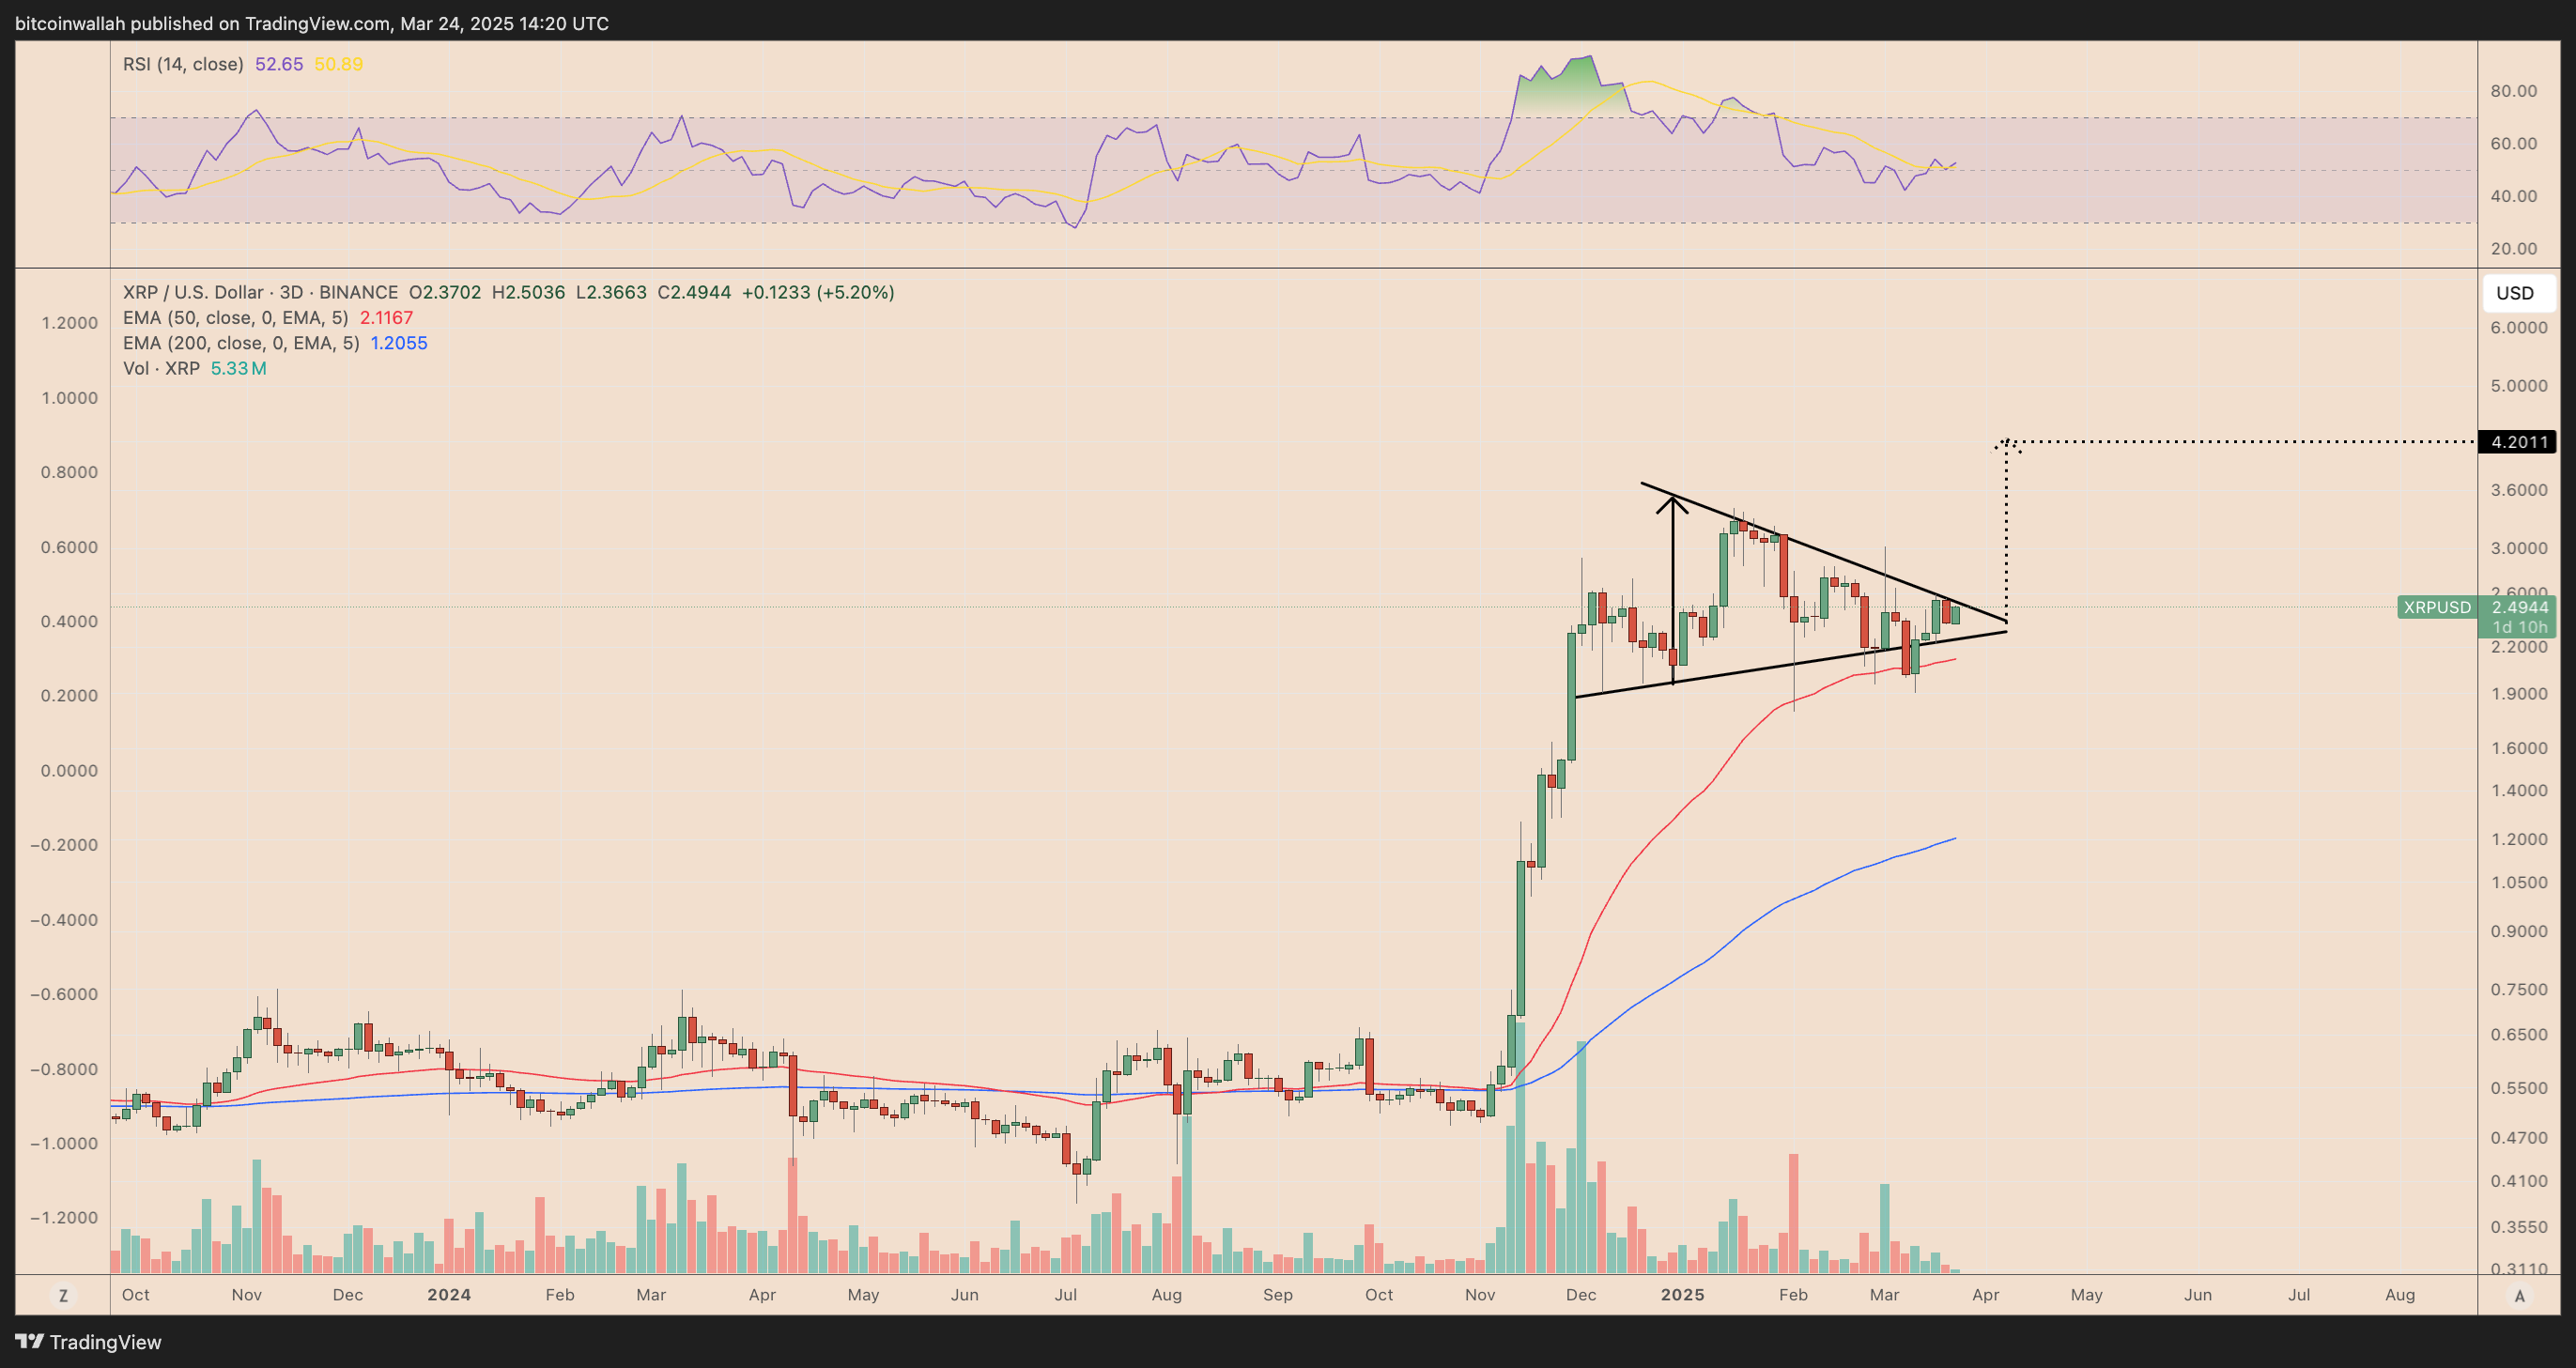
XRP/USD three-day price chart. Data from TradingView
-
The triangle pattern emerged after XRP’s remarkable 575% surge between November 2024 and January 2025, raising the chances of further price increases in the upcoming weeks.
-
A breakout above the upper trendline of the triangle could propel XRP’s price to around $4.20—an estimated 70% gain from current levels—by May.
-
Analyst CrediBULL Crypto also implies that XRP may be gearing up for a new all-time high above $3.40 in the near future.
XRP liquidation heatmap indicates targets of $2.66 to $2.98
The liquidation heatmap for XRP/USDT on Binance highlights crucial liquidity areas where significant liquidation events might happen. These levels serve as magnet zones that influence price direction based on liquidity amounts present.
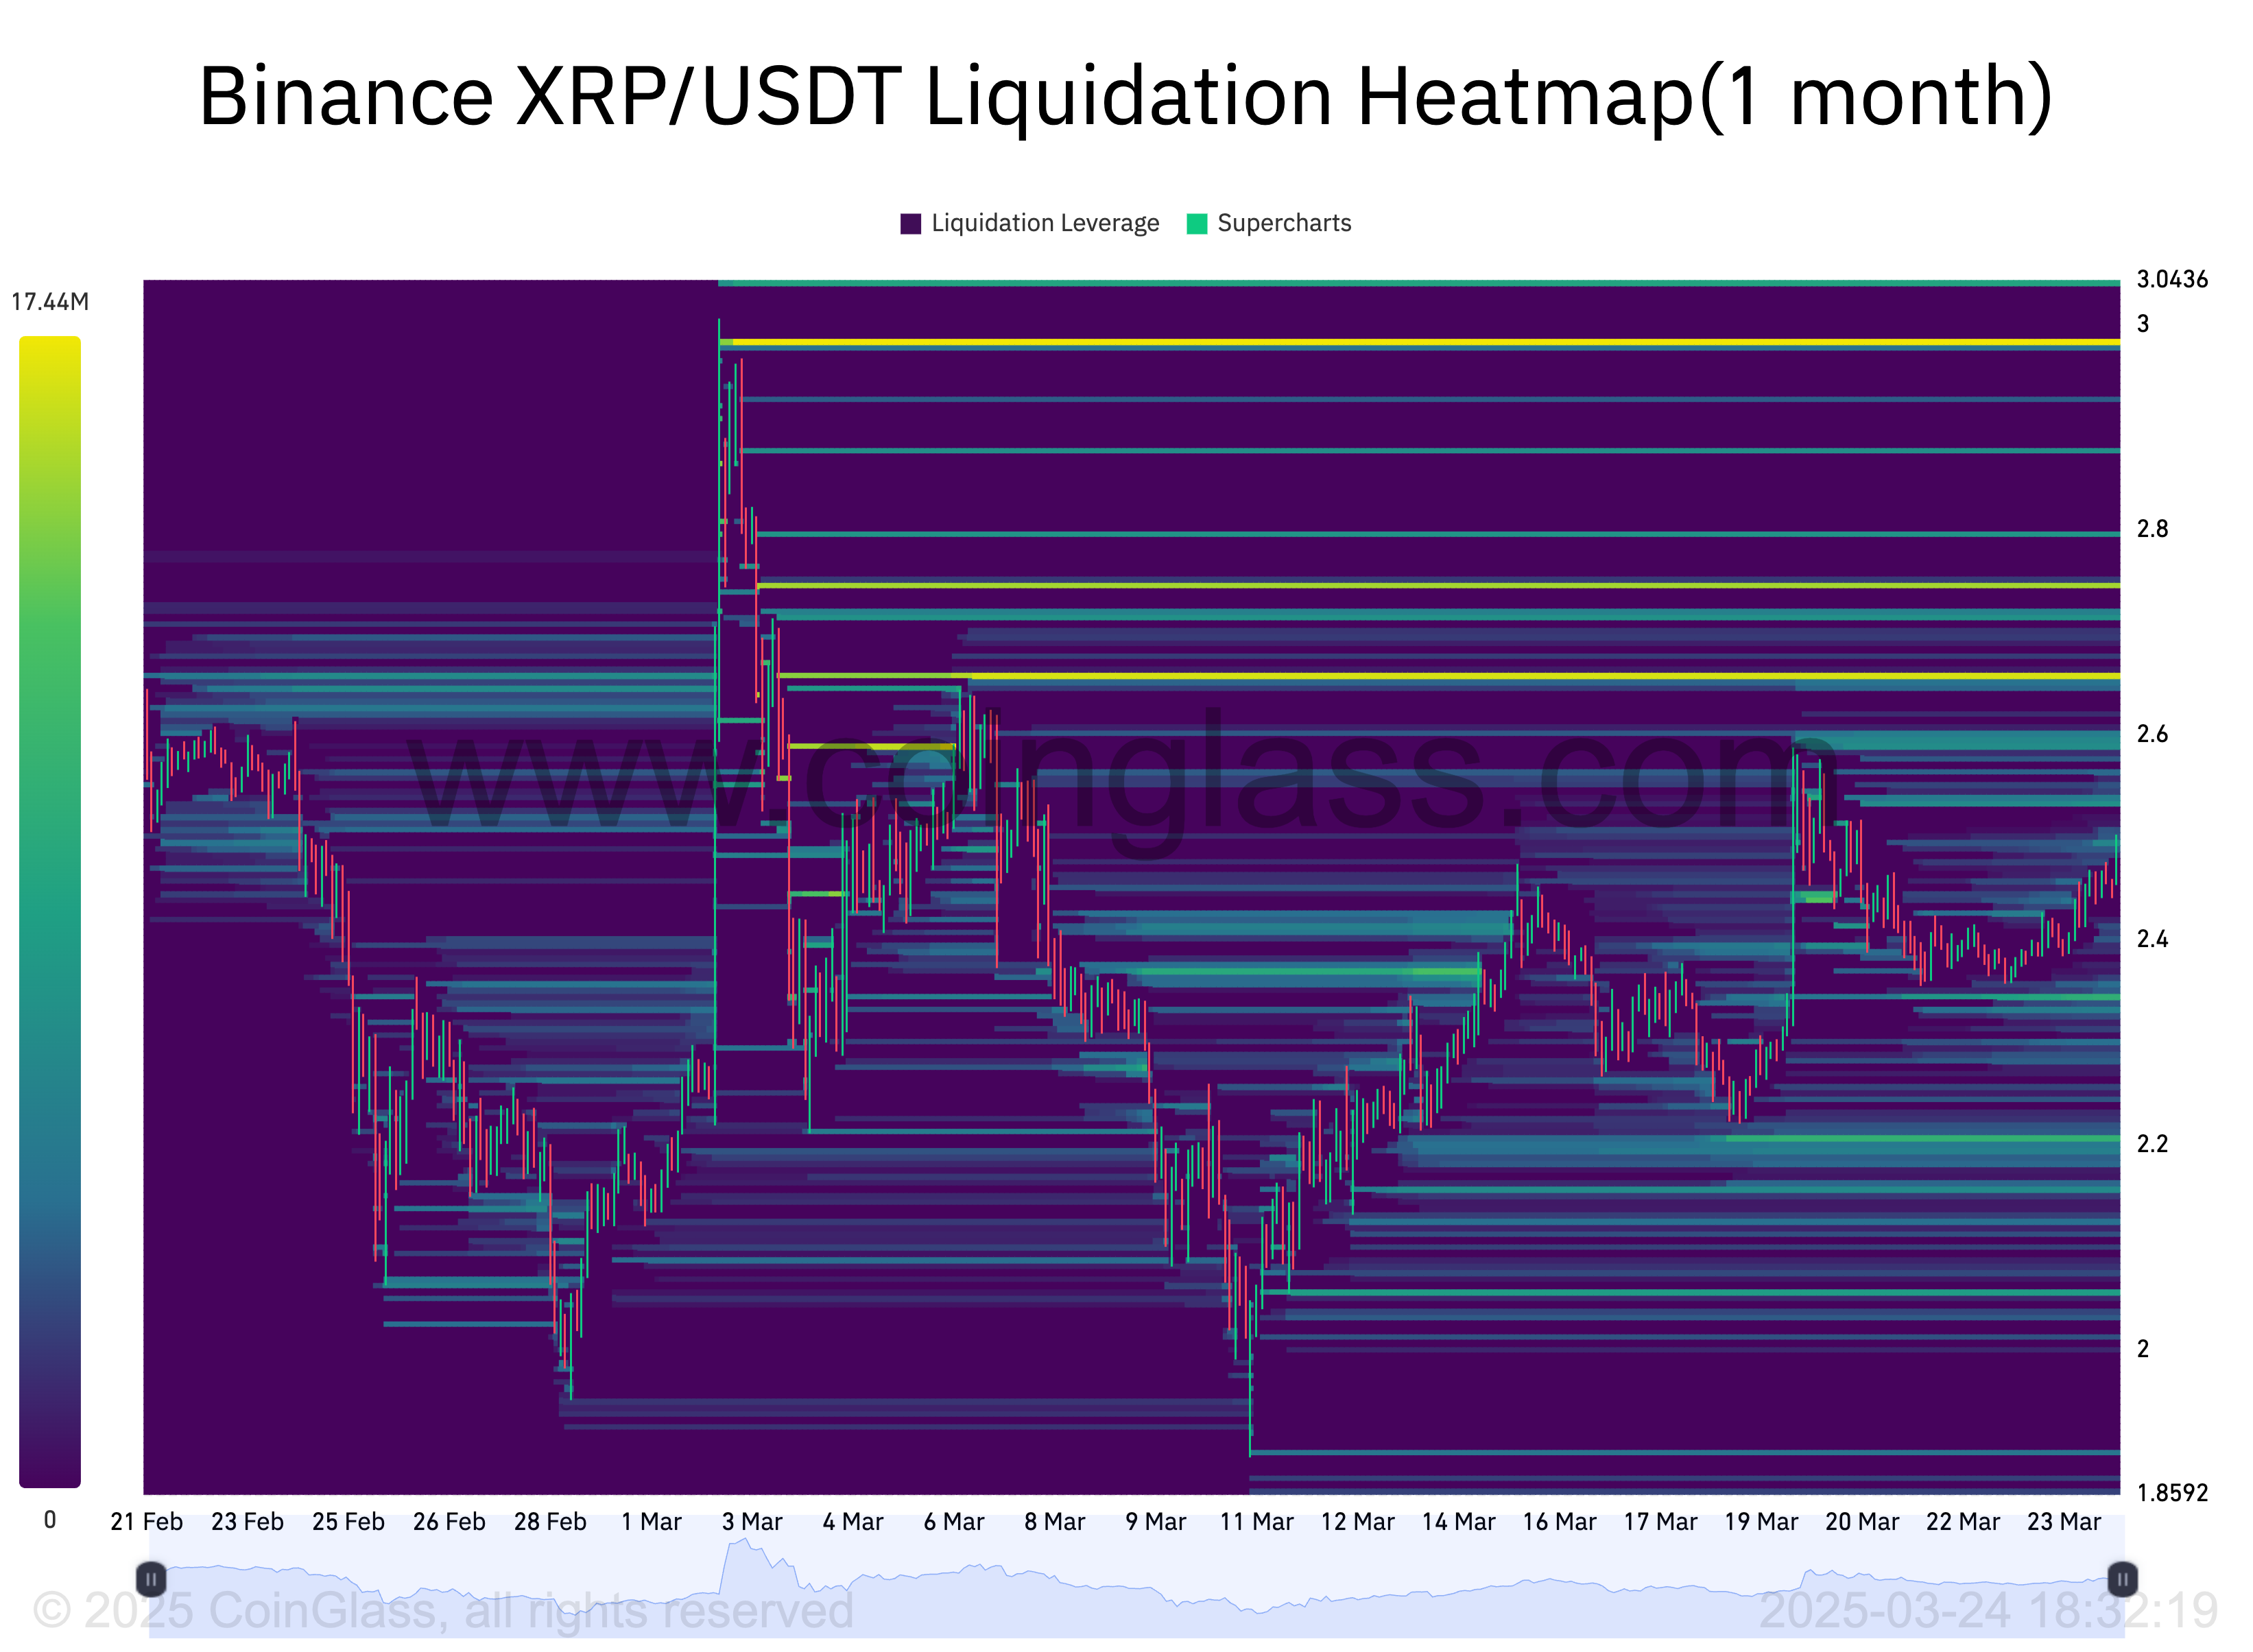
XRP/USDT one-month liquidation heatmap (Binance). Data from Coinglass
Important insights include:
-
A significant number of liquidations are concentrated near $2.66, with the highlighted area indicating a cluster of leveraged positions, marking it as a vital resistance point.
-
If the $2.66 level is breached, it could trigger a liquidation squeeze, forcing short sellers to cover their positions, potentially driving prices up to $2.98, the next major liquidity cluster.
This article does not provide investment advice or recommendations. Every investment and trading action carries risk, and readers should conduct their own research before making any decisions.