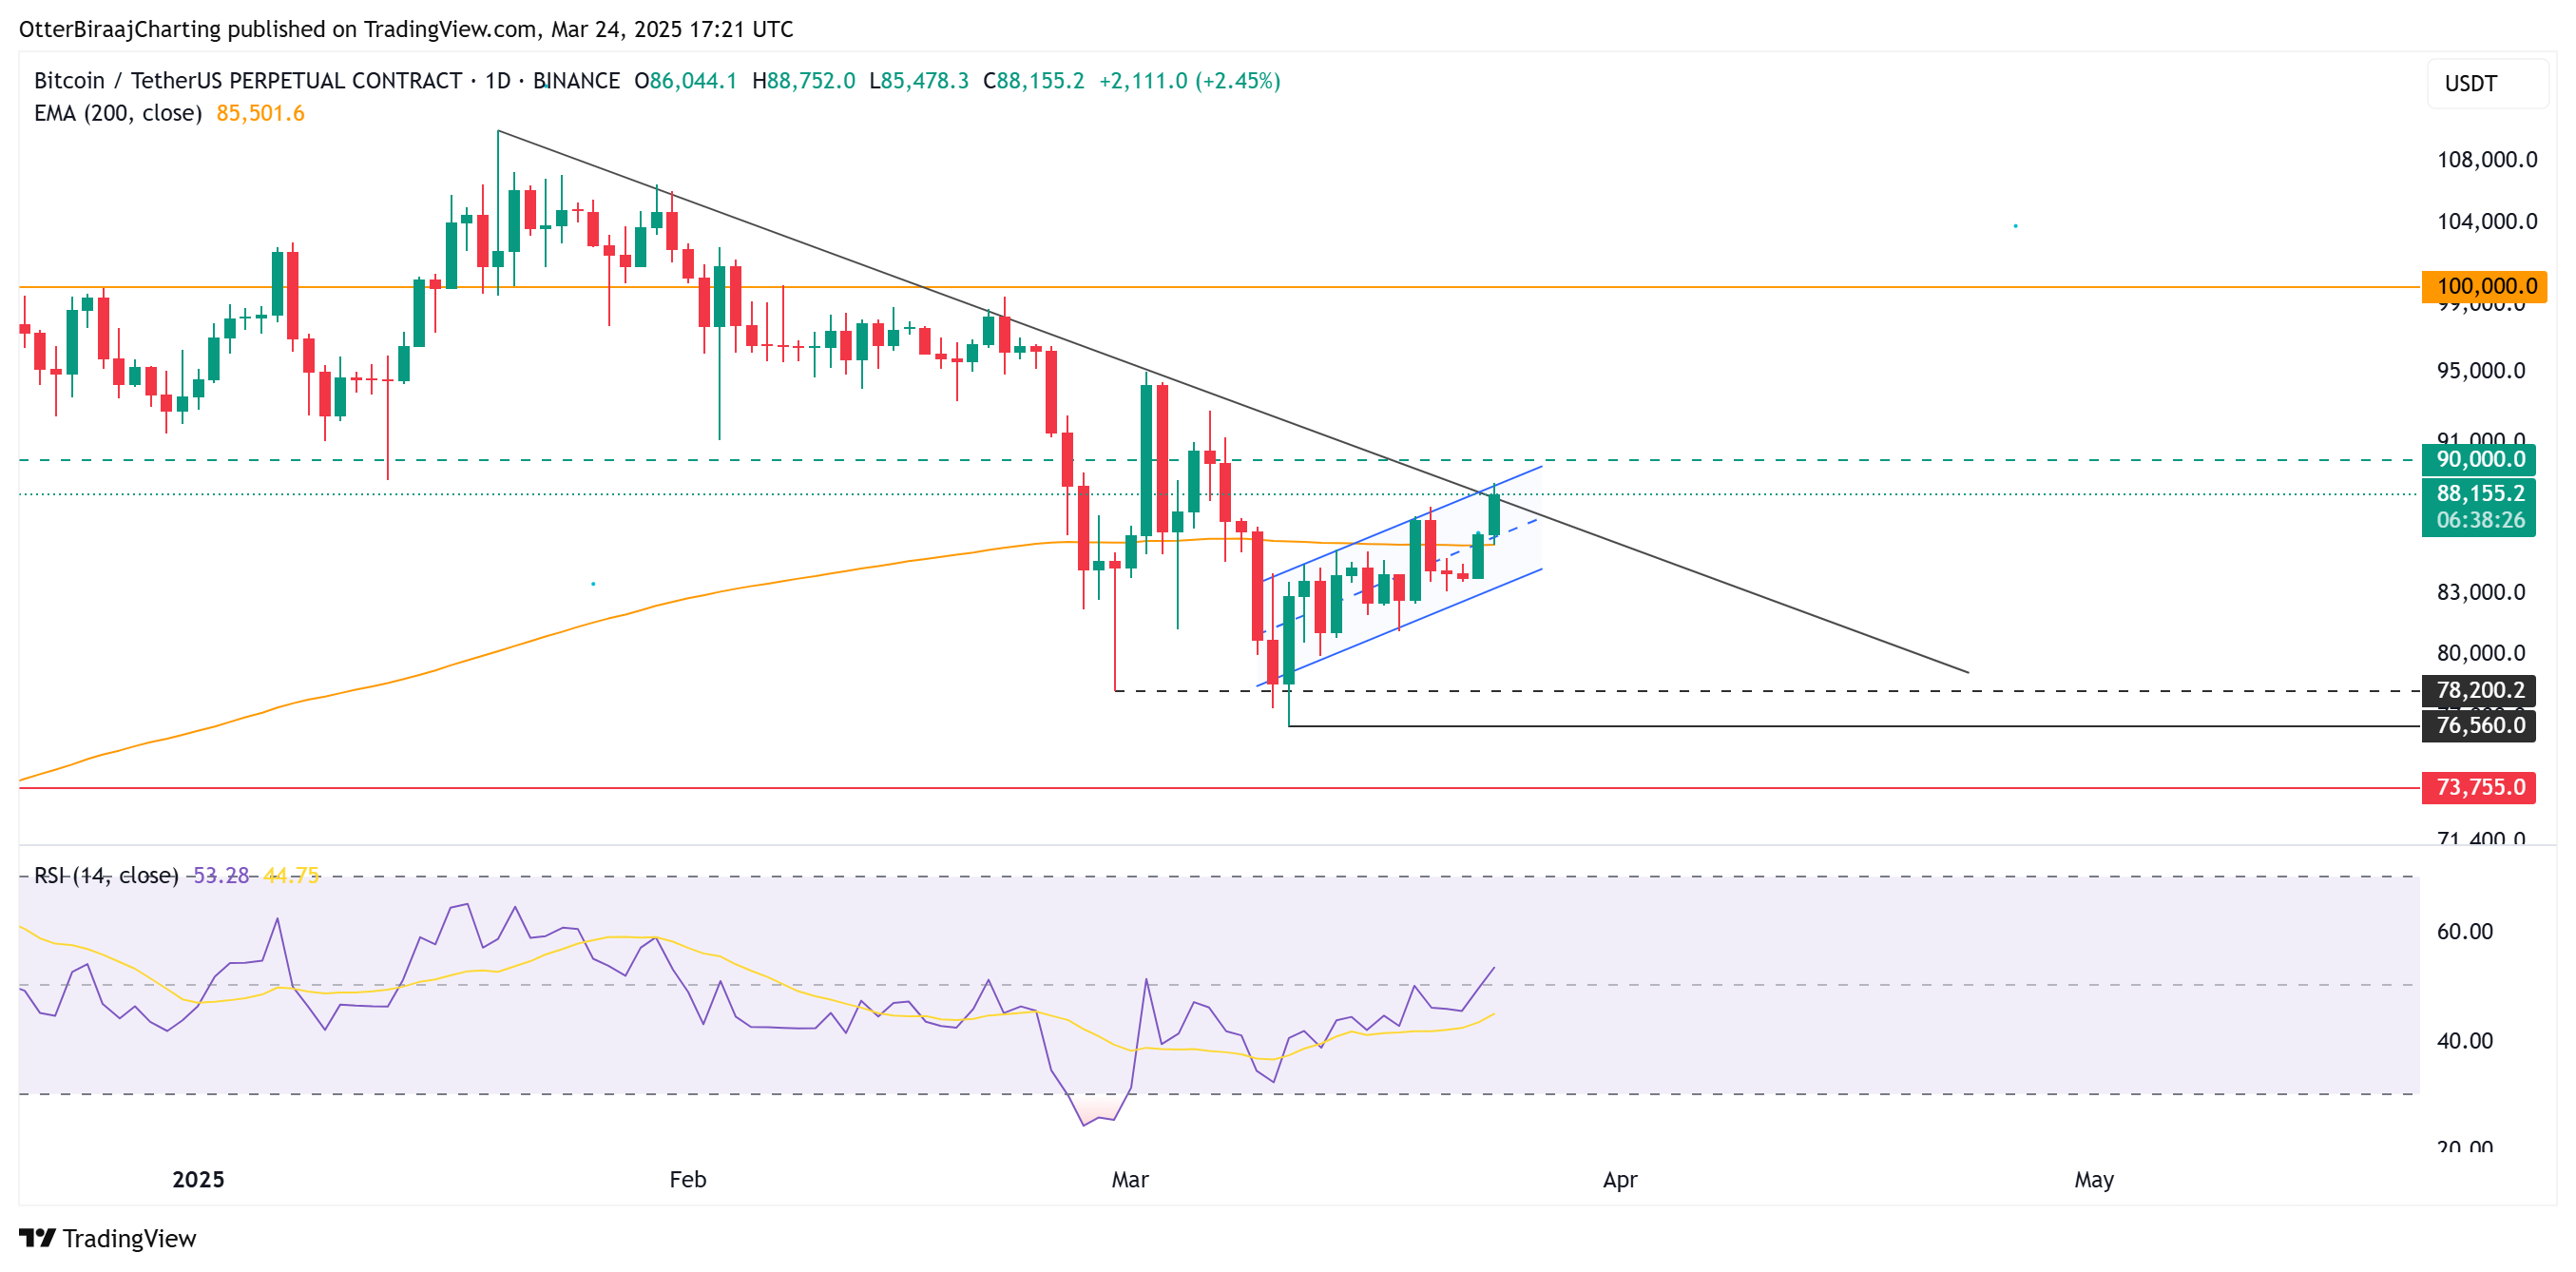
Bitcoin (BTC) achieved its strongest weekly performance in more than two months, rising 4.24% and reaching an intraday high of $88,804. The cryptocurrency also reestablished a bullish trend on the charts, closing above the 200-day exponential moving average (EMA) on the daily chart.

Bitcoin 1-day chart.
With a weekly close above $84,600, the chances of BTC testing the $90,000 mark increase. However, for BTC to make a sustainable leap at the upper range, it must break through the descending resistance level.
Bitcoin correction viewed as a “healthy pause”
A Bitcoin researcher indicated that current onchain metrics suggest the present price cycle represents a healthy consolidation, rather than signaling the onset of a bear market. It was pointed out that BTC has not reached an “overheated” state in this cycle as indicated by the Investor Price Model.
This model provided sell signals twice during 2021 and takes into account realized cap, thermo cap, investor price, and Bitcoin supply.
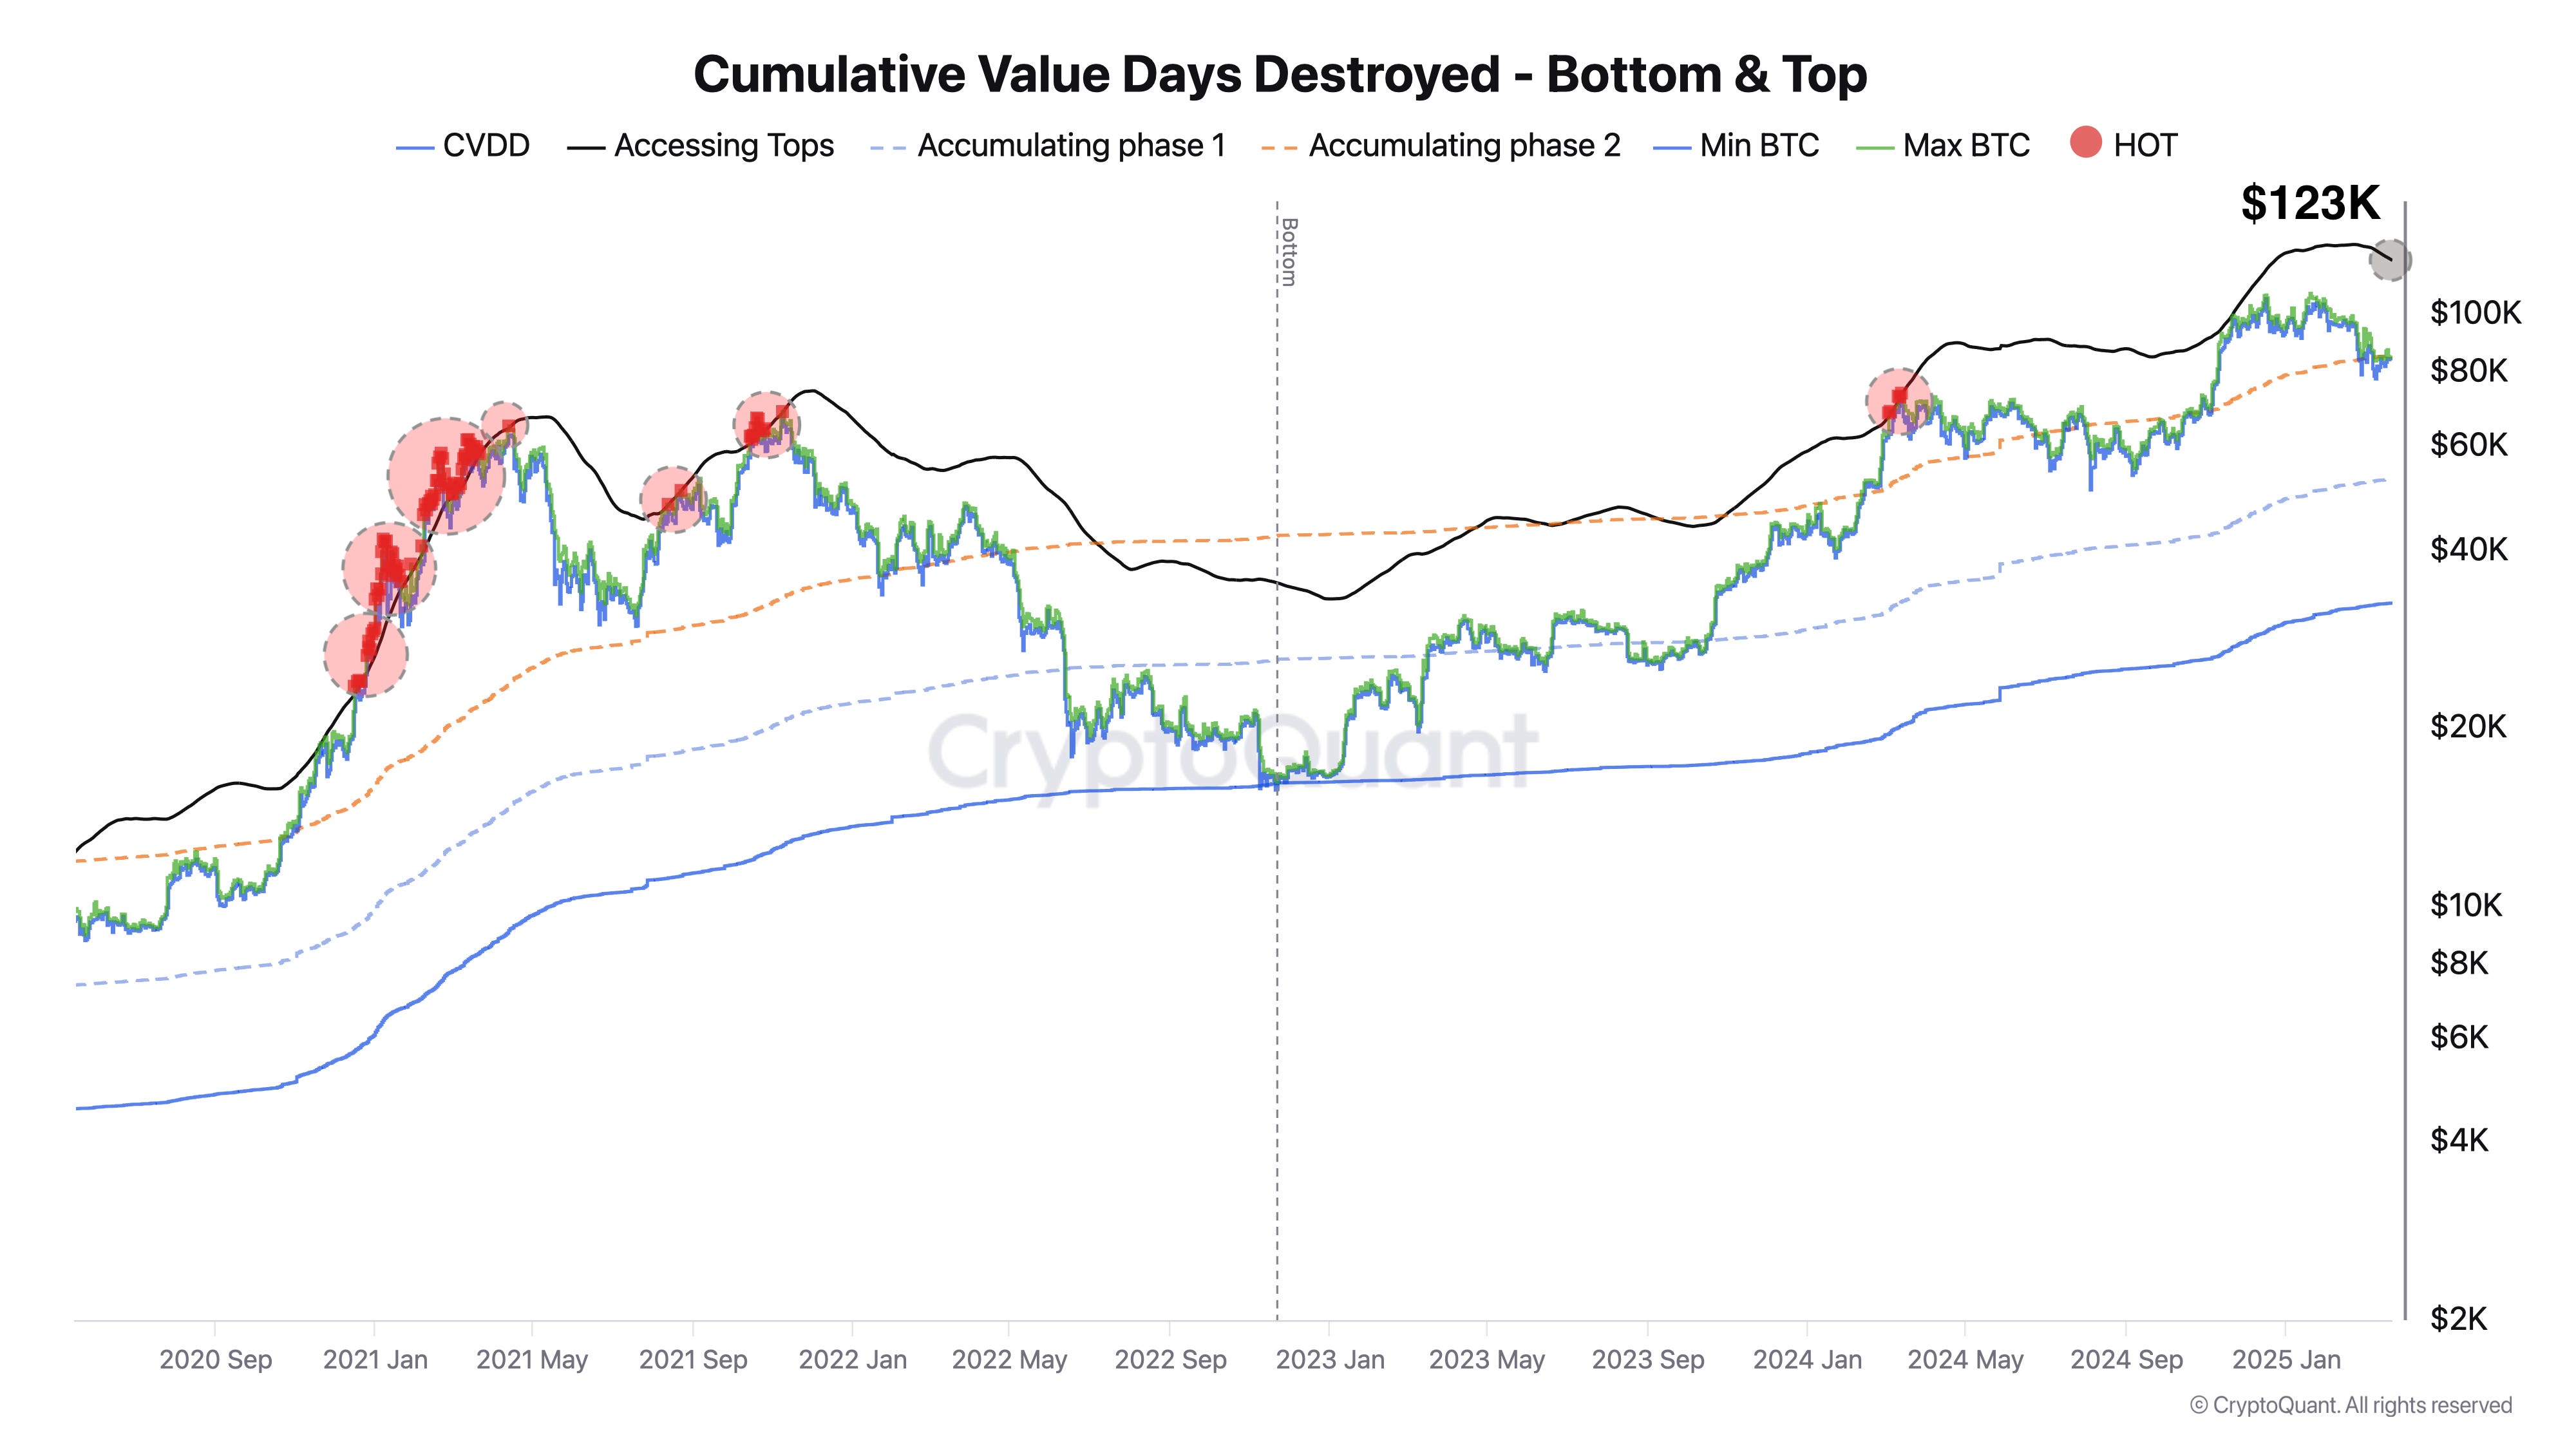
Using Bitcoin’s cumulative value days destroyed (CVDD), the researcher argued that the market is still in a “growth phase.”

Bitcoin cumulative value days.
The CVDD metric tracks the selling behavior of long-term holders. The current bull cycle (2024-2025) triggered a sell signal only once, back in March 2024. Based on this analysis, it was suggested that seasoned investors might take profits once Bitcoin surpasses key peak levels ($123K), which could put downward pressure on the price.
The researcher forecasted that Bitcoin might rise to $130,000 within 90 days.
Related: Bitcoin must reclaim this key 2025 level to avoid new lows — Research
Bitcoin open interest surges by $1.5 billion in one day
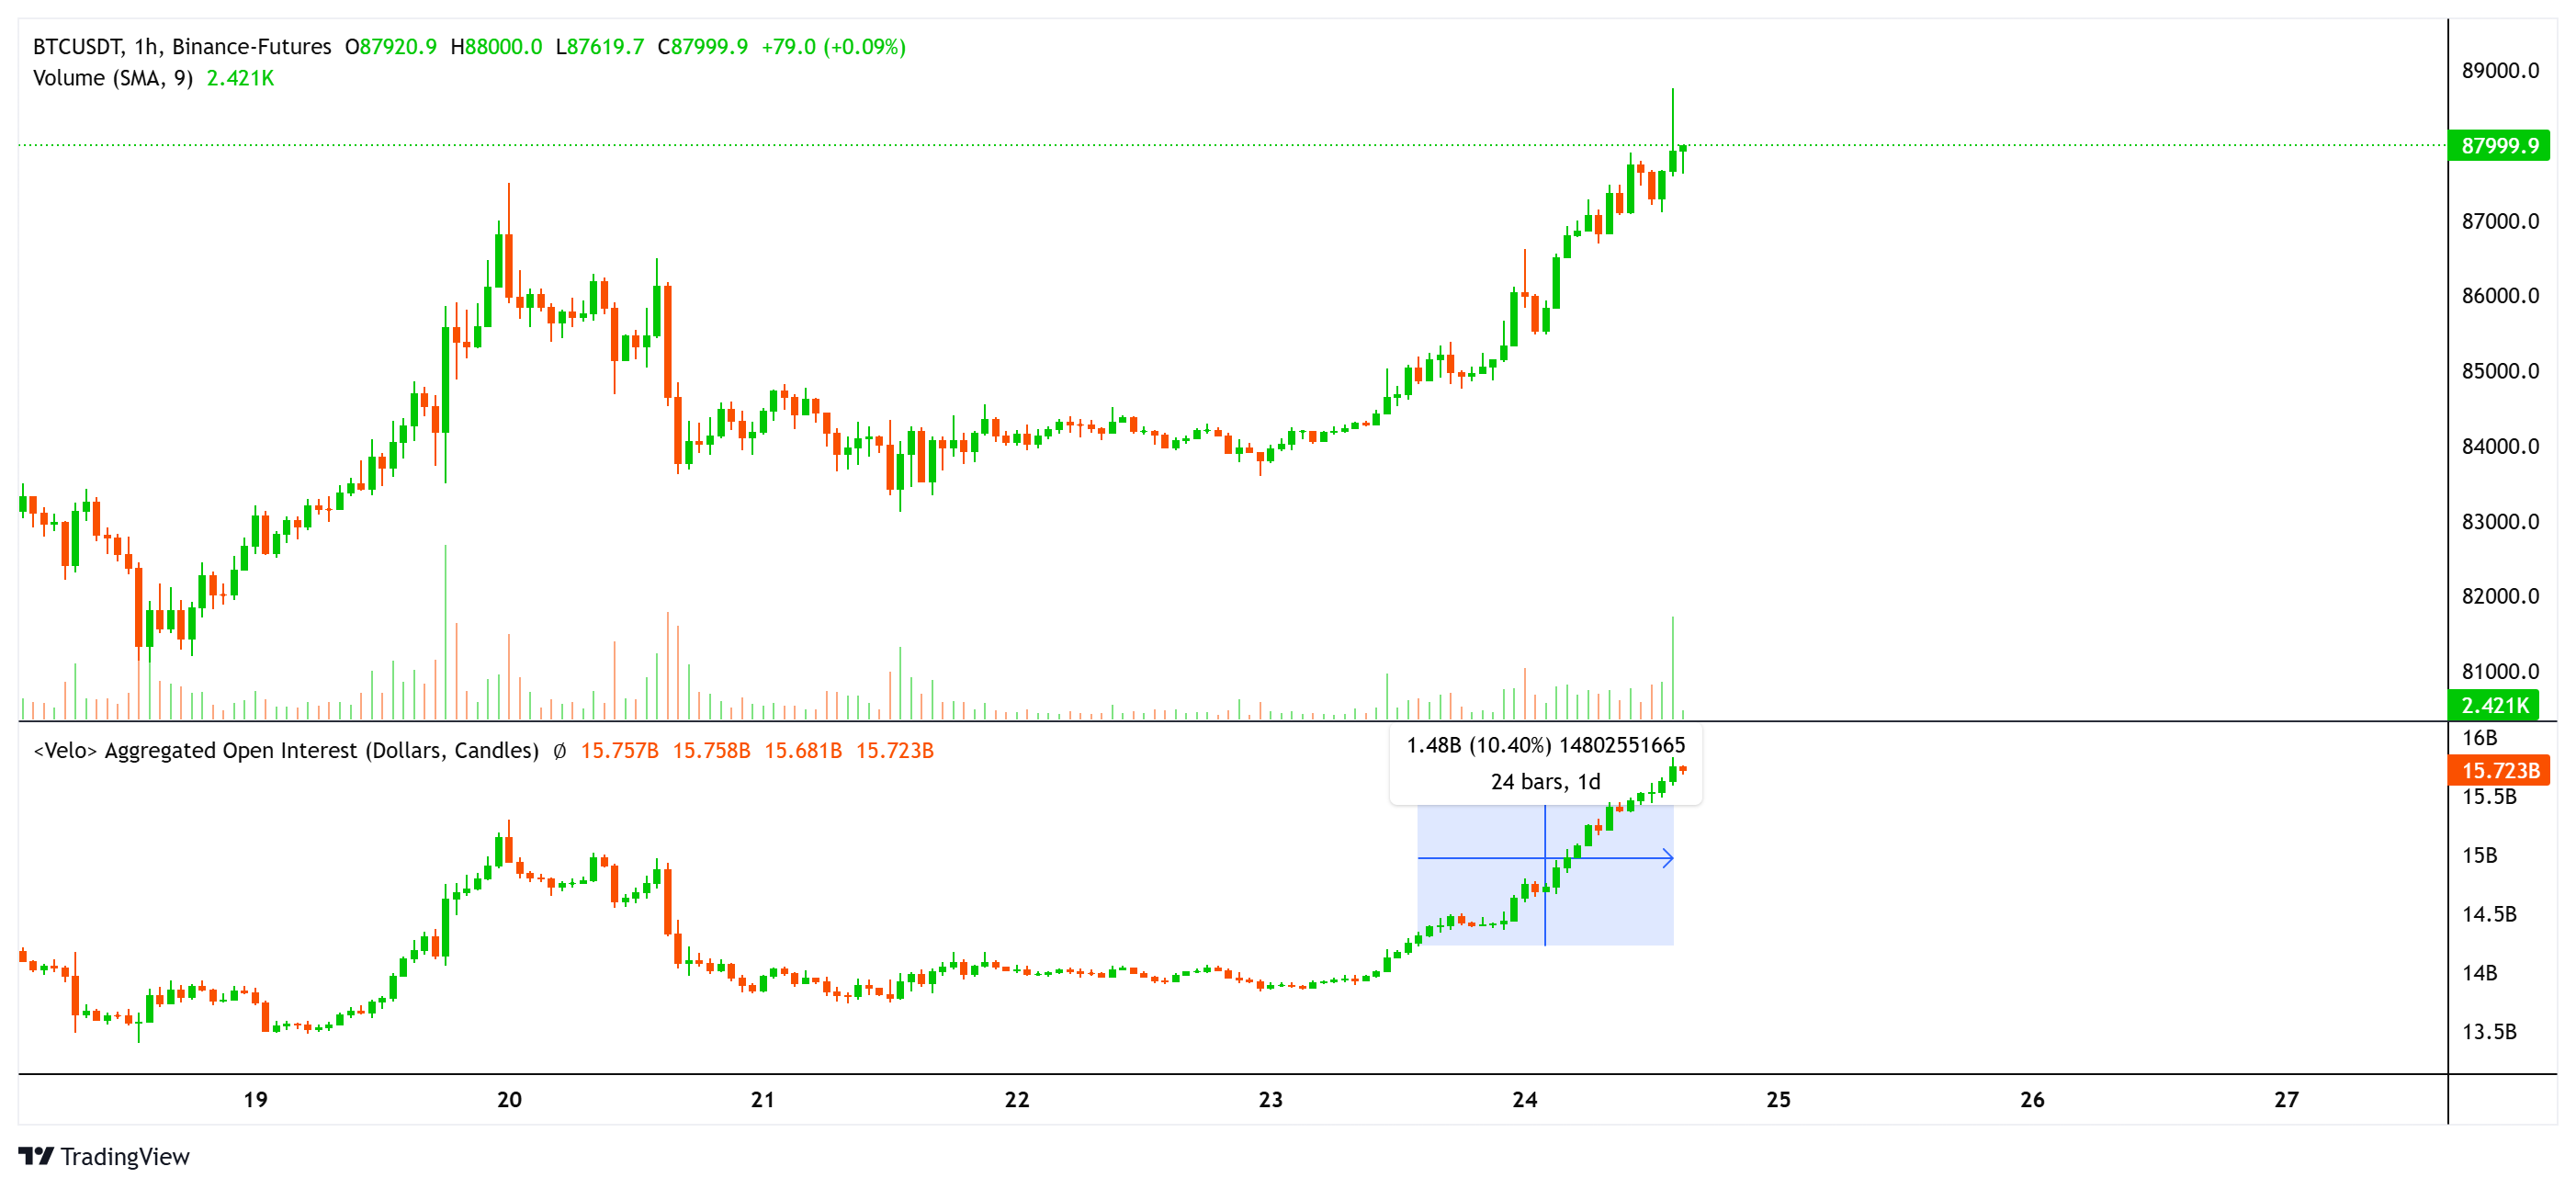
Recent data shows that Bitcoin’s open interest (OI), which indicates the total value of open futures contracts, surged by over $1.5 billion in just 24 hours.
At the same time, the funding rate, which reflects the cost of maintaining leveraged positions, remained close to neutral, indicating that neither bullish (long) nor bearish (short) traders held a dominant position.

Bitcoin price and aggregated open interest.
Bitcoin saw a surge in upward momentum late on Sunday, March 23rd. Price rallies over the weekend often occur amid lower trading volumes, as larger market players typically step back until the week begins. In this scenario, leveraged trades can significantly influence price fluctuations.
An anonymous crypto analyst highlighted the rise in OI after Bitcoin surpassed $87,500 but cautioned,
“But here’s the catch: High OI + Rapid Price Increase = Risk of Liquidation Cascades!”

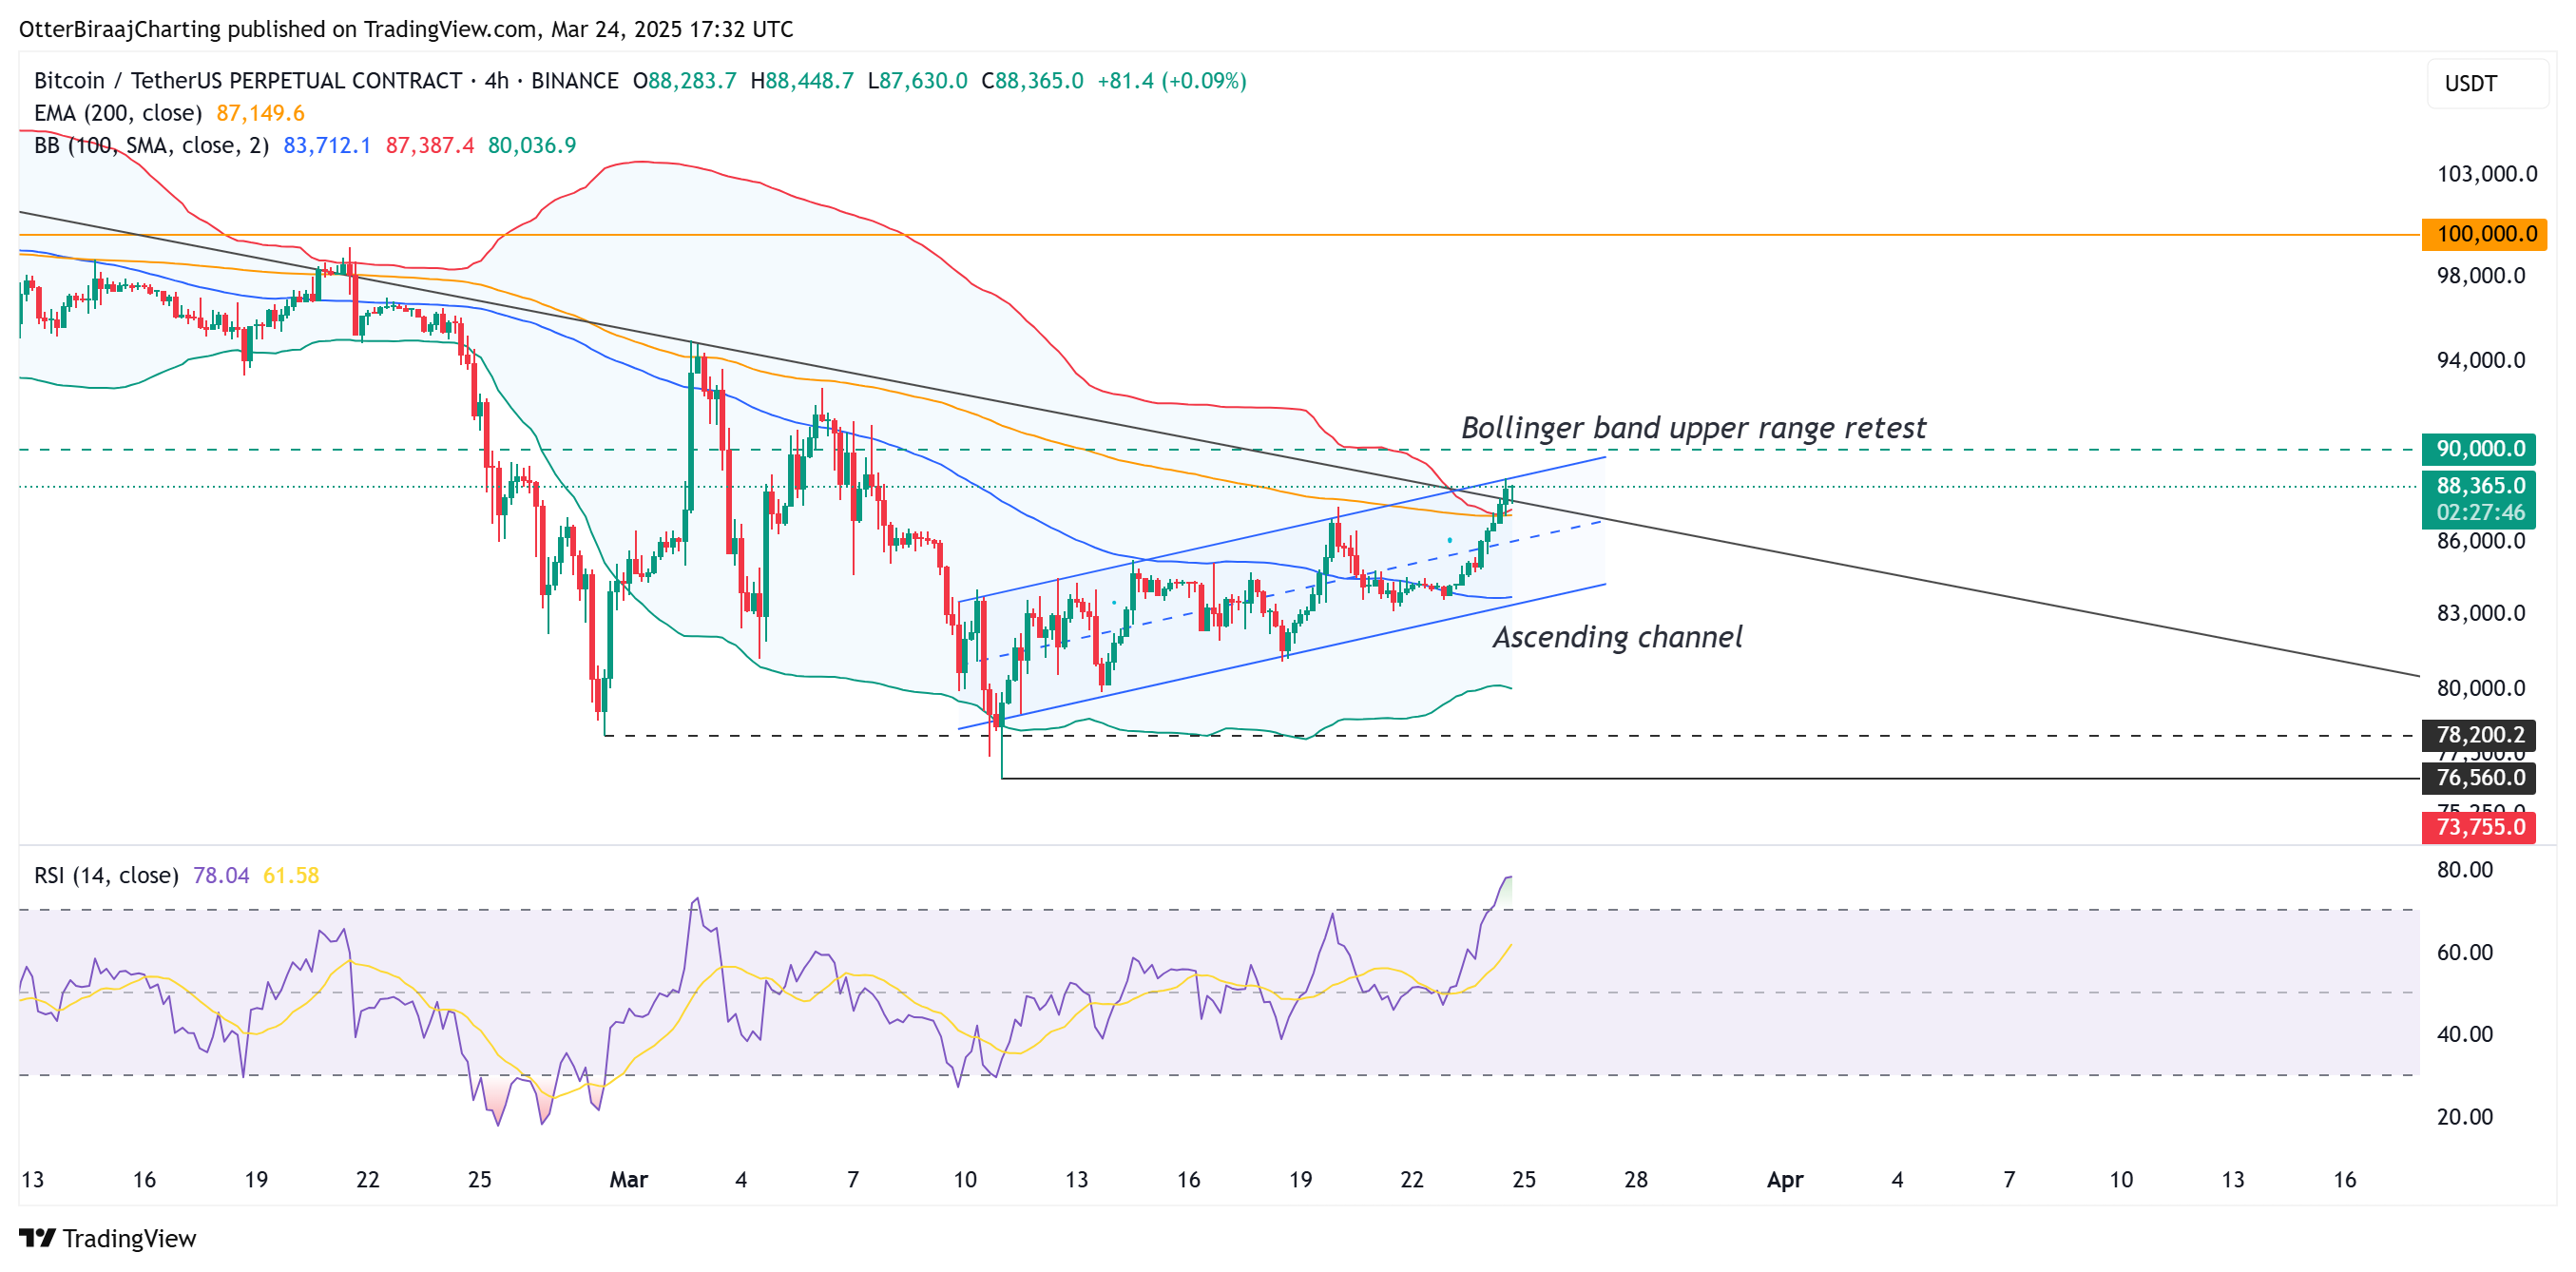
Bitcoin 4-hour chart.
From a technical viewpoint, Bitcoin reached a new high of $88,750, surpassing the previous week’s peak. However, the chart indicated that the price tested the upper Bollinger Band, alongside a descending resistance. Furthermore, BTC appears to be fluctuating within an ascending channel.
Given these factors, it is possible that BTC might experience a short-term correction to test the demand zone around $86,000-$87,000 before breaking past the $90,000 mark.
Related: Michael Saylor’s Strategy surpasses 500,000 Bitcoin with latest purchase
This article does not offer investment advice or recommendations. Every investment and trading decision carries risks, and readers should conduct their own research before making choices.
