Traders in Bitcoin (BTC) are in high spirits as a significant price metric has once again turned bullish.
The widely recognized Hash Ribbon indicator, developed by a quantitative fund focused on Bitcoin and digital assets, has issued its first buy signal in a broader bullish context.
Hash Ribbon sets $100,000 BTC price target for Q2
Bitcoin miners appear poised for recovery as the Hash Ribbon suggests the conclusion of their most recent “capitulation” phase.
This tool monitors potential long-term buying opportunities based on hashrate; when miner profitability declines and participants exit the network, it signifies capitulation, leading to eventual price recoveries.
The indicator employs two moving averages related to hashrate: the 30-day and the 60-day averages. Capitulations occur when the 30-day average falls below the 60-day, while buy signals manifest when the latter crosses above the former.
Data indicates that the latest buy signal from the Hash Ribbon was noted on March 24 and is evident on both daily and weekly charts.
“This is macro bullish,” shared trader Titan of Crypto on social media.
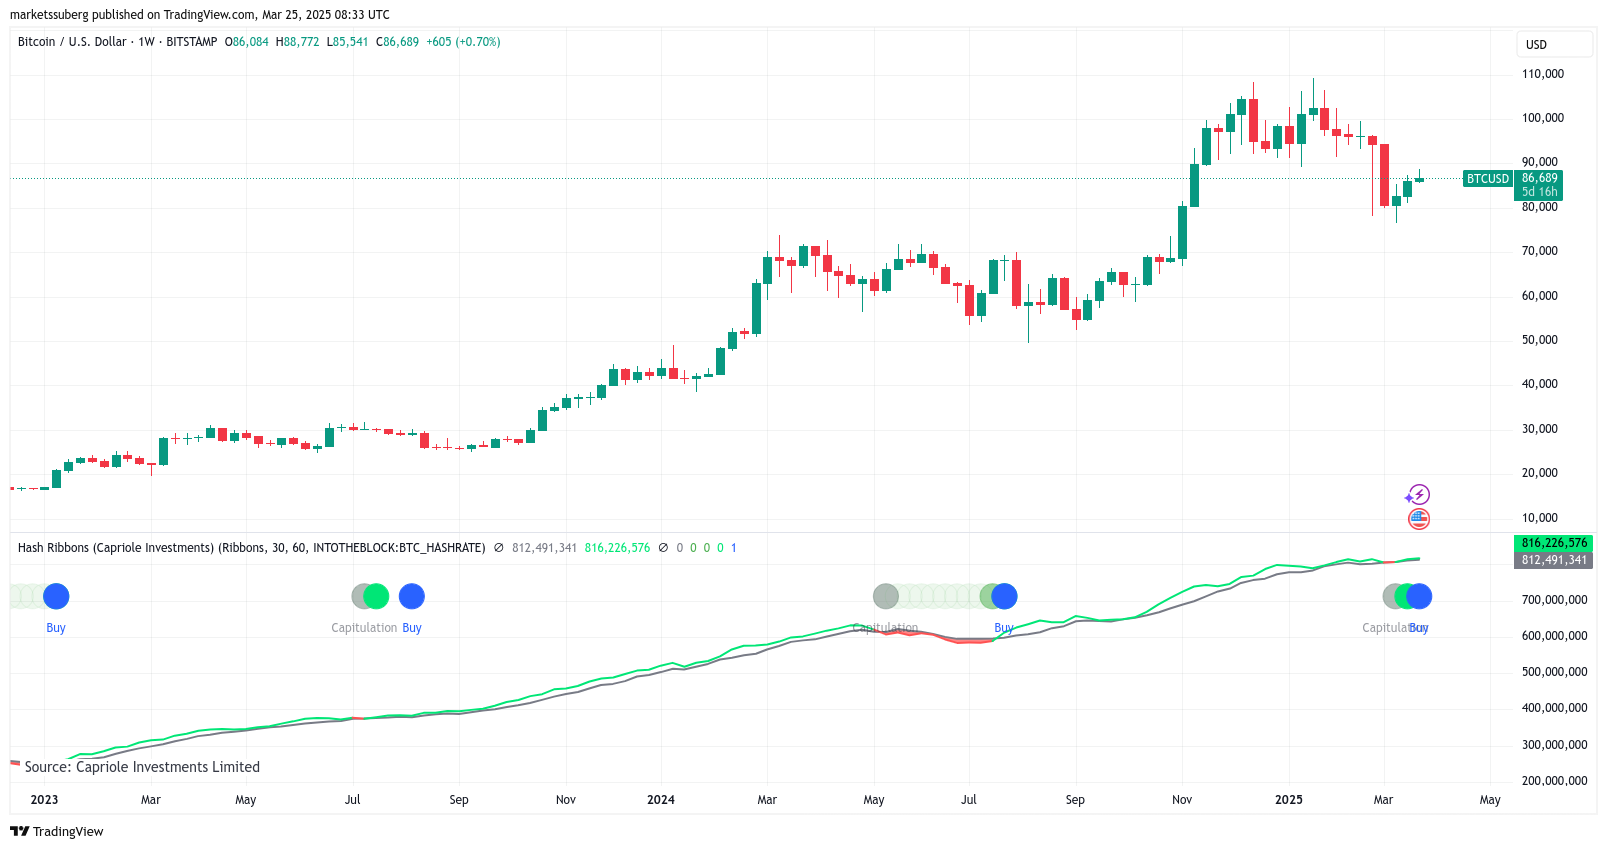
BTC/USD 1-week chart featuring Hash Ribbon data.
The previous buy signal from the Hash Ribbon appeared in July 2024. At that time, BTC/USD had not yet reached its lowest point, with months passing before any substantial upward movement commenced.
A similar situation unfolded following a buy signal in August 2023.
Optimism surrounding this recent development was palpable after a largely disappointing Q1 2025 in terms of BTC price performance.
“One of the most reliable mid-term indicators is now bullish,” added fellow trader Robert Mercer.
“I expect $BTC to rise above $100,000 in Q2 of 2025!”
Bitcoin concludes its “multimonth RSI downtrend”
As reported earlier, Bitcoin is starting to hint at a bullish turnaround as March approaches its end.
Related:Bitcoin must reclaim this critical level in 2025 to avoid hitting new lows — Analysis
A key indicator of this shift is the relative strength index (RSI), which, like the Hash Ribbon, is in the process of recovering after a prolonged period of suppression.
On weekly charts, the RSI has confirmed a bullish divergence for the first time since September, with daily charts indicating a support retest following a breakout from a downward trend line established since November.
“The multimonth RSI downtrend is over,” confirmed trader and analyst Rekt Capital to their followers this week.
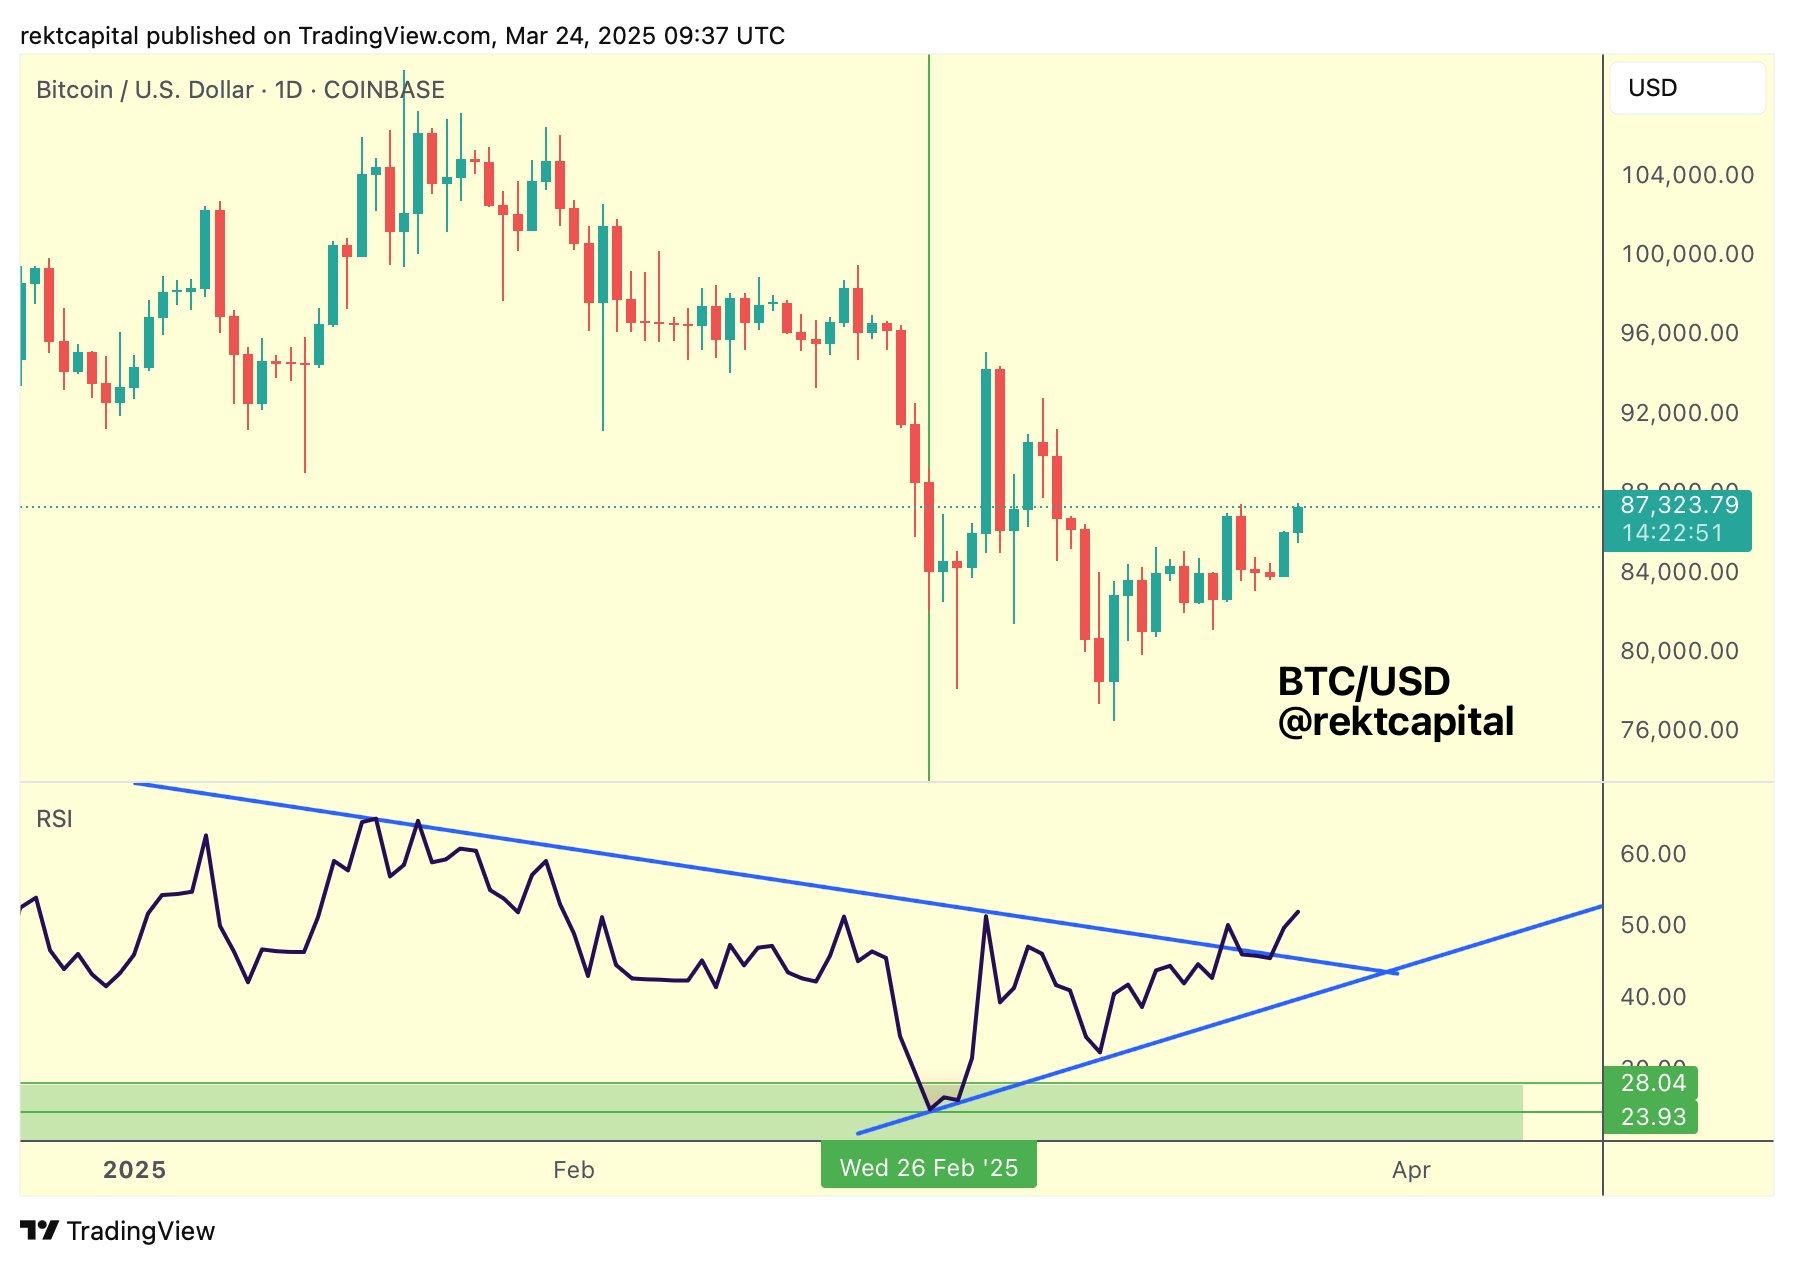
BTC/USD 1-day chart displaying RSI data.
This article does not offer investment advice or recommendations. Every investment and trading decision carries risk, and readers should carry out their own research before making choices.