“You’re not optimistic enough!” a passionate supporter of XRP remarked on X last week following Ripple’s announcement that the U.S. Securities and Exchange Commission has dropped its lawsuit against the company, which uses the token for international transactions.
This sentiment is echoed by many, and it’s easy to see why. The end of this protracted legal dispute has lifted a significant burden that had been weighing on XRP’s performance compared to the wider market during the bullish phase of 2021. Additionally, there is growing excitement about the possibility of an XRP ETF and the token becoming part of the U.S. strategic reserve.
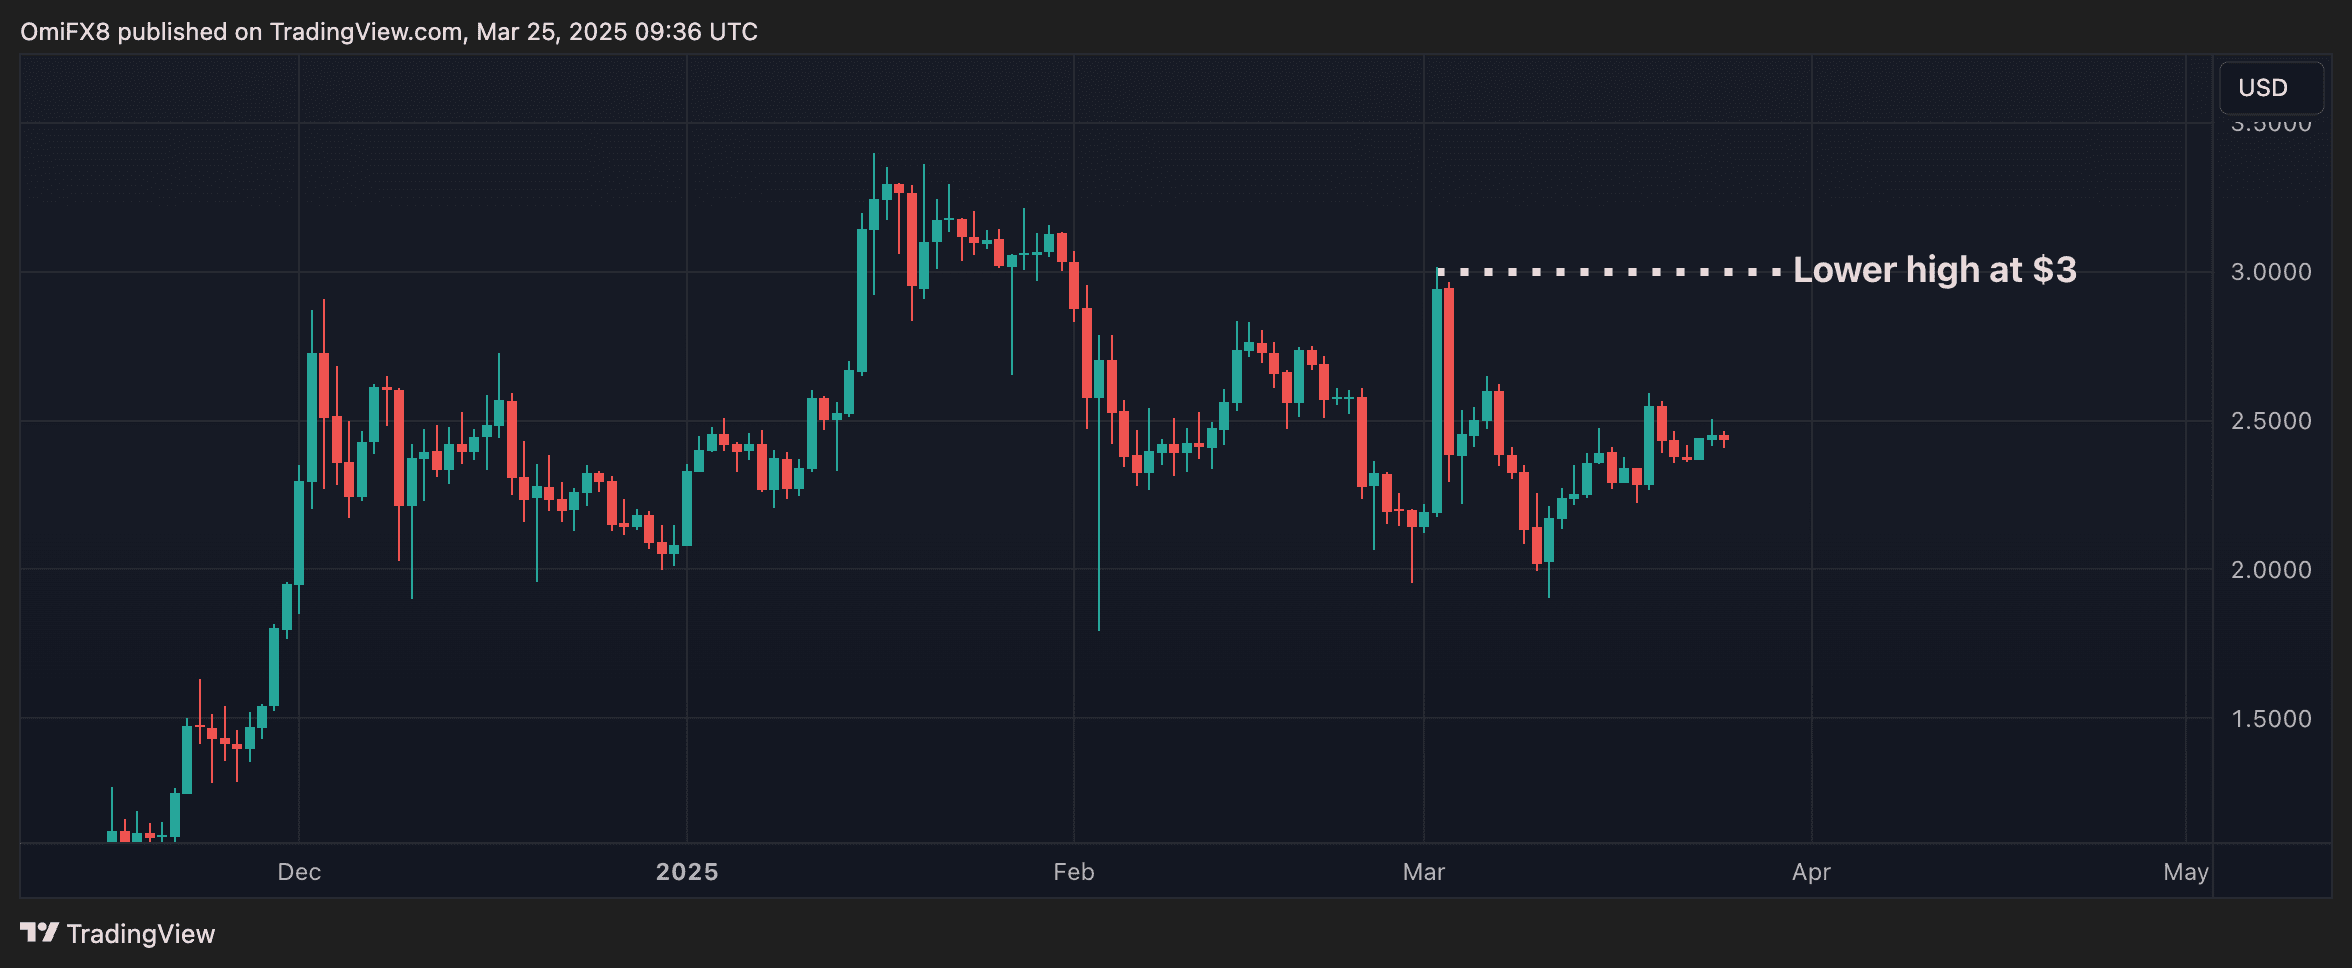
XRP experienced a rally of more than 11% to reach $2.59 last Wednesday in response to the SEC news. However, subsequent price action has been anything but encouraging, with prices trading within a range of $2.30 to $2.50, even amid expectations that new trade tariffs from President Donald Trump on April 2 could be less severe than initially thought.
Three-line break chart
The first indicator pointing towards a bearish trend reversal is the three-line break chart, which prioritizes price movements while filtering out short-term fluctuations. This approach aids in identifying trend shifts that reflect market conditions rather than relying on random or discretionary trading rules.
The chart is comprised of vertical blocks known as lines or bars (in green and red). A bullish reversal is indicated by a green bar when prices exceed the highest point of the last three red bars. Conversely, a bearish shift is shown by the appearance of a new red bar falling below the lowest point of the previous three green bars.
In the case of XRP, a new red bar appeared early this month on the weekly chart and has remained since the SEC announcement. The “weekly” nature of this chart means it aggregates price data over a week.
The emergence of this new red bar suggests a shift in momentum from bullish to bearish. Similar patterns have marked the starts of prolonged bear markets in 2021 and early 2018.
MACD
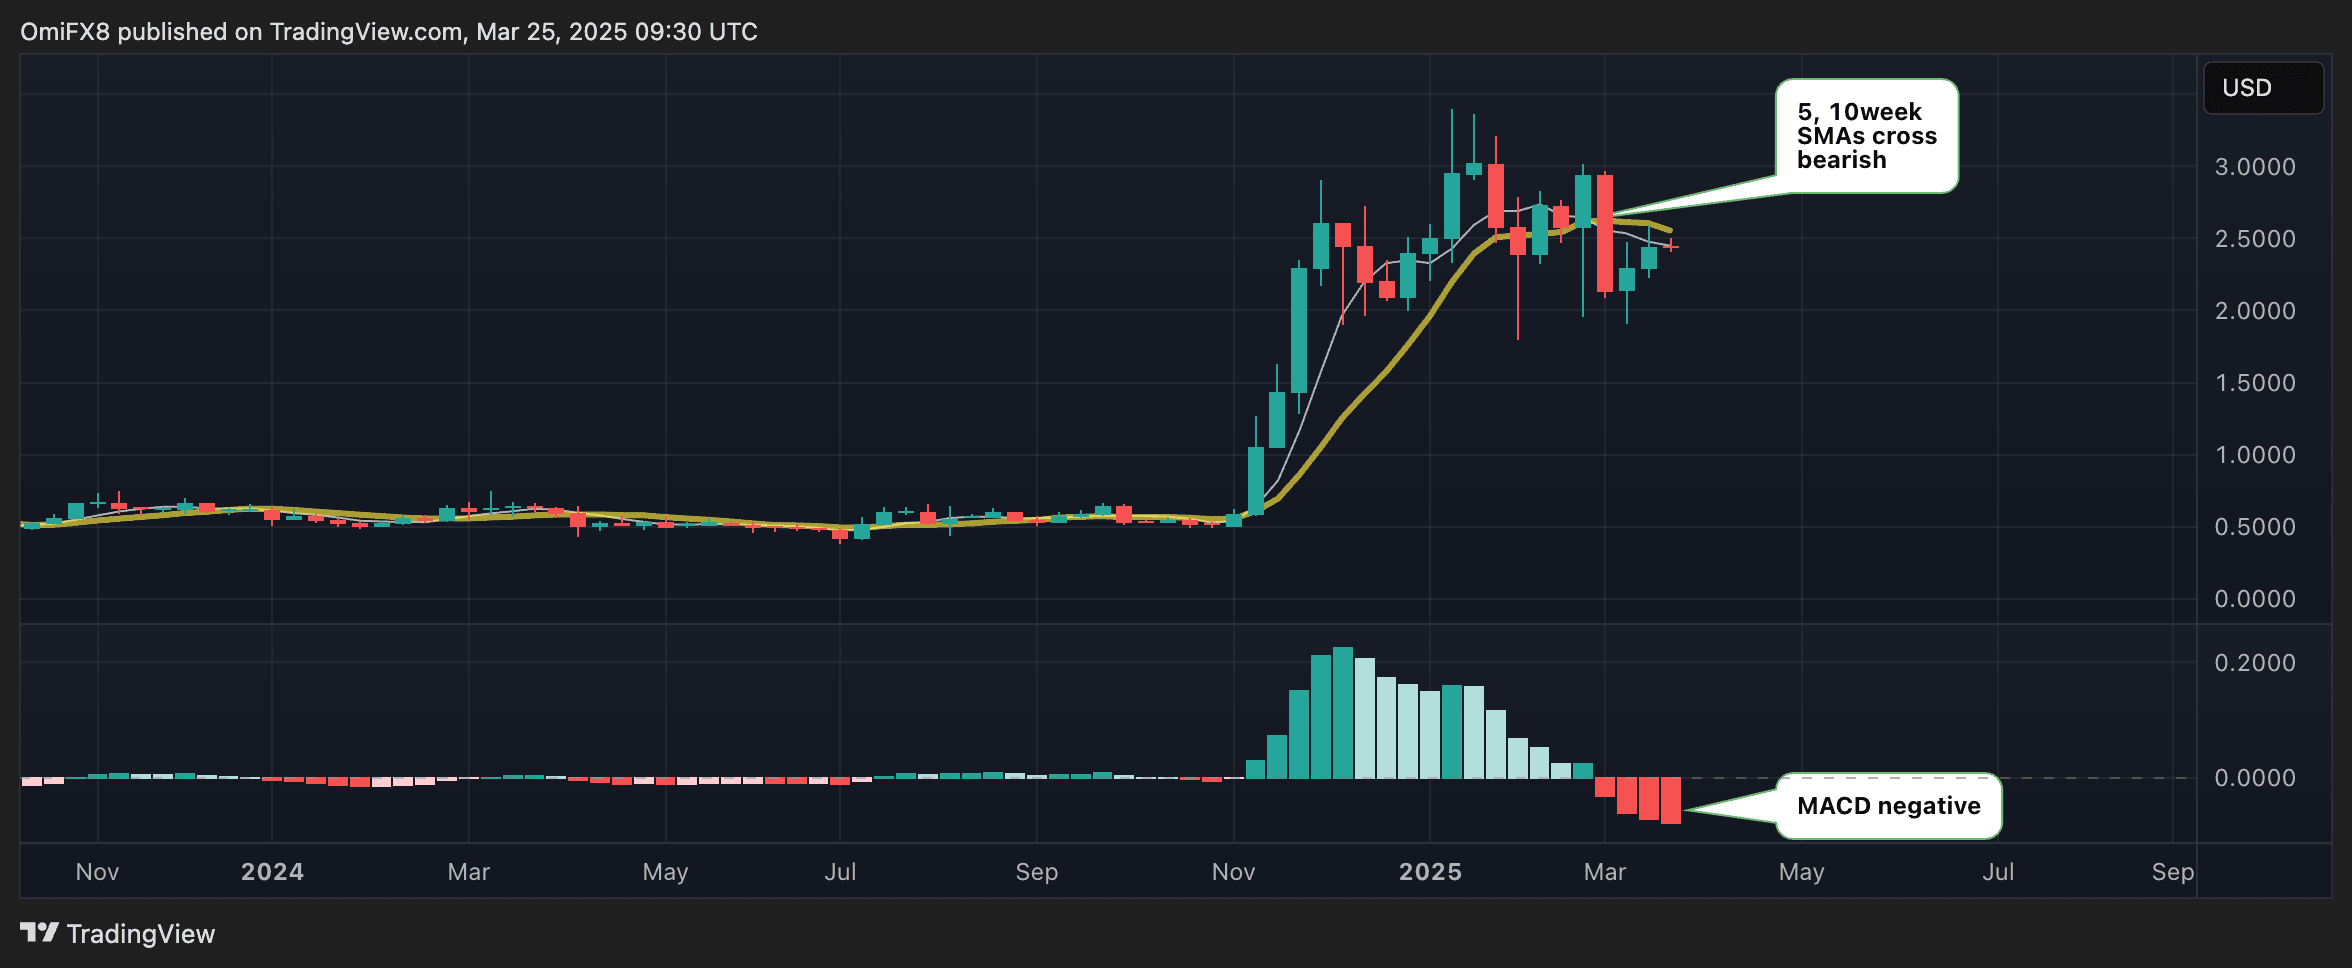
The moving average convergence divergence (MACD) histogram, a tool for assessing trend strength and shifts, is displaying increasingly deeper bars below the zero line on the weekly chart. This signals a strengthening of downward momentum.
This same indicator turned positive in November, leading to a price increase from $1 to over $3.
The 5- and 10-week simple moving averages (SMAs) have crossed into bearish territory as well, indicating that the path of least resistance is downwards.
Bollinger Bands
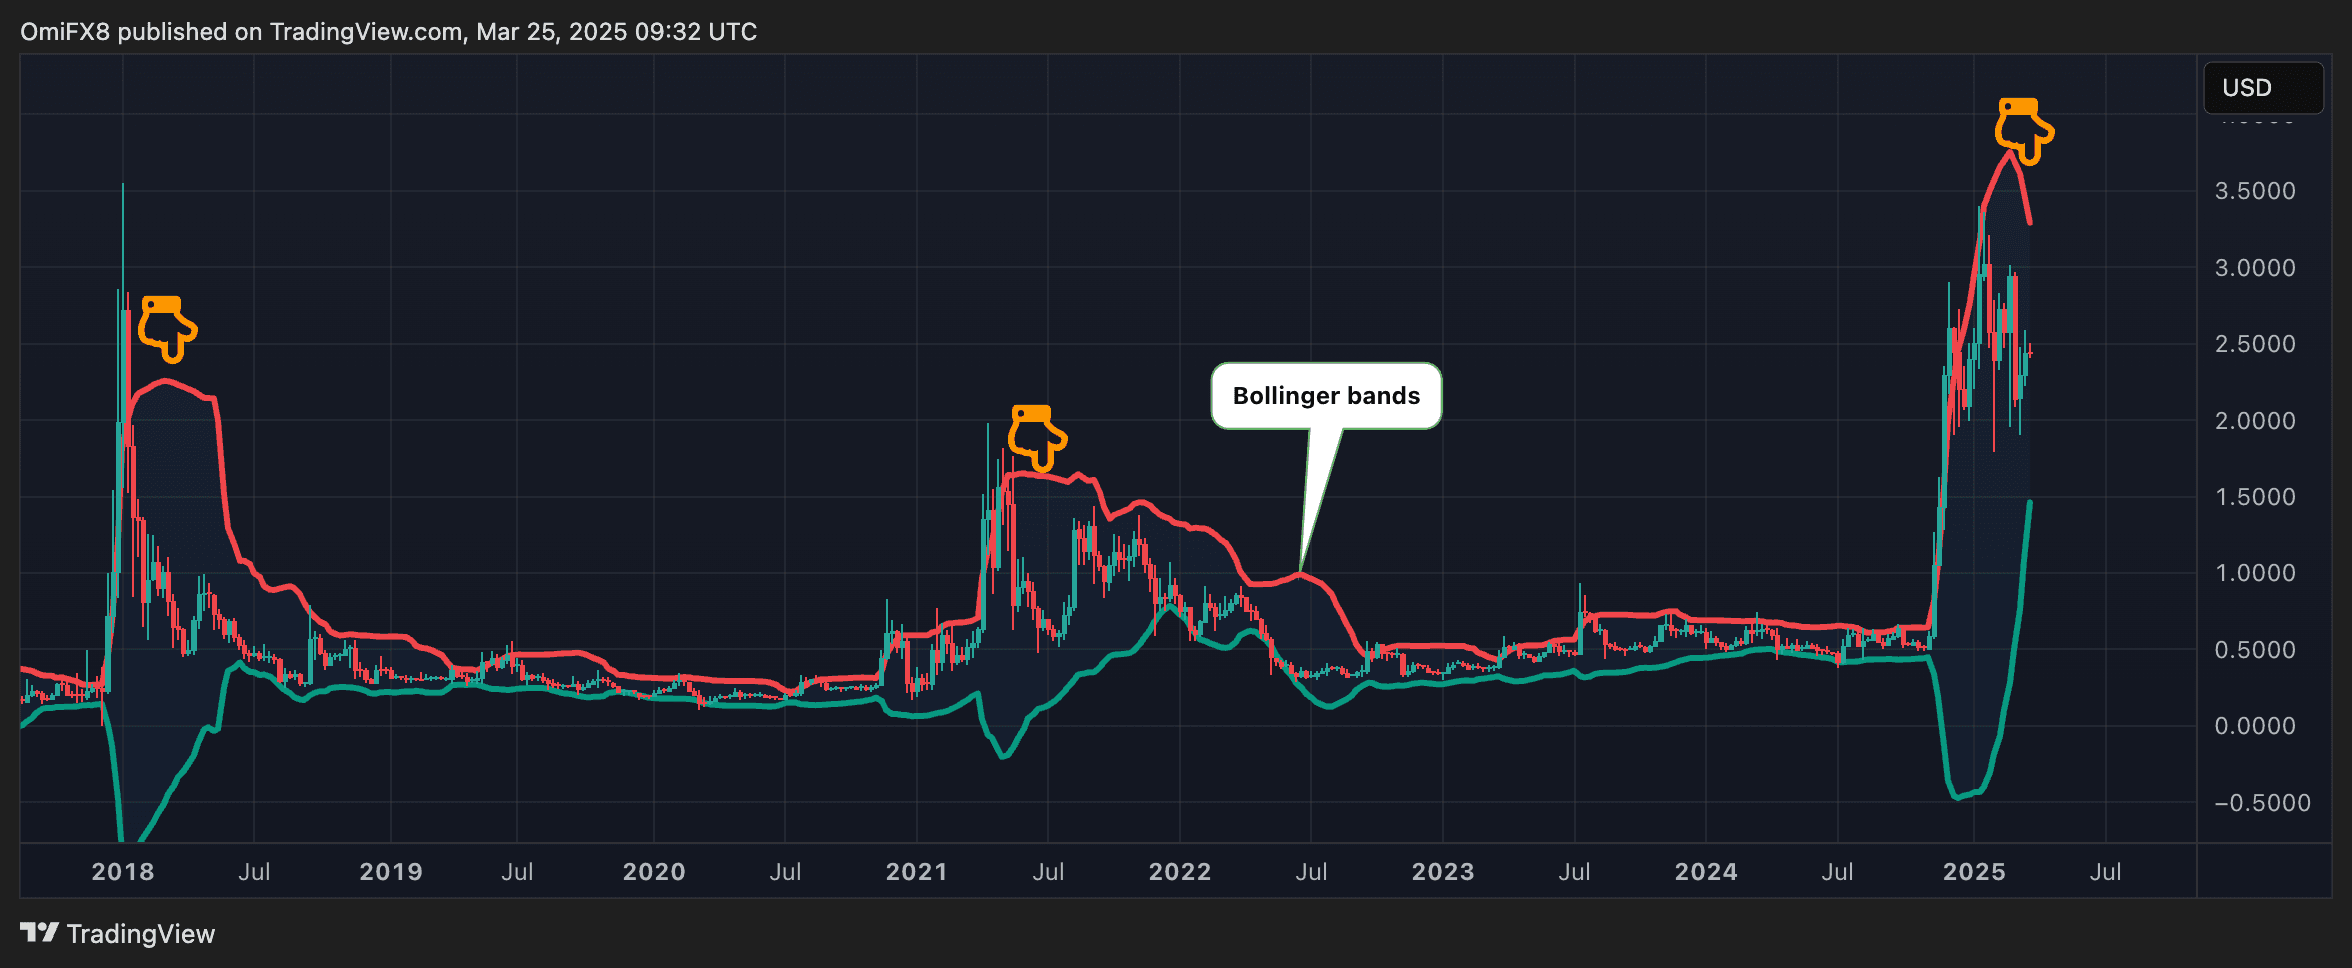
The Bollinger Bands, which are volatility indicators set two standard deviations above and below XRP’s 20-week SMA, have widened in response to the abrupt price surge in late 2024 and early this year.
Historically, prices have typically declined following significant expansions of the Bollinger Bands, as seen after mid-2021 and early 2018.
When bullish?
A decisive move past $3, the high established on March 2, would invalidate the bearish setup, disrupting the pattern of lower highs and indicating a renewed bullish technical outlook.
Some experts forecast that XRP could soar as high as $10 by the decade’s end.