The price of Ether (ETH) is displaying a bear flag on the daily chart, a technical pattern typically associated with significant downward momentum. Could this bearish formation and the reduction in transaction fees indicate the beginning of a further decline for ETH towards the $1,200 mark?
Decline in Ethereum’s Network Activity
The market downturn, driven by tariff threats from US President Donald Trump, caused Ether’s price to plummet nearly 50%, dropping from a peak of $3,432 on January 31 to a 16-month low of $1,750 by March 11.
Although ETH has rebounded by 18% since then, it has struggled to achieve a definitive break above $2,000 for a second time within a span of less than ten days.
This weakness is mirrored in on-chain activity, as Ethereum’s daily transaction count has fallen to levels not seen since October 2024, prior to Trump’s presidential election win.
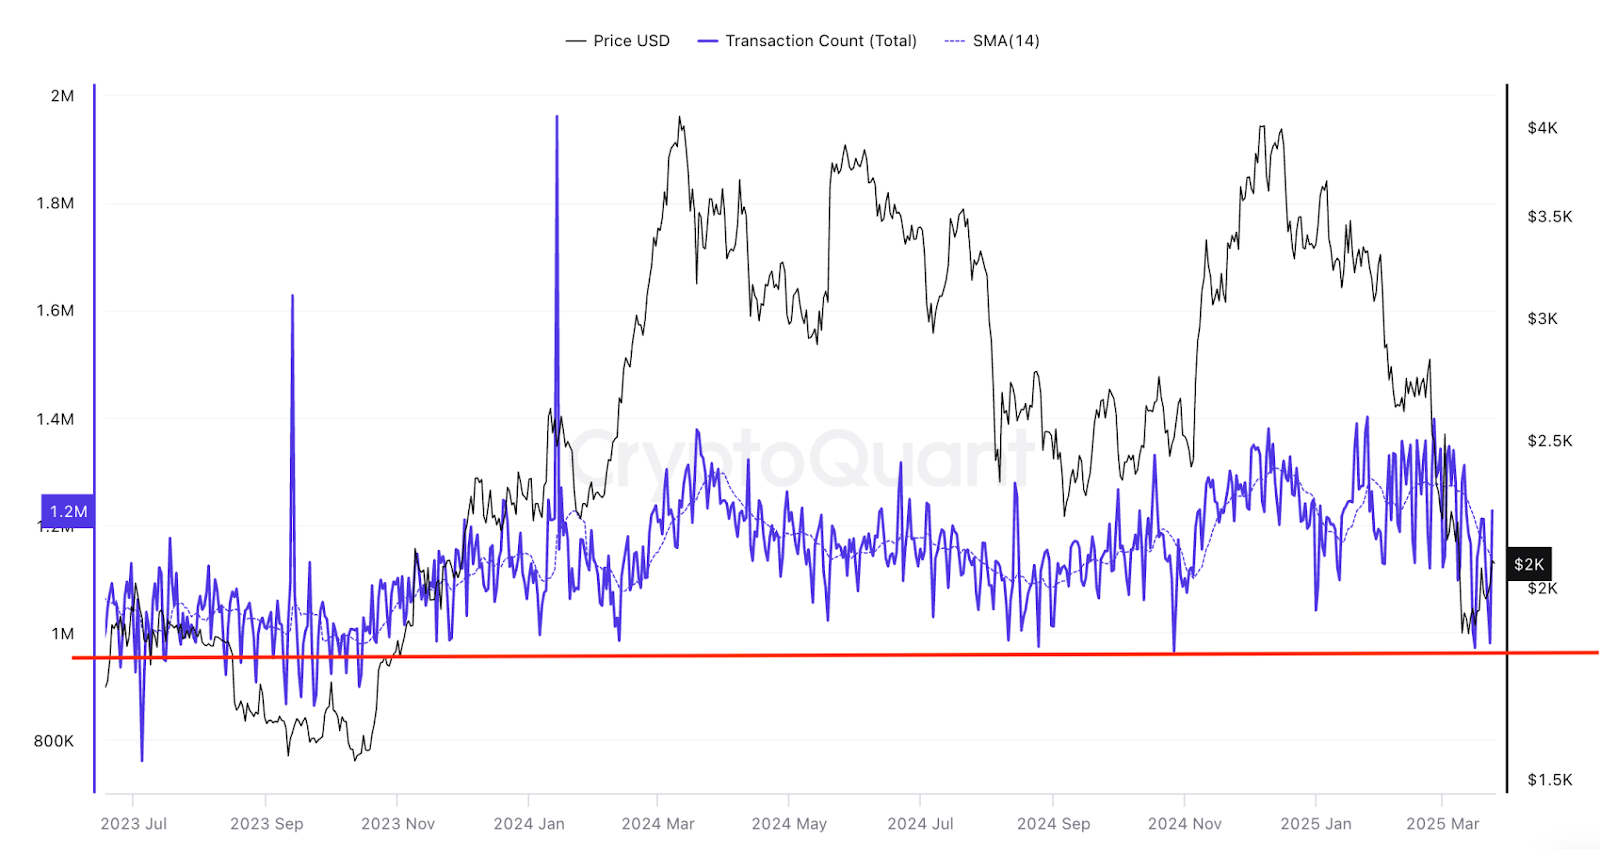
Daily transaction count on Ethereum.
Transaction fees on the Ethereum network have also nosedived, reaching an all-time low of 0.00025 ETH ($0.46) on March 24.
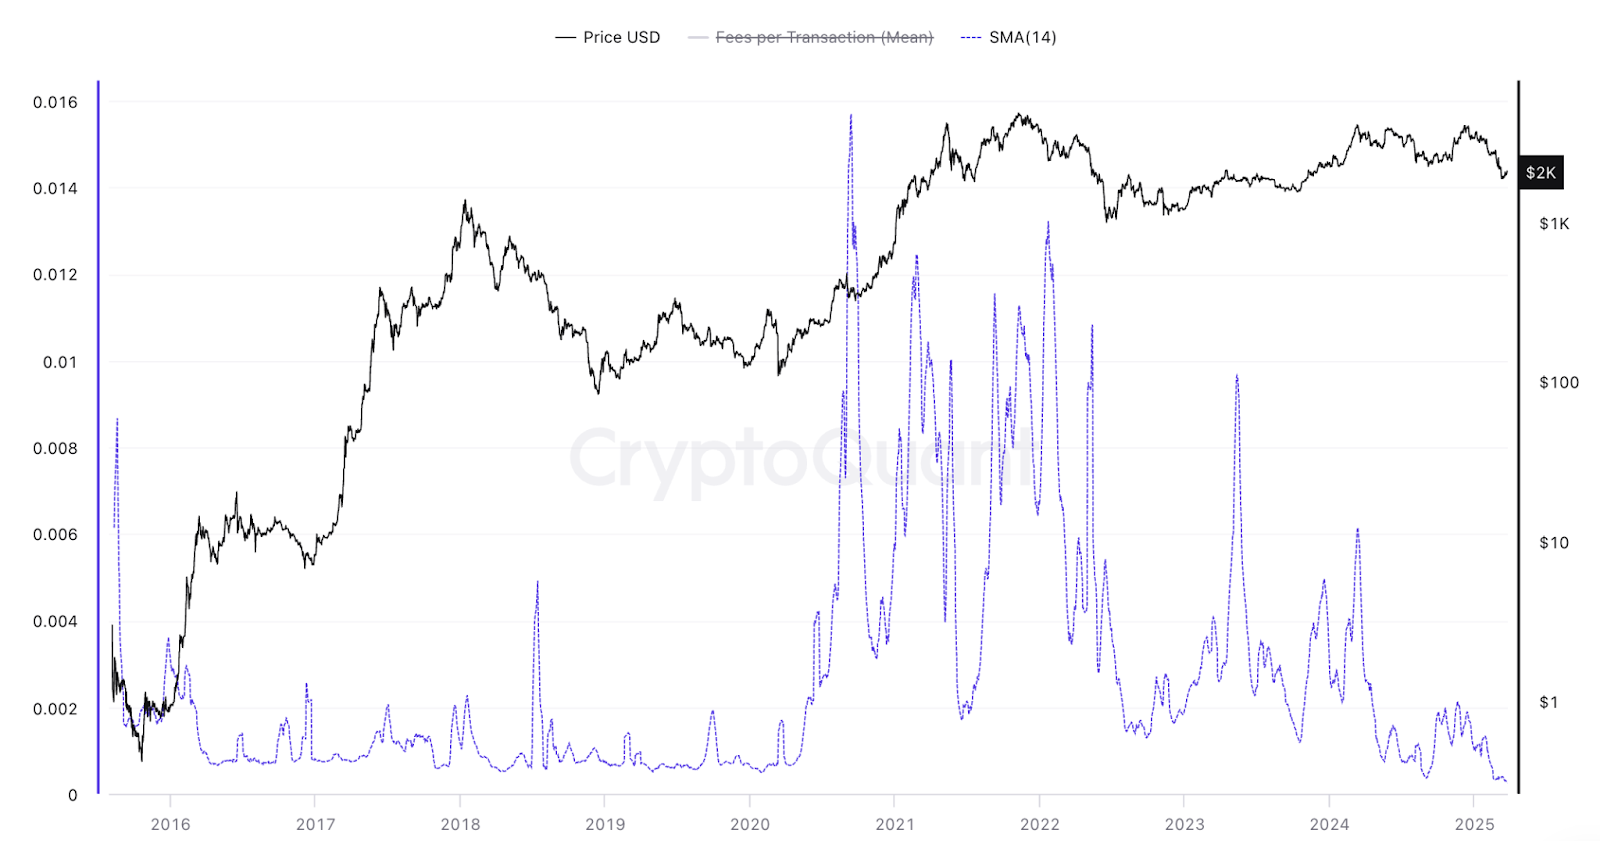
Average transaction fee on Ethereum network.
The drop in both transaction counts and fees indicates a decreased demand for block space, whether for DeFi applications, NFTs, or other DApps. This suggests a decline in network activity, which often corresponds to reduced interest or confidence in the market.
Historically, the price of Ether has been linked to high levels of network activity. For example, during the DeFi surge in 2021, transaction fees soared to as much as 0.015 ETH due to increased demand.
On the other hand, lower fees require less ETH, exerting downward pressure on its price.
Inflationary Trends in ETH Supply
Additional factors impacting Ether’s performance include its falling burn rate and increasing supply.
As transaction fees have decreased, the daily ETH burn rate has dropped to unprecedented lows, resulting in an inflationary effect.
Data indicates that the estimated ETH burn rate has fallen to 25,000 ETH per year, while supply growth has escalated to an annual rate of 0.76%, leading to an issuance rate of 945,000 ETH each year.
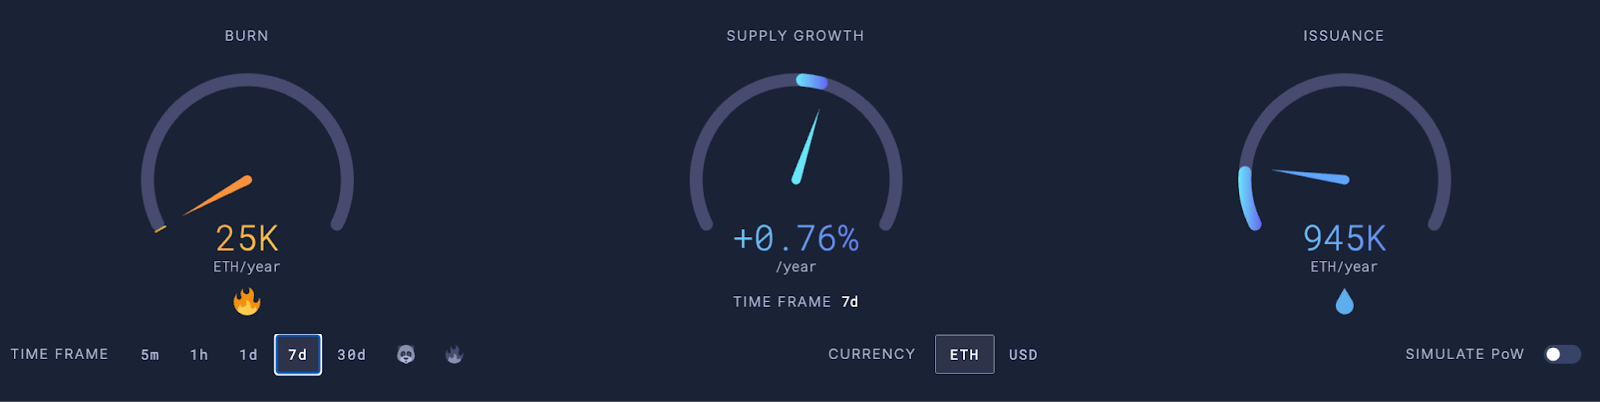
Ethereum’s burn rate trends.
Consequently, Ethereum’s total supply has been on the rise since April 2024, reversing the deflationary trend that accompanied the transition to proof-of-stake (the Merge) in September 2022. The total supply has now exceeded levels seen before the Merge.
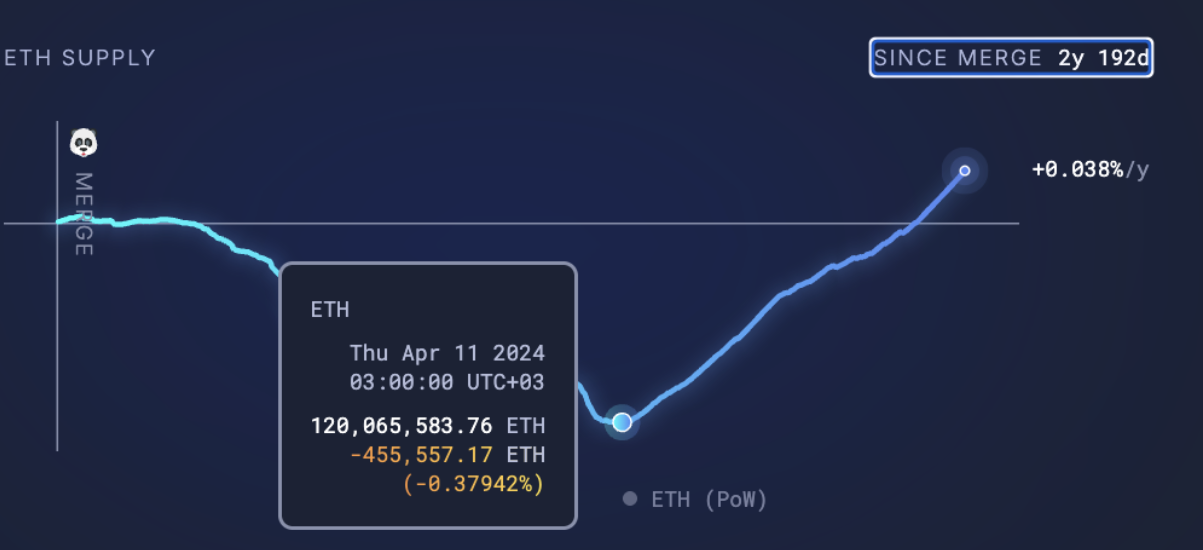
Ethereum’s supply surpasses pre-Merge levels.
The Merge effectively eliminated the mining-based issuance of Ethereum, which previously resulted in a high rate of supply inflation. The London hard fork introduced in August 2021 added a mechanism to burn a portion of transaction fees.
When network activity declines, the amount of ETH burned becomes less than the new ETH issued, leading to inflation of the asset.
Bear Flag Points to $1,230 Target for ETH
The ETH/USD pair appears to be set to continue its prevailing bearish trend, despite a bounce from recent lows, as the chart is revealing a classic bearish pattern.
In the last 30 days, the price action of Ether has led to the development of a bear flag pattern on the daily chart. A daily close below the lower boundary of the flag at $2,000 would indicate the onset of a significant drop.
The target, based on the height of the flagpole, is approximately $1,230, representing nearly a 40% decline from the current price.
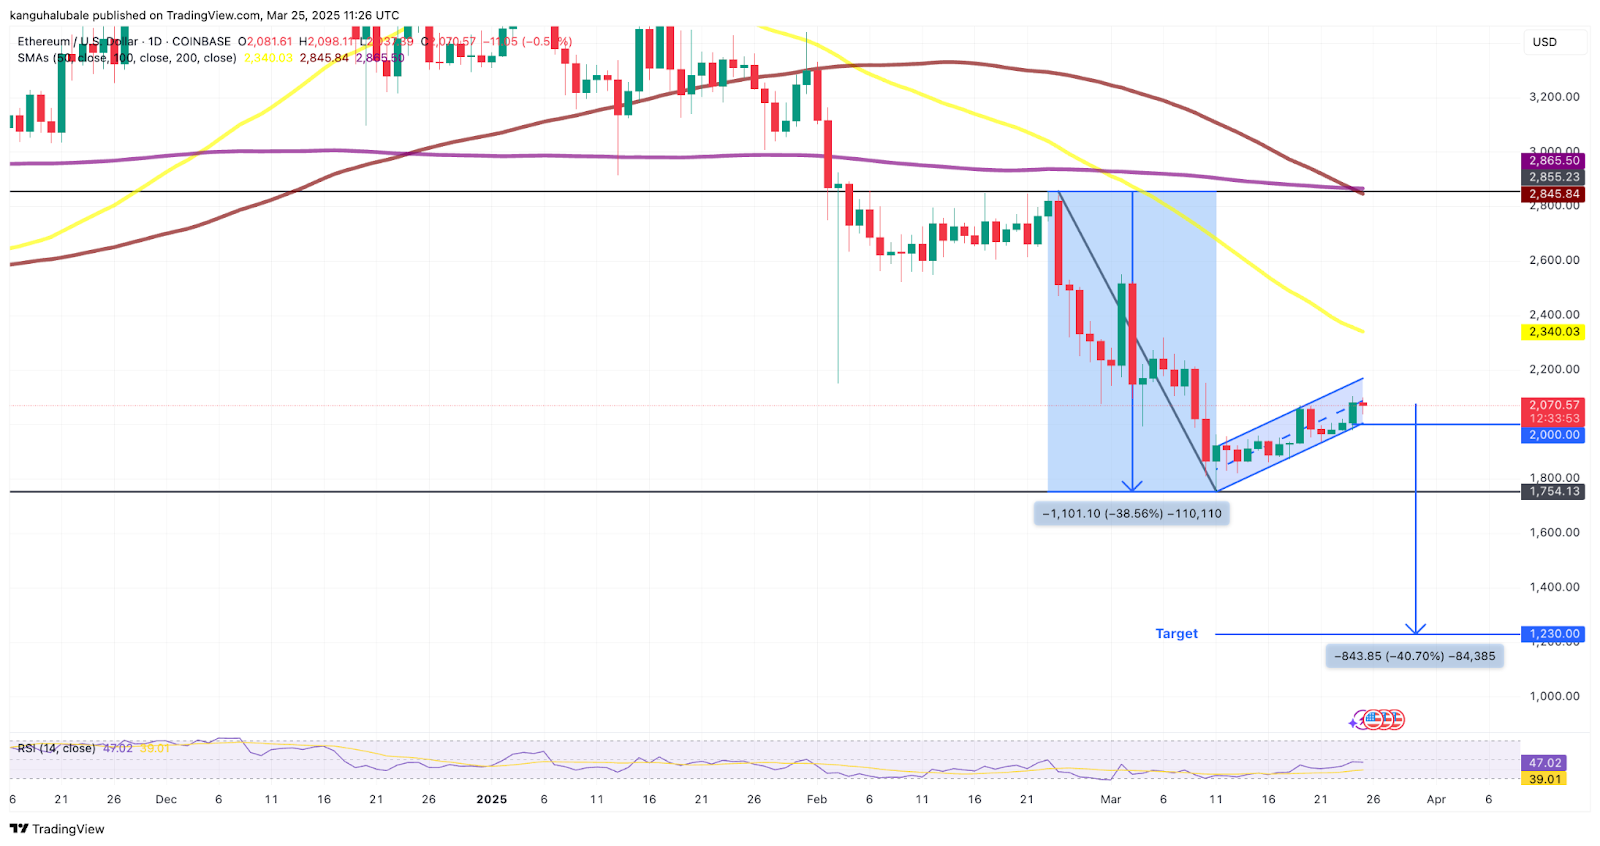
ETH/USD daily chart showcasing bear flag pattern.
Even with these challenges, some traders maintain an optimistic outlook on Ether’s potential for upside. One analyst noted that the price seems to be bouncing back, aiming to breach the important support level at $2,200.
Should this occur, it could indicate that “we’ll have a dramatic deviation on our hands,” the analyst remarked.
Another analyst expressed that Ethereum is currently “significantly undervalued” and is reaching a bottom at this level.
$ETH – #Ethereum is currently bottoming out. It’s so heavily undervalued.
In every market cycle, there’s a point where most believe Ethereum will never recover after a major bearish event, as evidenced in the chart.
It seems we’ve just encountered such a moment.
This article is not intended as investment advice. All investments and trading decisions carry risk, and individuals should perform their own research before making any financial choices.