After a promising beginning to the week, Bitcoin’s value shifted to negative territory as it fell by 3.5%, reaching an intraday low of $84,120 on March 28. This price drop coincided with a rejection near the descending trendline and the upper boundary of the ascending channel pattern.
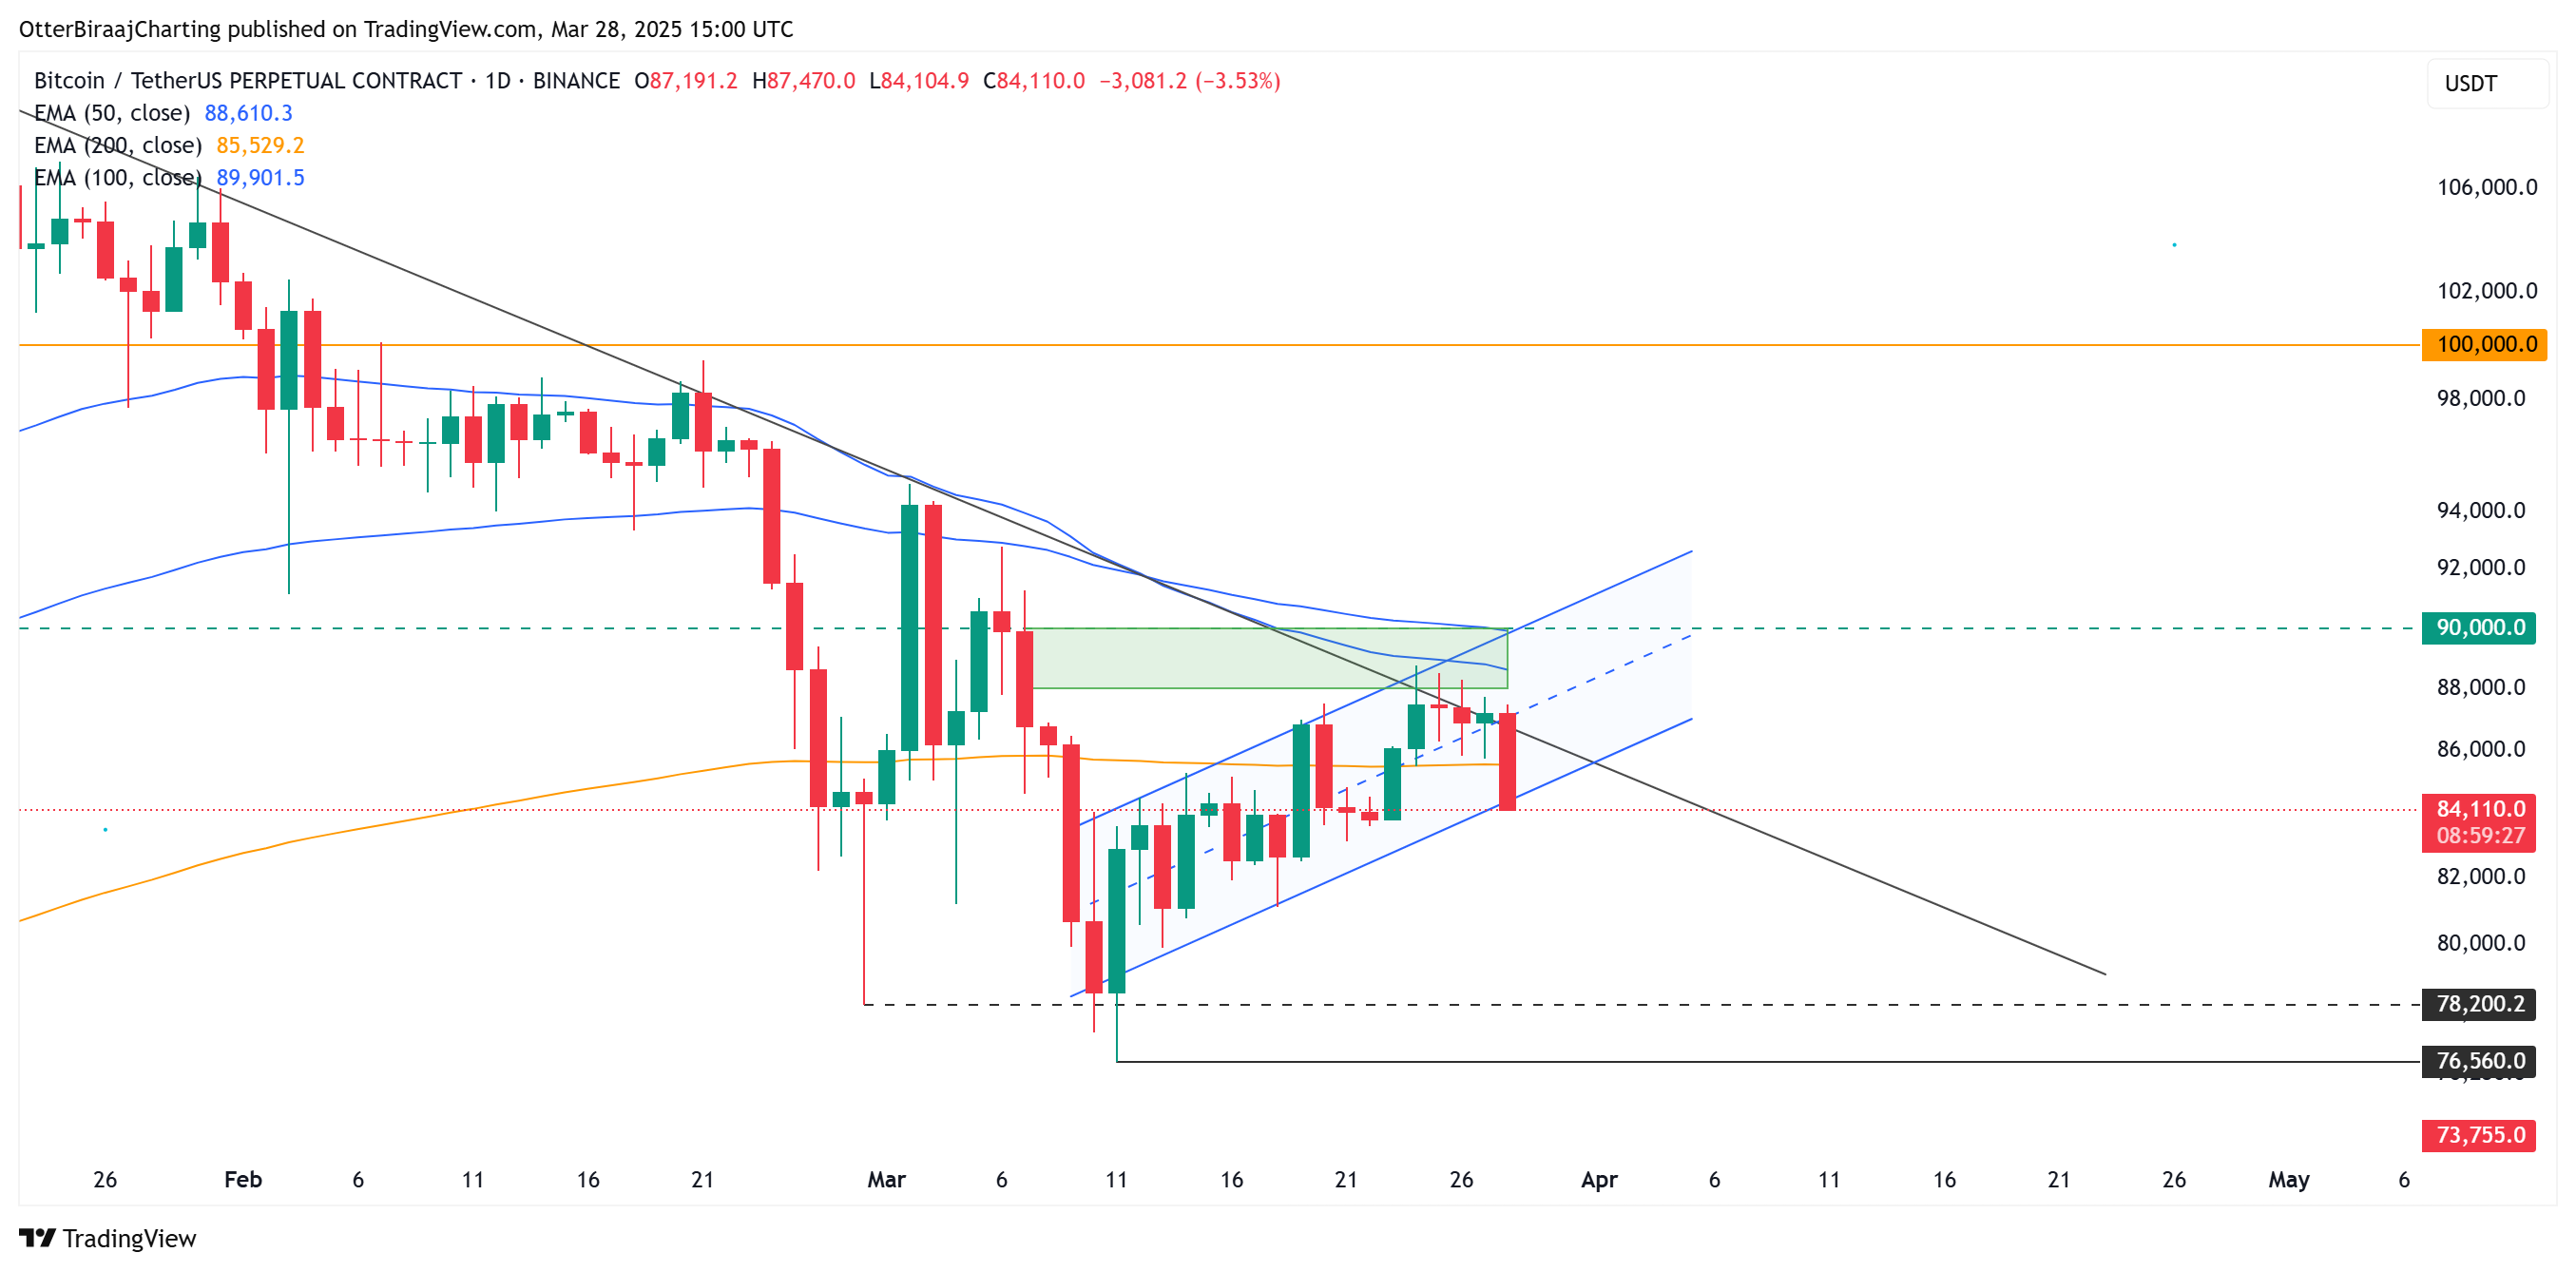
Bitcoin 1-day chart. Image source: TradingView
On the daily chart, BTC is now positioned beneath the 200-day exponential moving average (EMA) once more, and if it closes below this critical indicator, it might trigger further downward movement.
Global liquidity expansion may support Bitcoin’s price
Recent insights from a macroeconomic market analyst highlighted that Bitcoin could retrace to the $72,000-$75,000 range if liquidity conditions stay the same.
Macro liquidity refers to the total capital accessible within the financial system that can readily flow into riskier assets like stocks and cryptocurrencies, affected by elements such as interest rates, US Federal Reserve policies, and overall market conditions.
The analysis indicates that Bitcoin is showing a “greater convergence” with traditional risk assets but still remains on the outskirts of the risk spectrum. This suggests that for capital to reinvest in BTC, investors must change their focus from safer assets like bonds to riskier ones like BTC or low-rated banks within the Russell index. The analyst remarked,
“Overall, the current macro liquidity environment is neutral. Rates have somewhat decreased, but the carry trade continues to pose risks for assets.”
Conversely, other experts have suggested that the increase in global M2 money supply might instigate a BTC rally. The Global Liquidity chart, which tracks M2 growth from major central banks, has historically shown a correlation with Bitcoin’s price fluctuations.
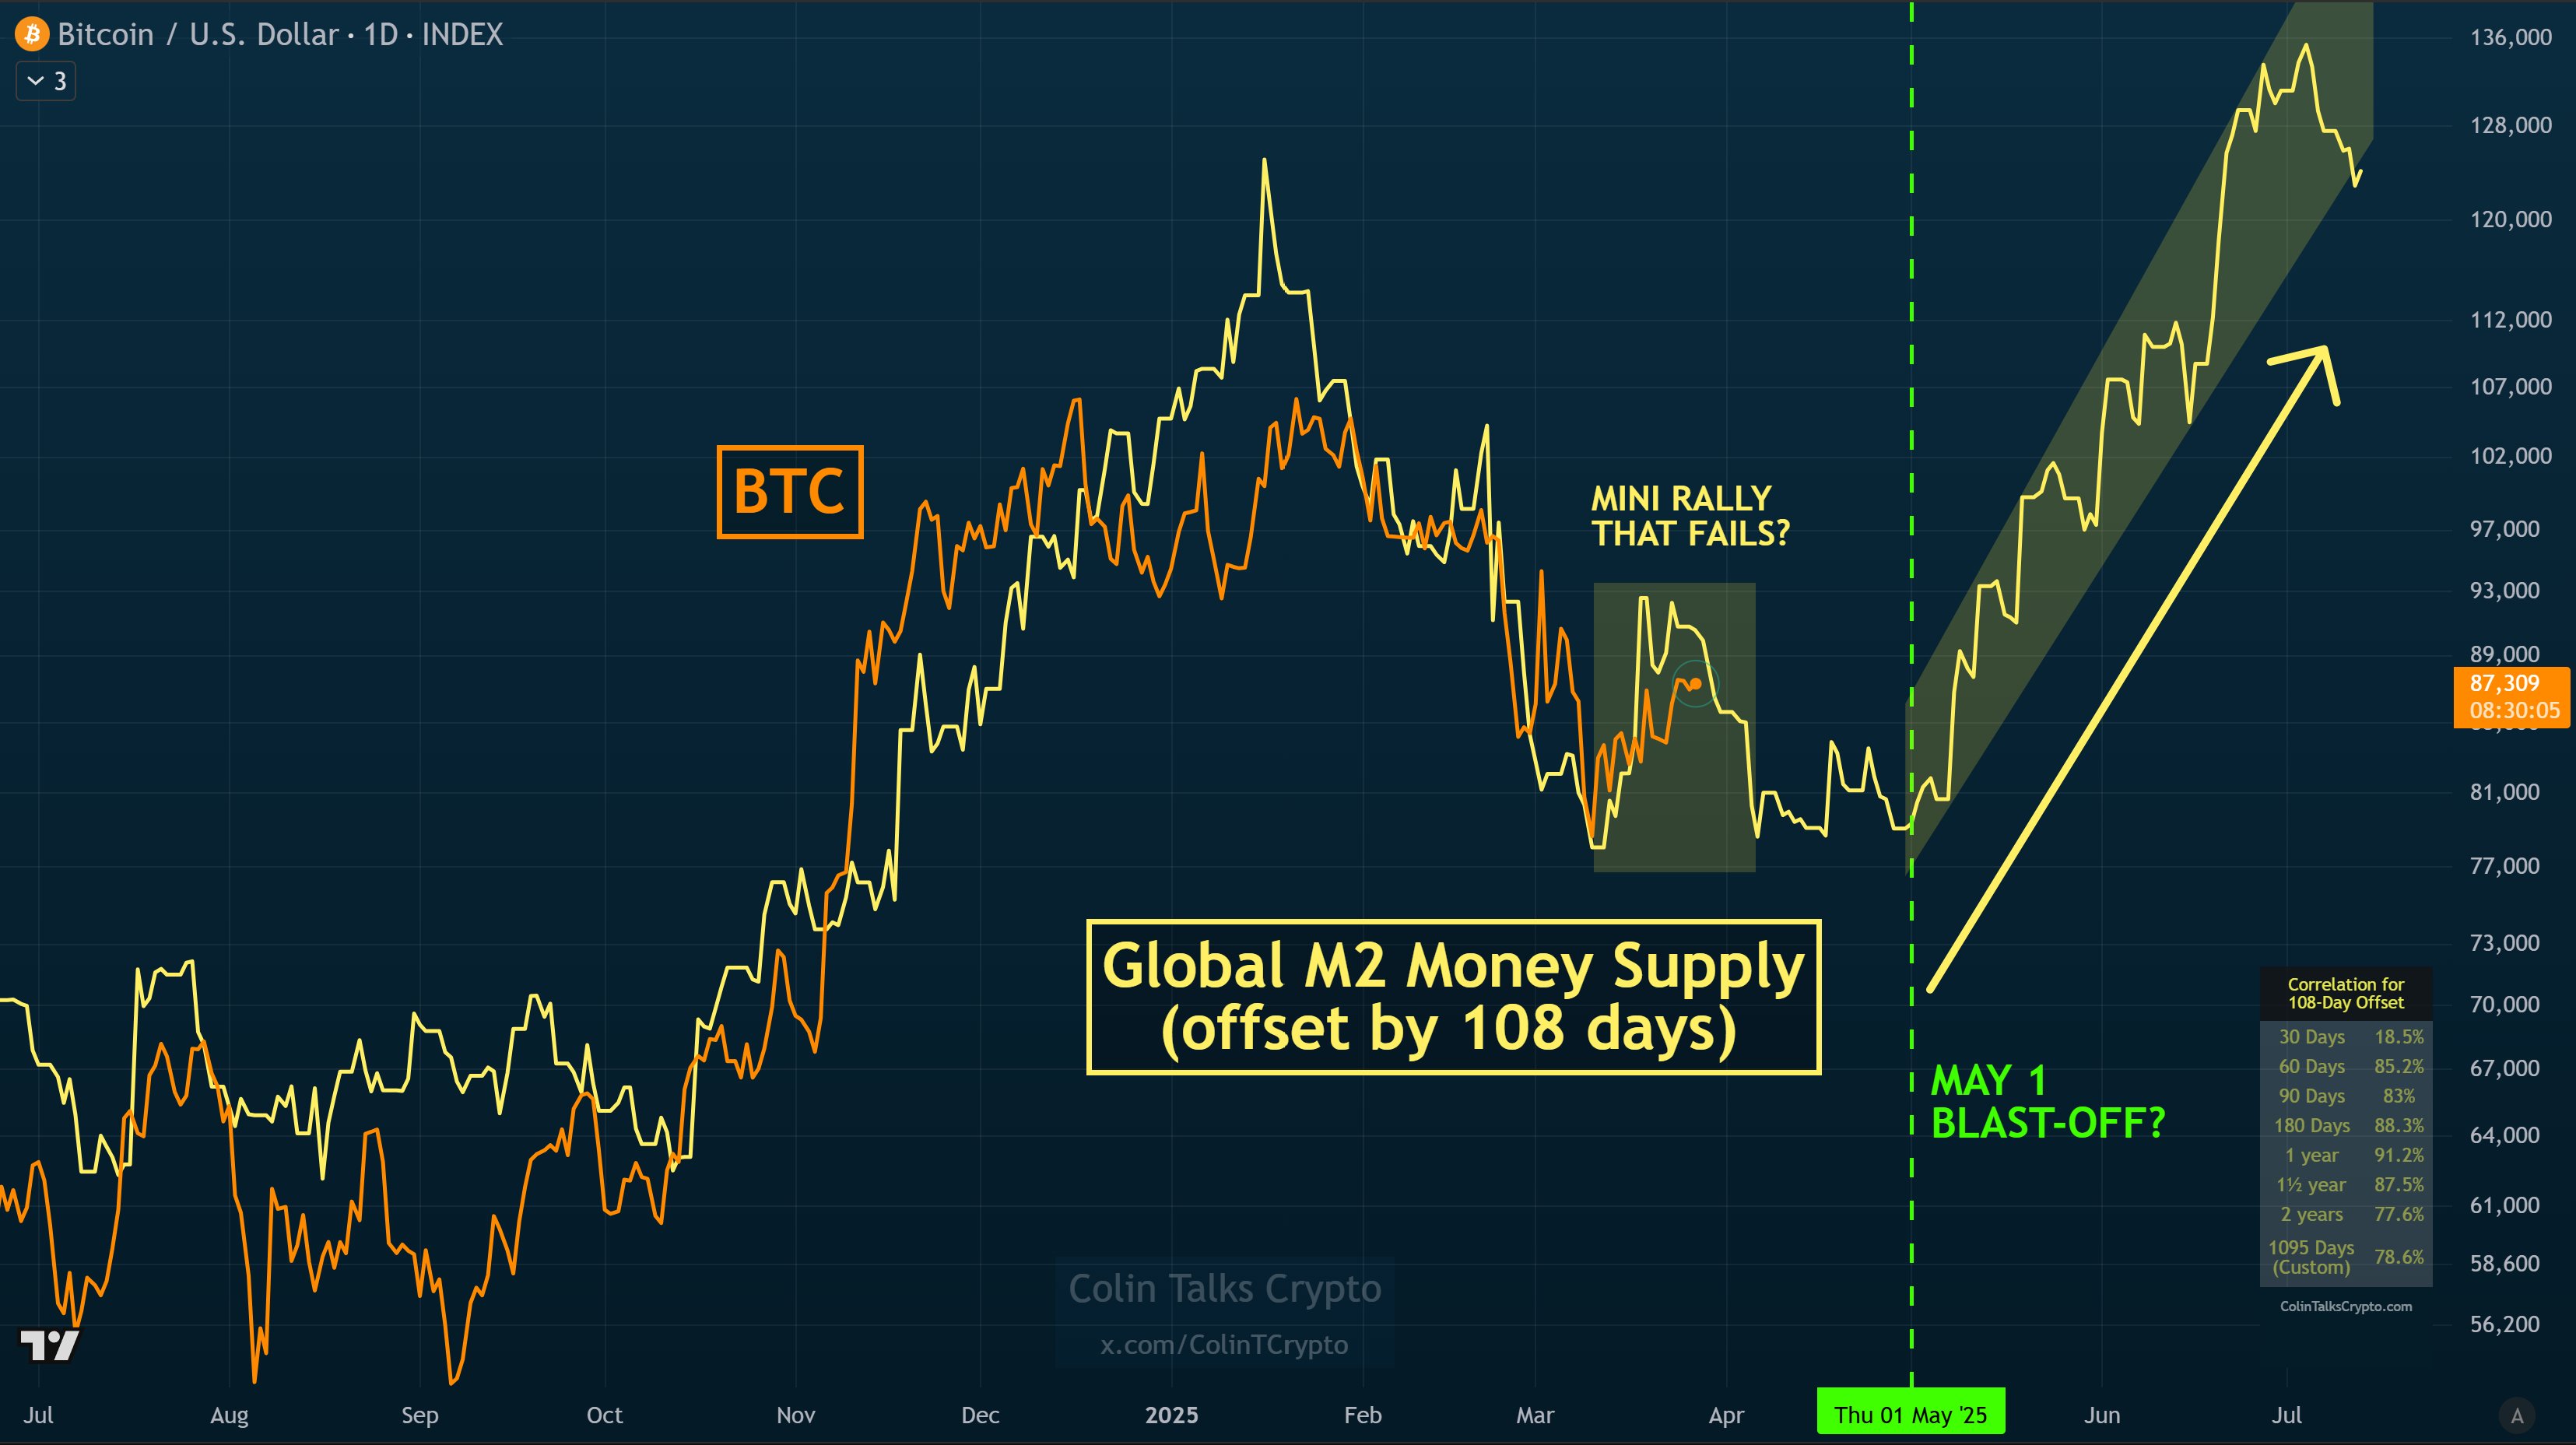
Correlation between Bitcoin and Global M2 Money supply. Source: X.com
A crypto commentator mentioned that the predictive correlation between M2 supply and BTC suggests a potential BTC rally around May 1, which could last for about two months.
However, the crucial distinction between macro liquidity and global M2 growth is that while M2 reflects the total money supply, macro liquidity emphasizes how easily capital can transition into risk assets. Thus, even with a rise in M2, macro liquidity could remain stable if the funds are directed towards low-risk investments. In this context, the market analyst noted,
“The total amount of money in the system isn’t expanding as it once did.”
Related: What’s causing Bitcoin’s price decline today?
Bitcoin addresses sub-$85K CME gap
Bitcoin’s recent uptick created a CME gap between $84,435 and $85,000. The CME Bitcoin futures gap reflects the difference between BTC CME futures’ closing price on Friday and the opening price on Sunday evening. Typically, these gaps are filled, and traders often target these levels based on market structure dynamics.
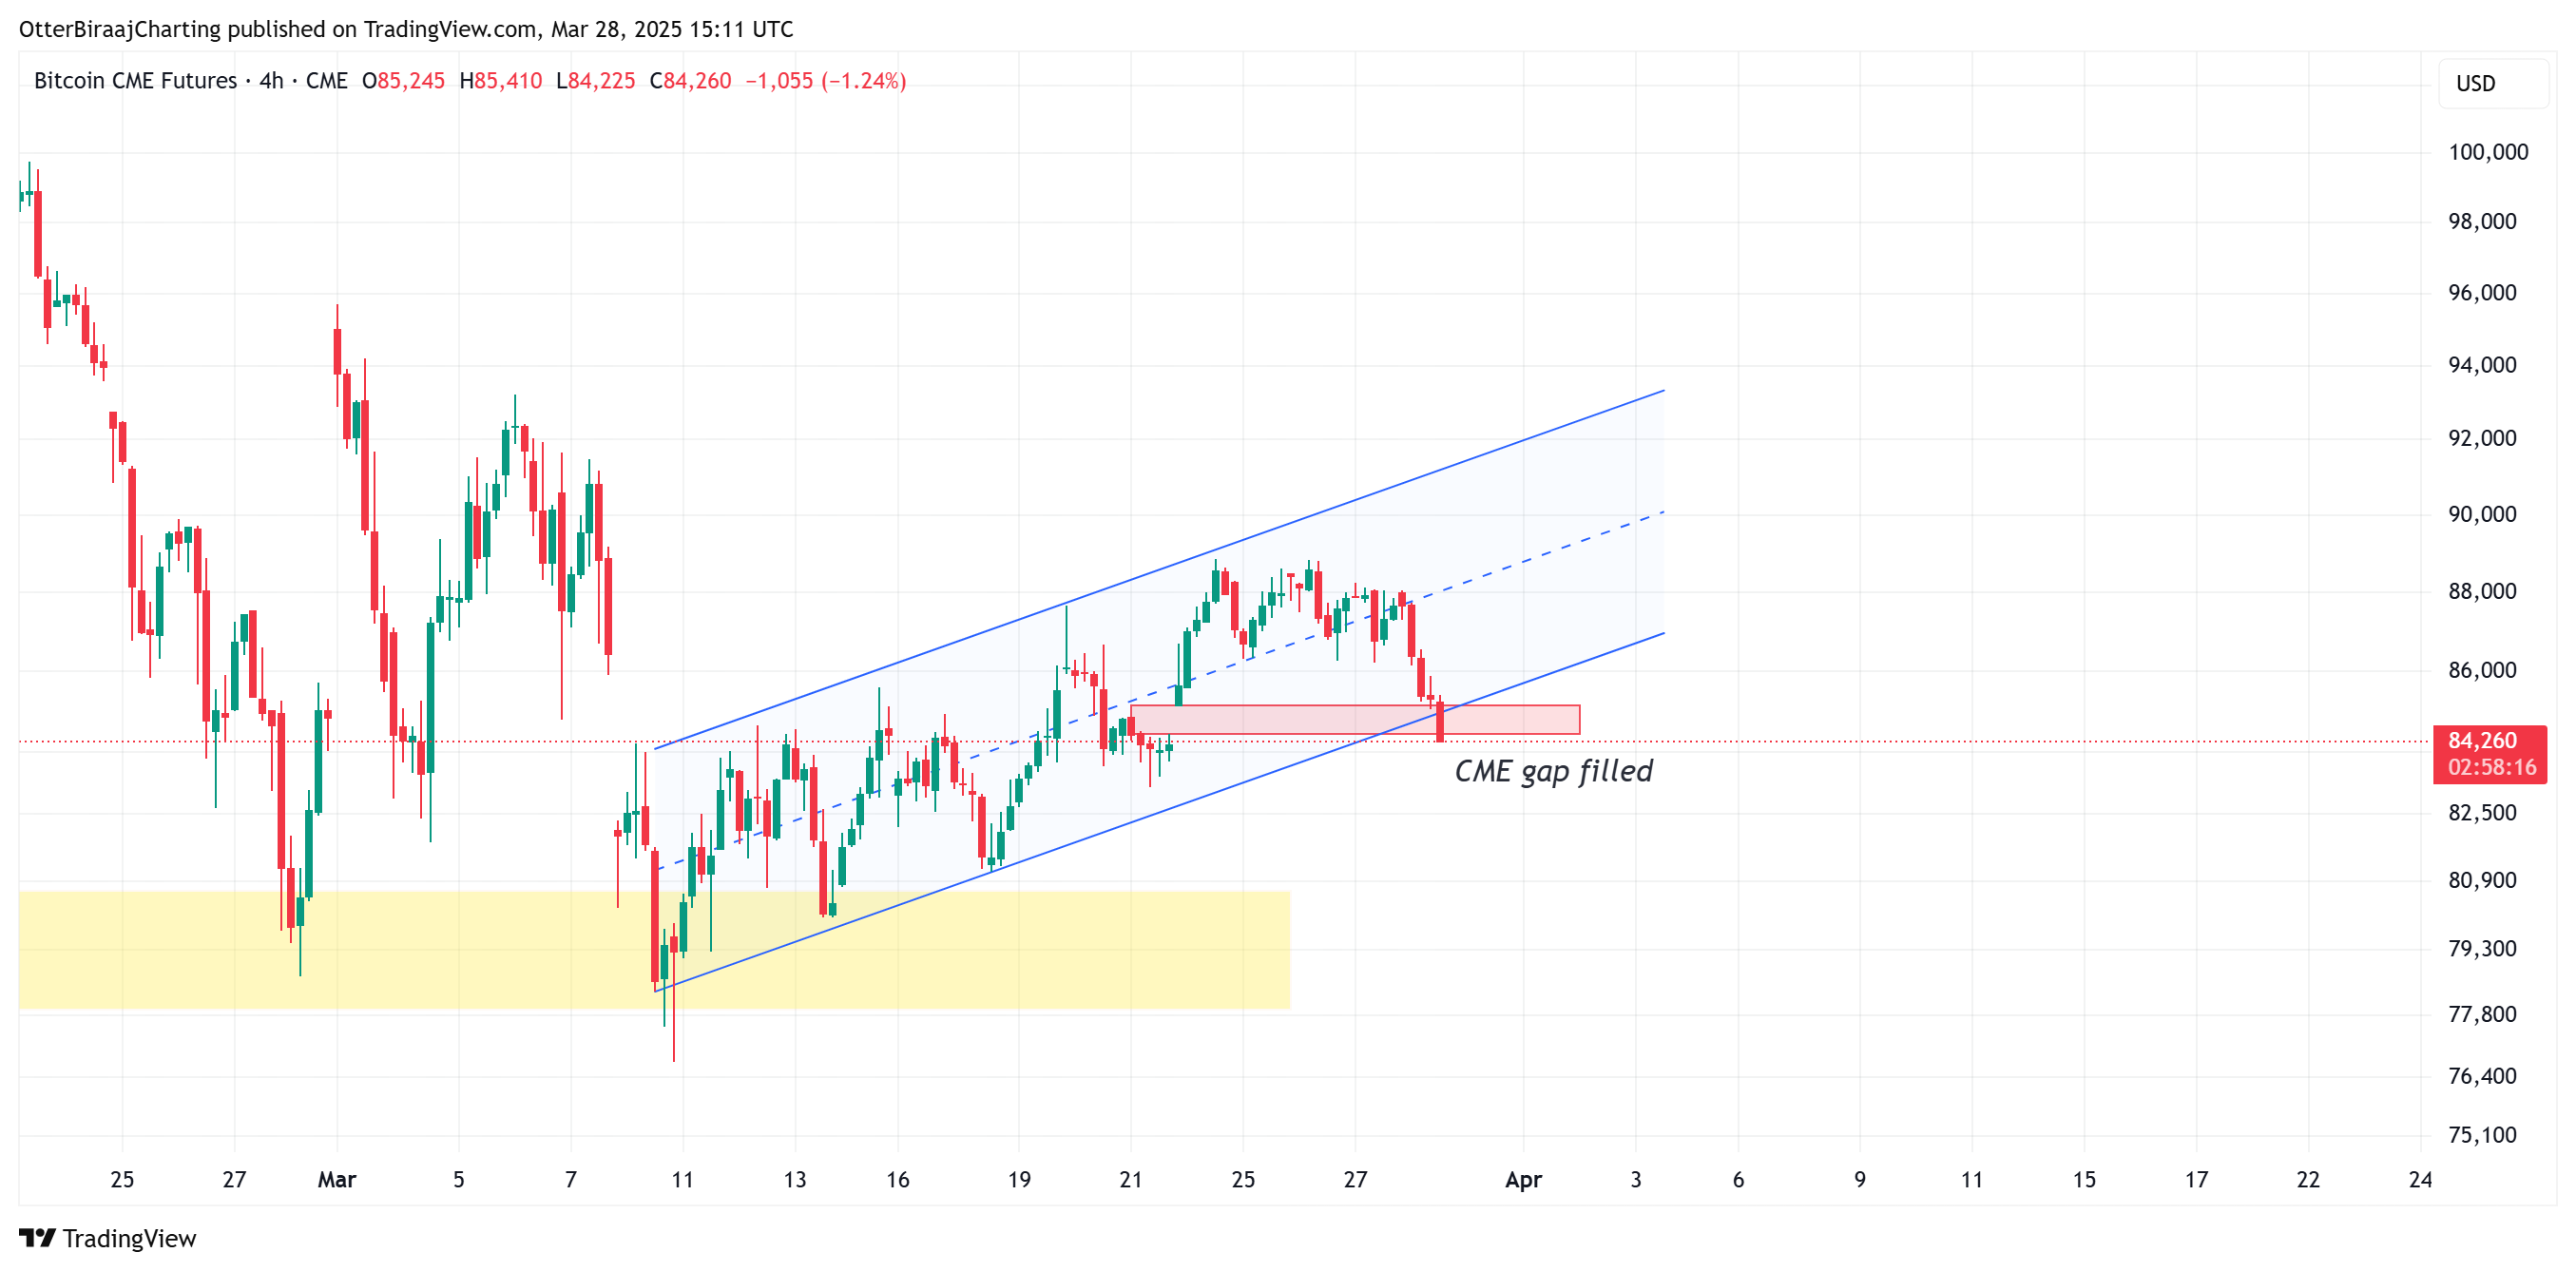
Chart illustrating the Bitcoin CME gap. Source: TradingView
As depicted in the chart, BTC’s price filled the CME gap prior to its daily close on March 28, which could lead to a short-term rebound. This gap is also aligned with a retest of the lower boundary of the ongoing ascending channel pattern previously mentioned.
Nevertheless, a crypto trader noted the possibility of a prolonged correction ahead, suggesting that new lows could emerge in 2025. The trader identified immediate support at $76,700, indicating it might serve as a minor retest area before prices descend below $74,000.
Similarly, a technical analyst pointed out that Bitcoin is in a critical juncture. In a recent post, the analyst stated,
“It’s crucial to maintain this FVG / two-week high at $85,270, otherwise, I’ll be looking to short on a retest targeting liquidity buildup near $80K.”
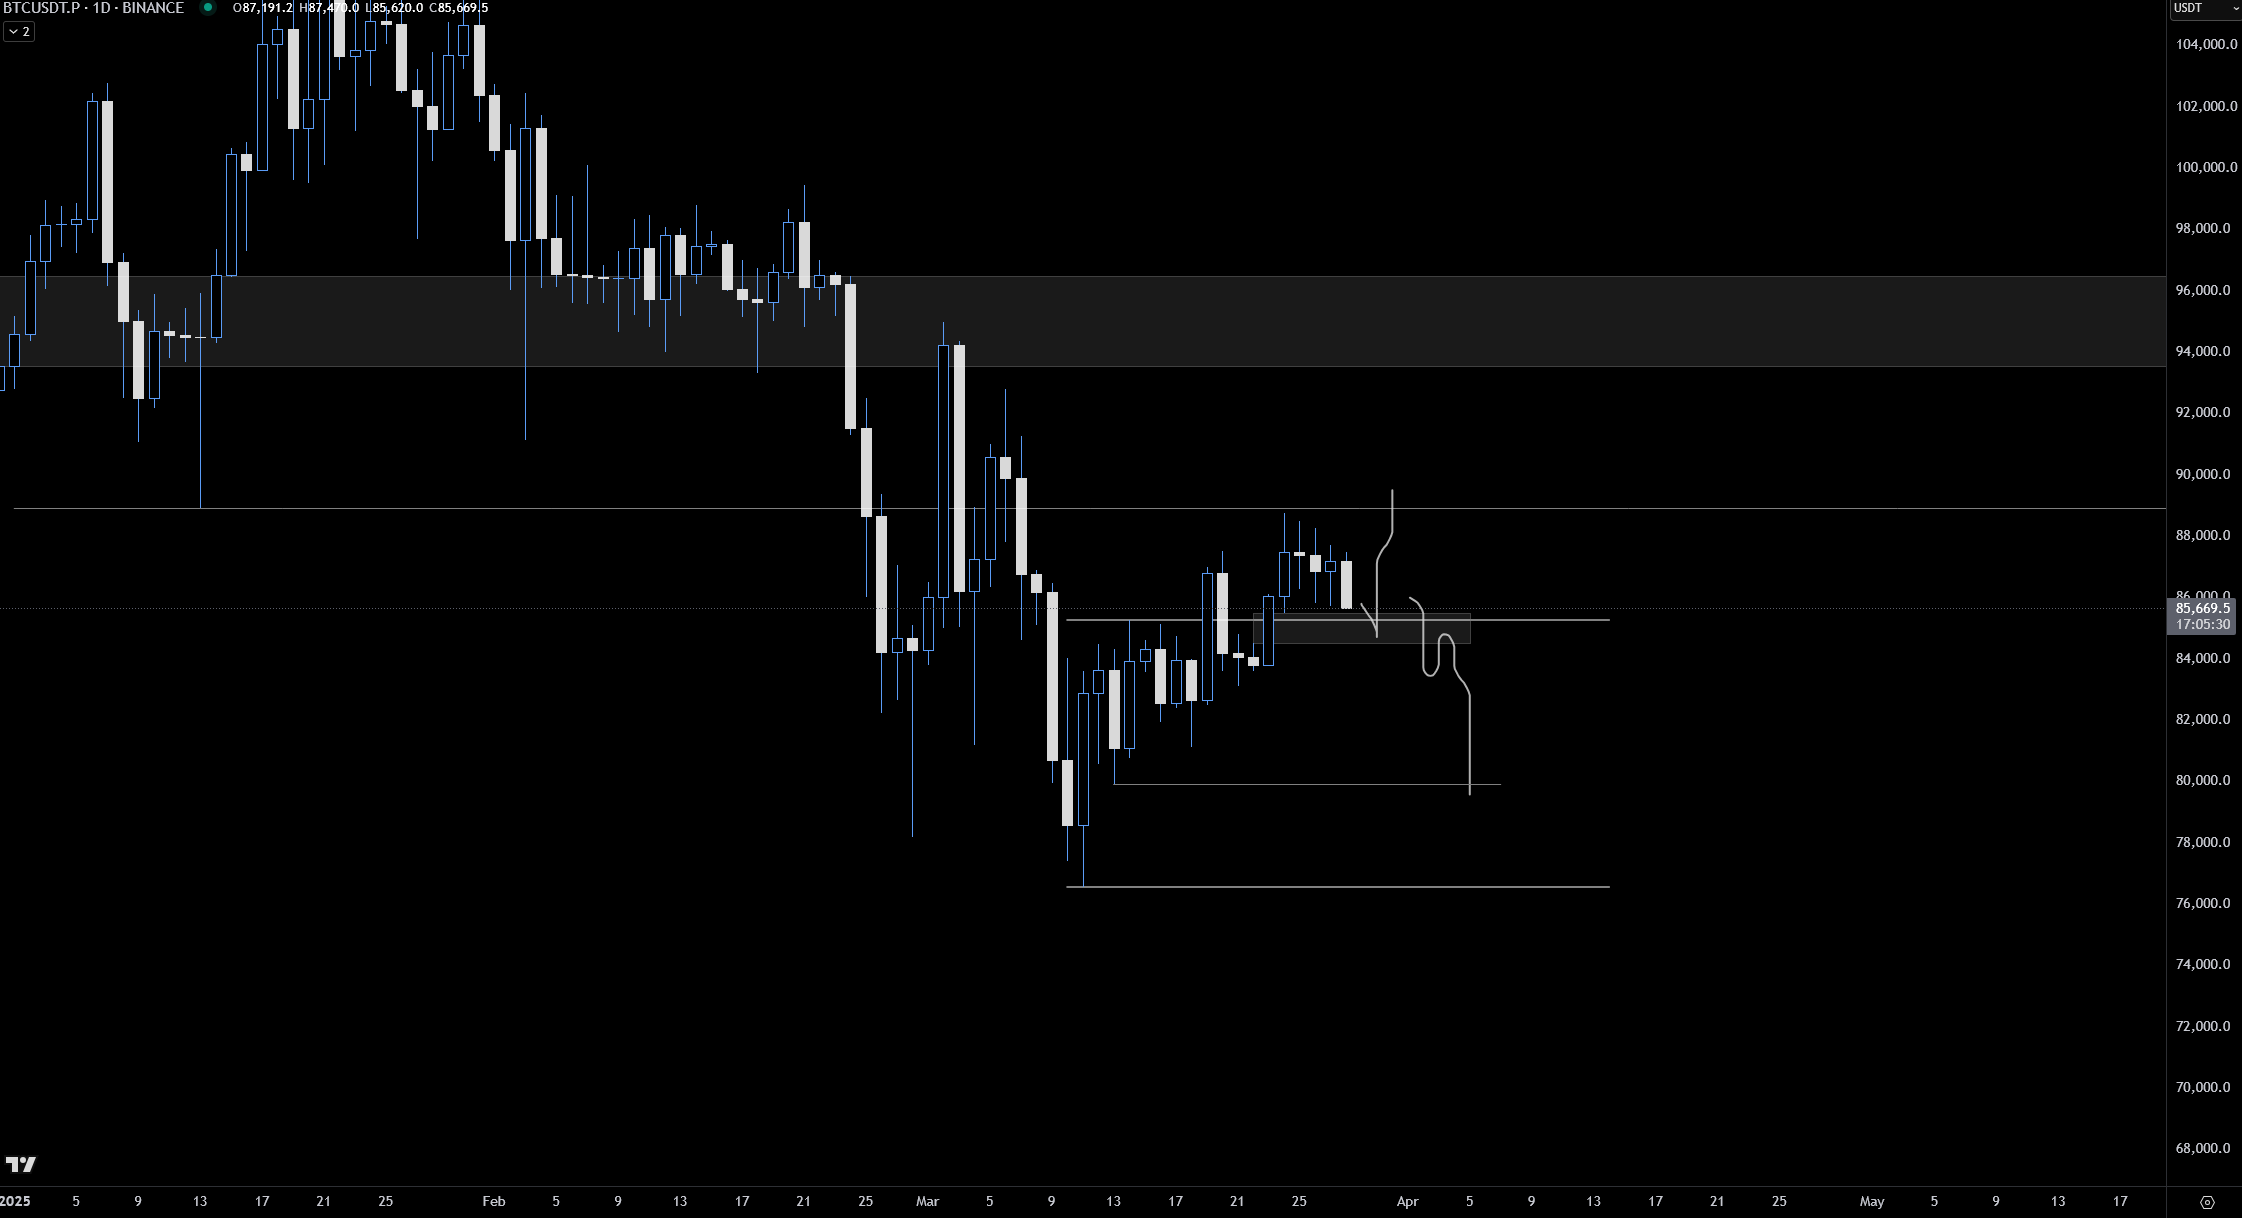
Bitcoin 1-day analysis by a technical analyst. Source: X.com
This article does not constitute investment advice or recommendations. Every trading decision carries risks, and readers should perform their own research before making any decisions.