Bitcoin (BTC) is stepping further away from the significant $90,000 level, suggesting that buying interest is diminishing at these elevated prices. Traders appear anxious, particularly in light of the recent announcement of new US trade tariffs and rising inflation concerns, as indicated by the unexpectedly robust US Personal Consumption Expenditures data.
Investors are split regarding Bitcoin’s price direction for 2025. Examining insights from the prediction markets, an analyst pointed out that the most pessimistic price estimate for Bitcoin in 2025 stands at $59,040, whereas the most optimistic projection reaches $138,617.
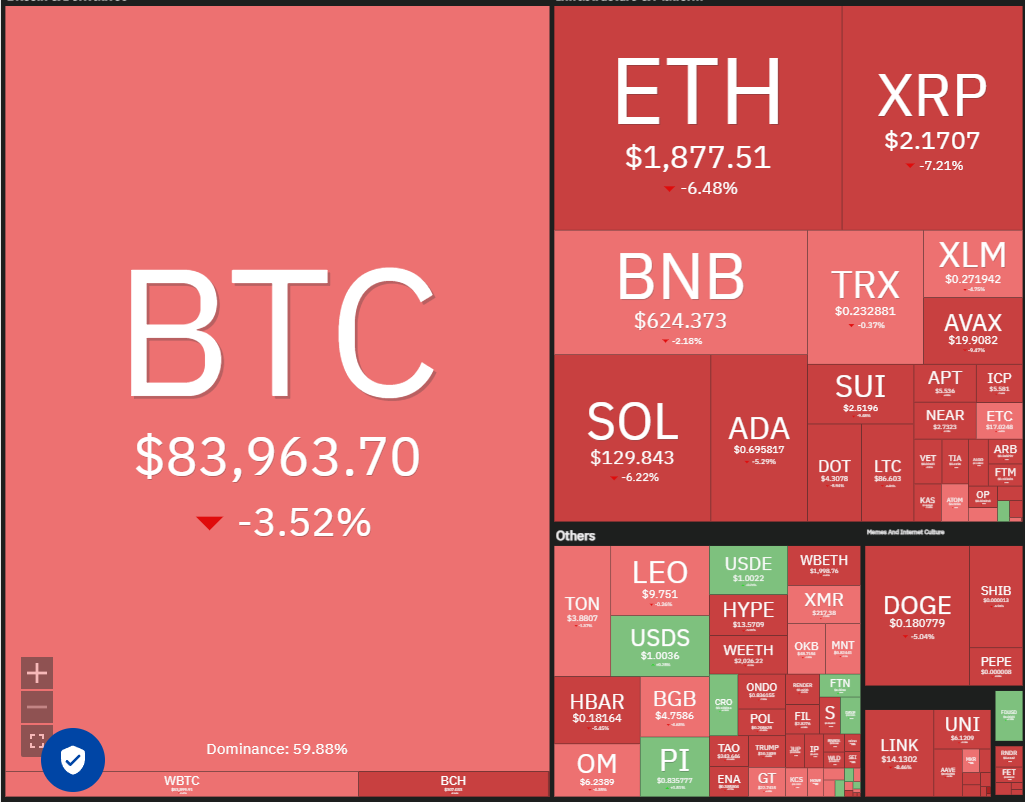
Crypto market data daily overview.
While the short-term outlook remains unclear, a leading crypto analyst maintains an optimistic stance on Bitcoin. He expressed that Bitcoin could potentially reach a new record high exceeding $109,000 before the conclusion of the second quarter. He mentioned that uncertainties surrounding US tariffs and recession fears are unlikely to significantly disrupt the expected Bitcoin upswing.
What key support levels should we monitor in Bitcoin and other major altcoins? Let’s delve into the charts of the top ten cryptocurrencies to find out.
Bitcoin Price Analysis
Bitcoin faced resistance and fell below the 20-day exponential moving average ($85,765) on March 28.
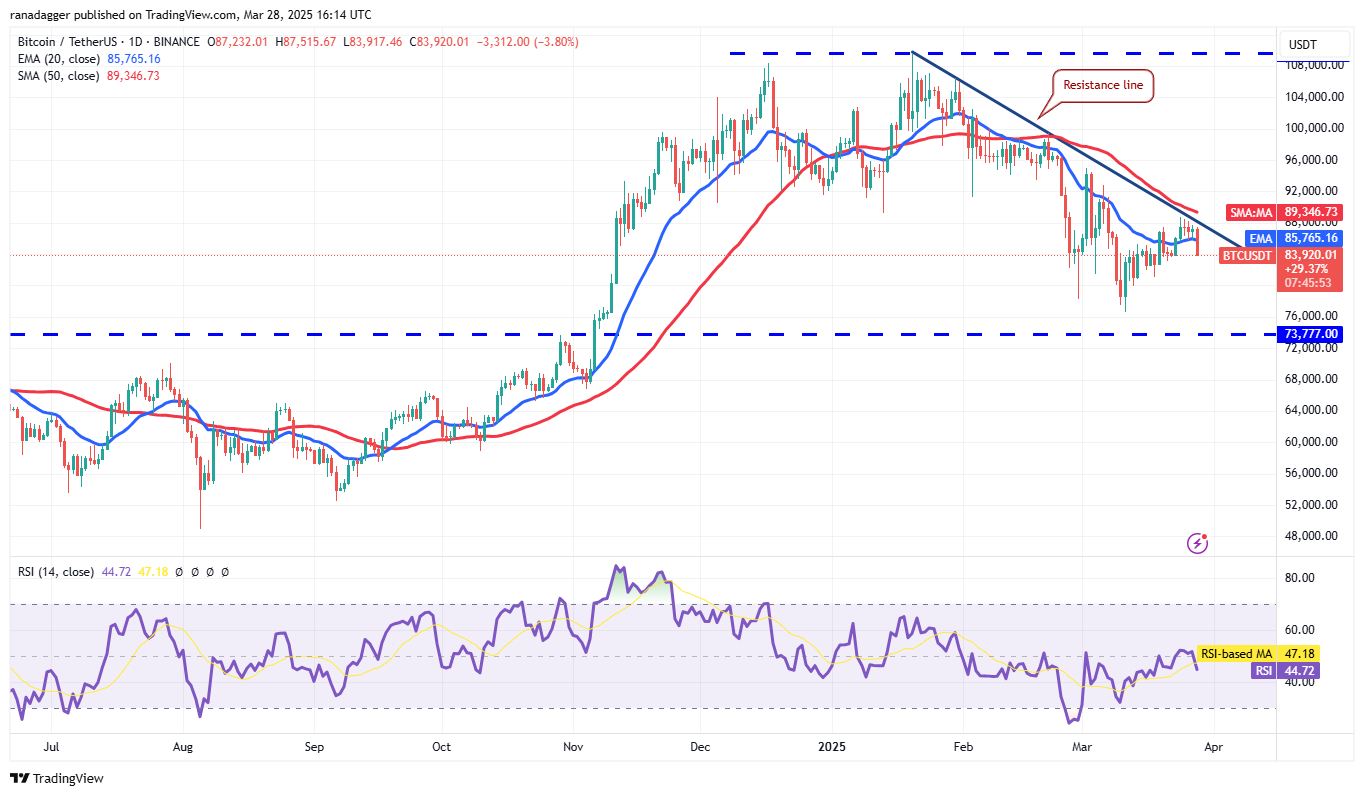
BTC/USDT daily chart.
The bears will aim to push the price below the immediate support at $83,000. If successful, the BTC/USDT pair could drop to $81,000 and subsequently to $80,000. Buyers are expected to defend the range between $76,606 and $80,000 vigorously.
To signal the end of the correction, bulls need to push the price above the resistance line and maintain it there. A closing price above the 50-day simple moving average ($89,346) might propel the pair up to $95,000 and eventually to the key psychological barrier at $100,000.
Ether Price Analysis
Ether (ETH) declined from the breakout level of $2,111 and fell below the 20-day EMA ($2,032), signaling that the bears are in control.
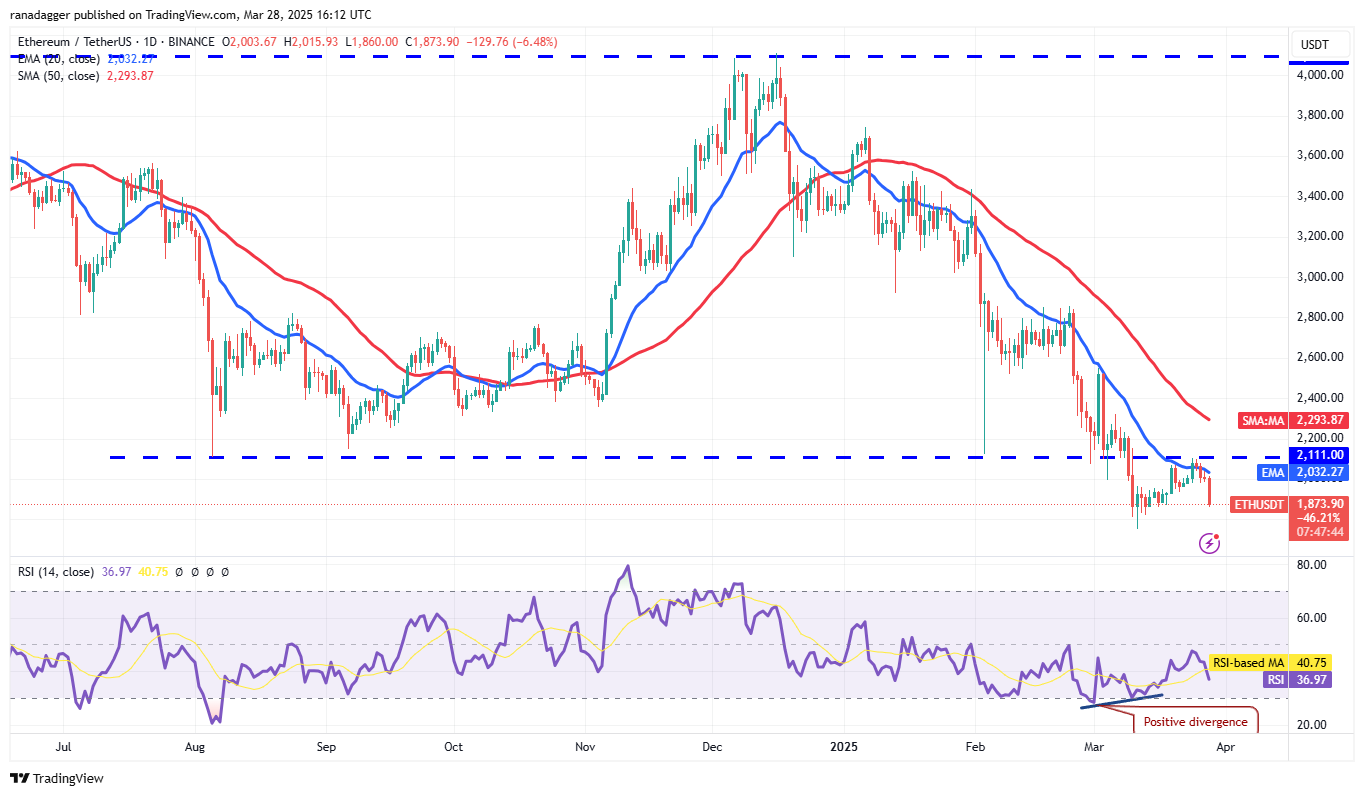
ETH/USDT daily chart.
Sellers are targeting the ETH/USDT pair for a drop to the $1,800 to $1,754 support zone. Buyers are anticipated to defend this zone vigorously, as a breach below could trigger a downturn, with the next support being $1,550.
Buyers will need to drive the price above $2,111 to demonstrate that the bearish momentum is fading. The 50-day SMA ($2,293) may present resistance on the upside, but if successfully surpassed, the pair could surge to $2,550.
XRP Price Analysis
XRP (XRP) retraced and fell below the moving averages on March 26, indicating that bears are capitalizing on minor rallies.
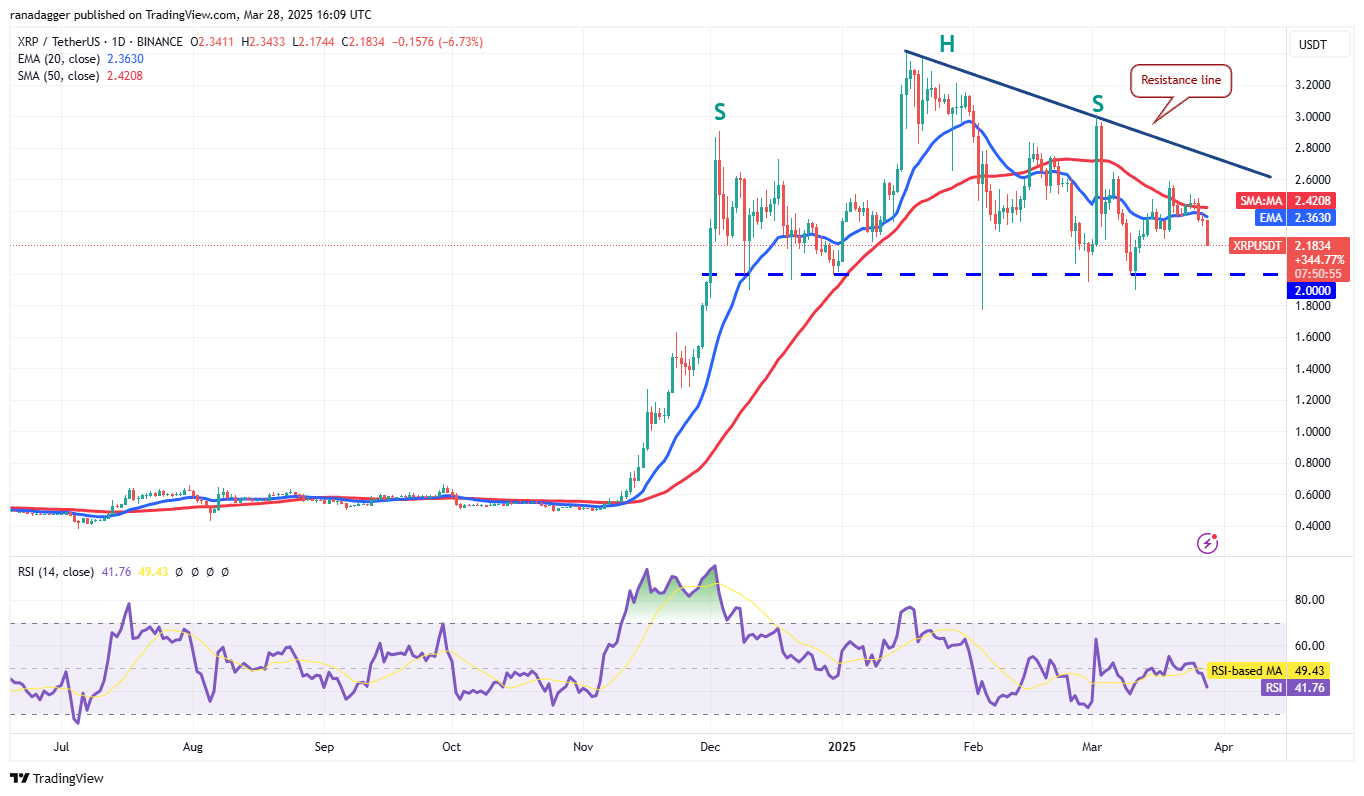
XRP/USDT daily chart.
Bears will attempt to drive the price down to the significant support level at $2. Buyers are expected to fight to protect this level since a breach below $2 could complete a bearish head-and-shoulders pattern and possibly drop the XRP/USDT pair to $1.27.
Conversely, a solid rebound from the $2 support might keep the pair within the triangle for a more extended period. The bulls could regain control with a break and close above the resistance line.
BNB Price Analysis
BNB (BNB) has been fluctuating between the moving averages and the $644 resistance level for several days.
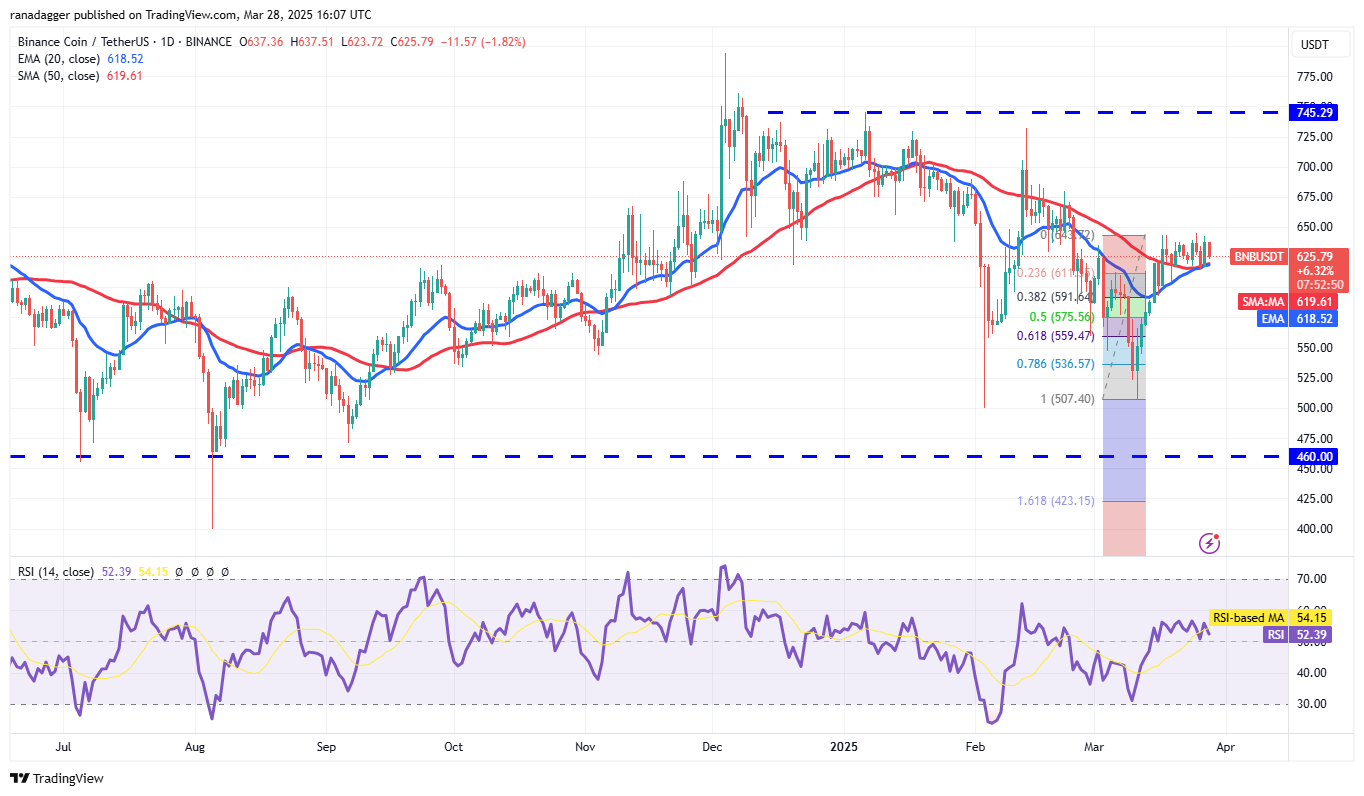
BNB/USDT daily chart.
The upward-sloping 20-day EMA ($618) and a positive RSI indicate a slight edge for buyers. If the price rebounds strongly from the moving averages, it raises the chances for a breakout above $644, potentially lifting the BNB/USDT pair to $686.
If the price instead continues to decline and falls below the moving averages, it would indicate a retreat of bullish activity, with the pair likely descending to the 38.2% Fibonacci retracement level of $591.
Solana Price Analysis
Solana (SOL) fell below the 20-day EMA ($136) on March 28, signaling weak demand from bulls.
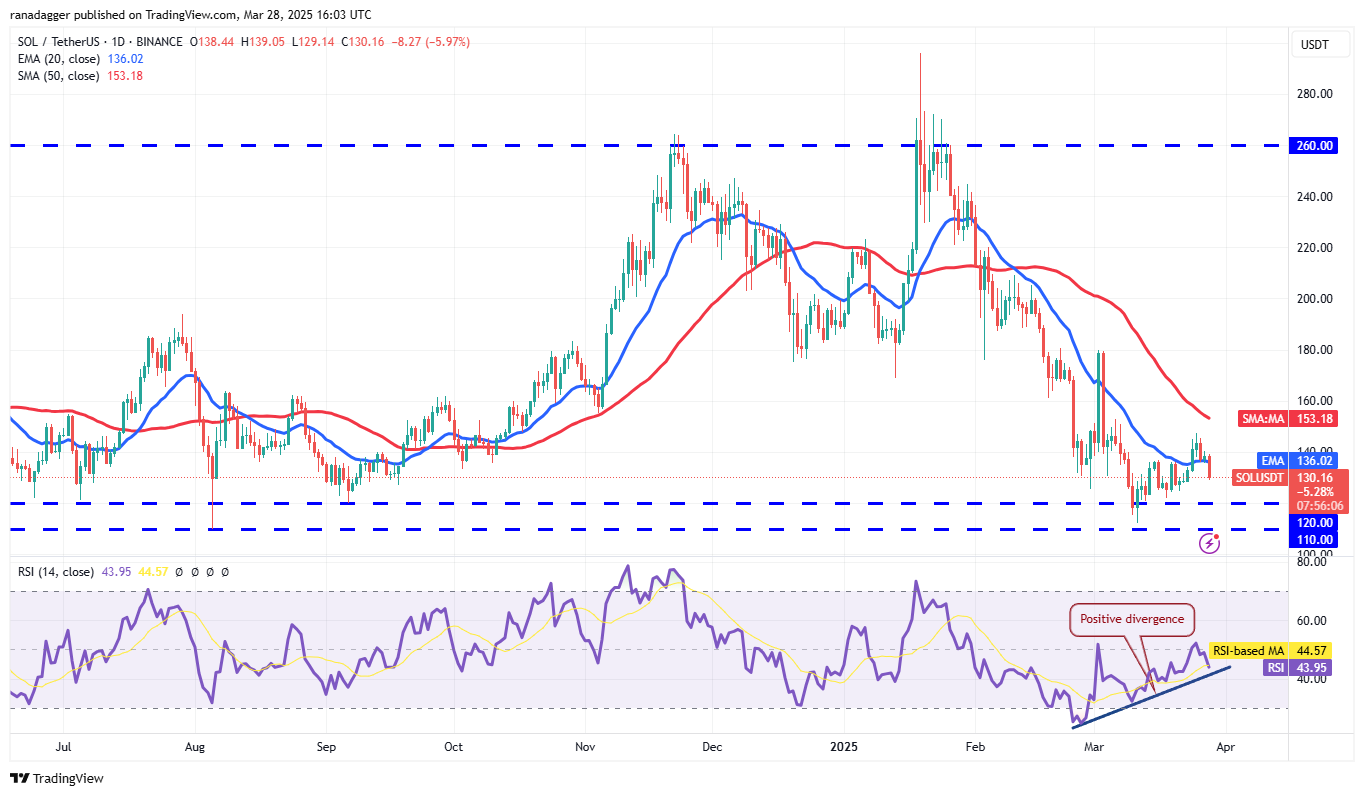
SOL/USDT daily chart.
Sellers will likely aim to push the price down to the support zone between $120 and $110. Buyers are expected to defend this support zone aggressively; a break and close below may result in a downtrend towards $80.
The 50-day SMA ($153) represents critical resistance to monitor. Buyers must push the price above this SMA to indicate that the SOL/USDT pair has potentially formed a bottom at $110, which could lead to a rise to $180.
Dogecoin Price Analysis
Dogecoin (DOGE) turned down from the 50-day SMA ($0.21) on March 26, suggesting negative sentiment persists.
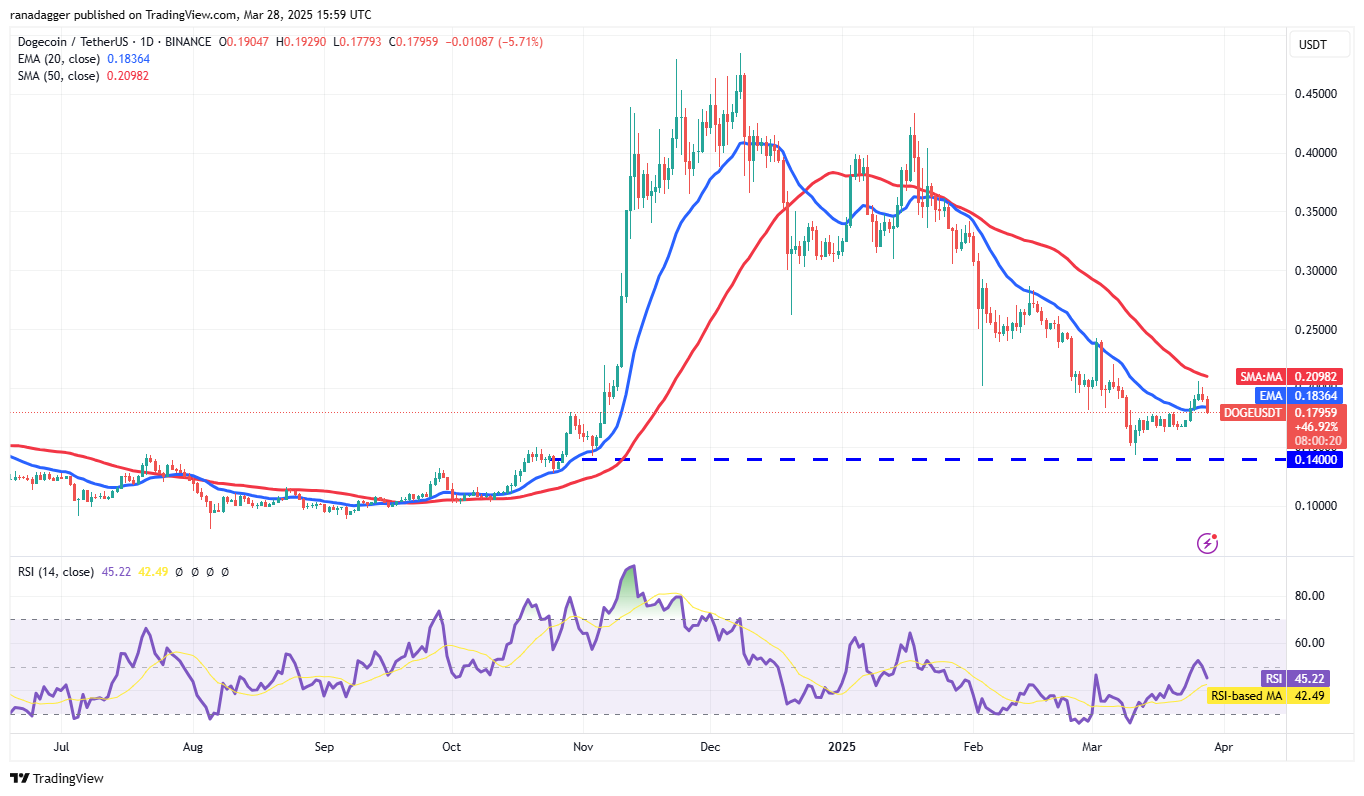
DOGE/USDT daily chart.
The stable 20-day EMA ($0.18) combined with the RSI just under the midpoint indicates a potential range-bound movement in the near future. The DOGE/USDT pair may oscillate between $0.14 and the 50-day SMA for a while.
If the price rises from the current level and breaks above the 50-day SMA, it would indicate bulls are trying to establish a higher low, boosting the likelihood of a breakout above the SMA. This could see the pair ascend to $0.24 and potentially $0.29.
Cardano Price Analysis
Cardano’s (ADA) inability to remain above the 50-day SMA ($0.75) may have triggered profit-taking by short-term traders.
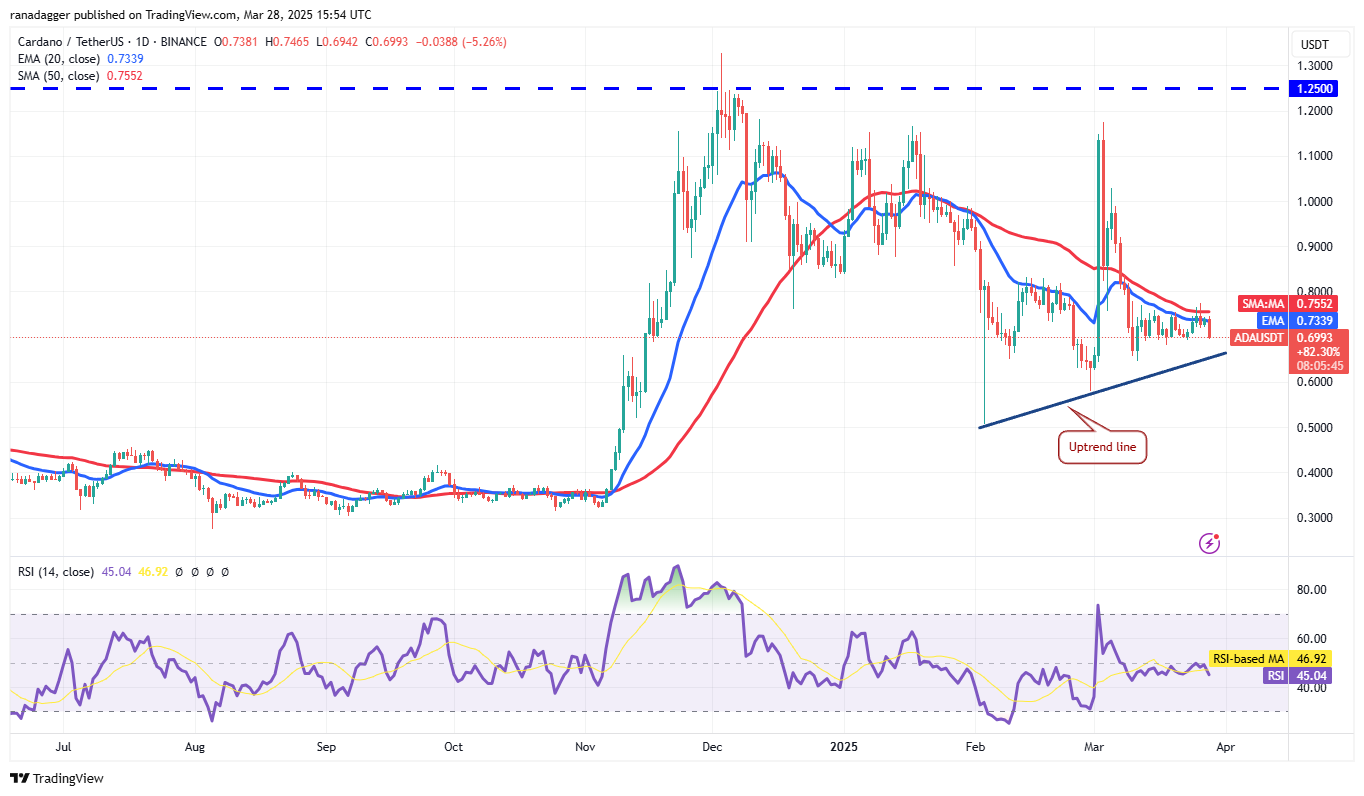
ADA/USDT daily chart.
The ADA/USDT pair may slide to the upward trendline, where buyers are expected to enter. A rebound off this trendline could lead the bulls to attempt to push above the 50-day SMA. If successful, the pair might rise to $0.84 and then to $1.02.
On the other hand, if there is a break and close below the trendline, it suggests that sellers have taken control, causing the pair to drop to the support area between $0.58 and $0.50, which is likely to attract buyers.
Note: This article does not provide investment advice or recommendations. Every investment and trading decision carries risk, and readers should conduct their own due diligence.