The price of Ethereum plummeted by more than 6% on Friday, marking a continuation of its downward trend that initiated on March 24, when it reached a peak of $2,105.
Ethereum (ETH) fell to a low of $1,880, the lowest point recorded since March 18. As a result, it has almost wiped out the gains accumulated over the past two weeks.
The decline in Ether came on the heels of the release of concerning inflation data from the US, indicating that interest rates may remain elevated for a prolonged period. The core Personal Consumption Expenditure Index increased from 2.7% in January to 2.8% in February. Meanwhile, the headline PCE rose to 2.5%, surpassing the Federal Reserve’s target of 2.0%.
These figures suggest that inflation will persist at higher levels for some time, particularly following the implementation of new tariffs. Elevated inflation rates imply that the Federal Reserve could maintain higher interest rates for an extended duration.
This environment is reflected in the decline of other risk assets following the PCE report. The S&P 500 index fell by 1.50%, while the Nasdaq 100 and Dow Jones dropped by 2% and 1.2%, respectively. A majority of cryptocurrencies, including Bitcoin (BTC) and Cardano (ADA), also experienced significant losses.
Additionally, Ethereum’s price fell as the fear and greed index dropped to 25 in anticipation of the new tariffs. Economists warn that these tariffs could lead to a recession, negating some of the economic growth seen during the previous administration.
Moreover, investors on Wall Street seem hesitant to engage as challenges persist for Ethereum. Data reveals that spot Ethereum ETFs saw inflows only once in March, totaling $14.8 million on March 4, and subsequently experienced asset outflows, leaving total assets at a mere $2.4 billion. Overall, all Ethereum ETFs combined hold only $6.86 billion in assets.
Furthermore, Ethereum has been steadily losing market dominance in crucial sectors such as decentralized finance, non-fungible tokens, and decentralized exchanges. It has begun to cede ground to layer-1 chains like Sonic and Berachain, alongside layer-2 networks such as Base and Arbitrum.
Technical Analysis of Ethereum Price
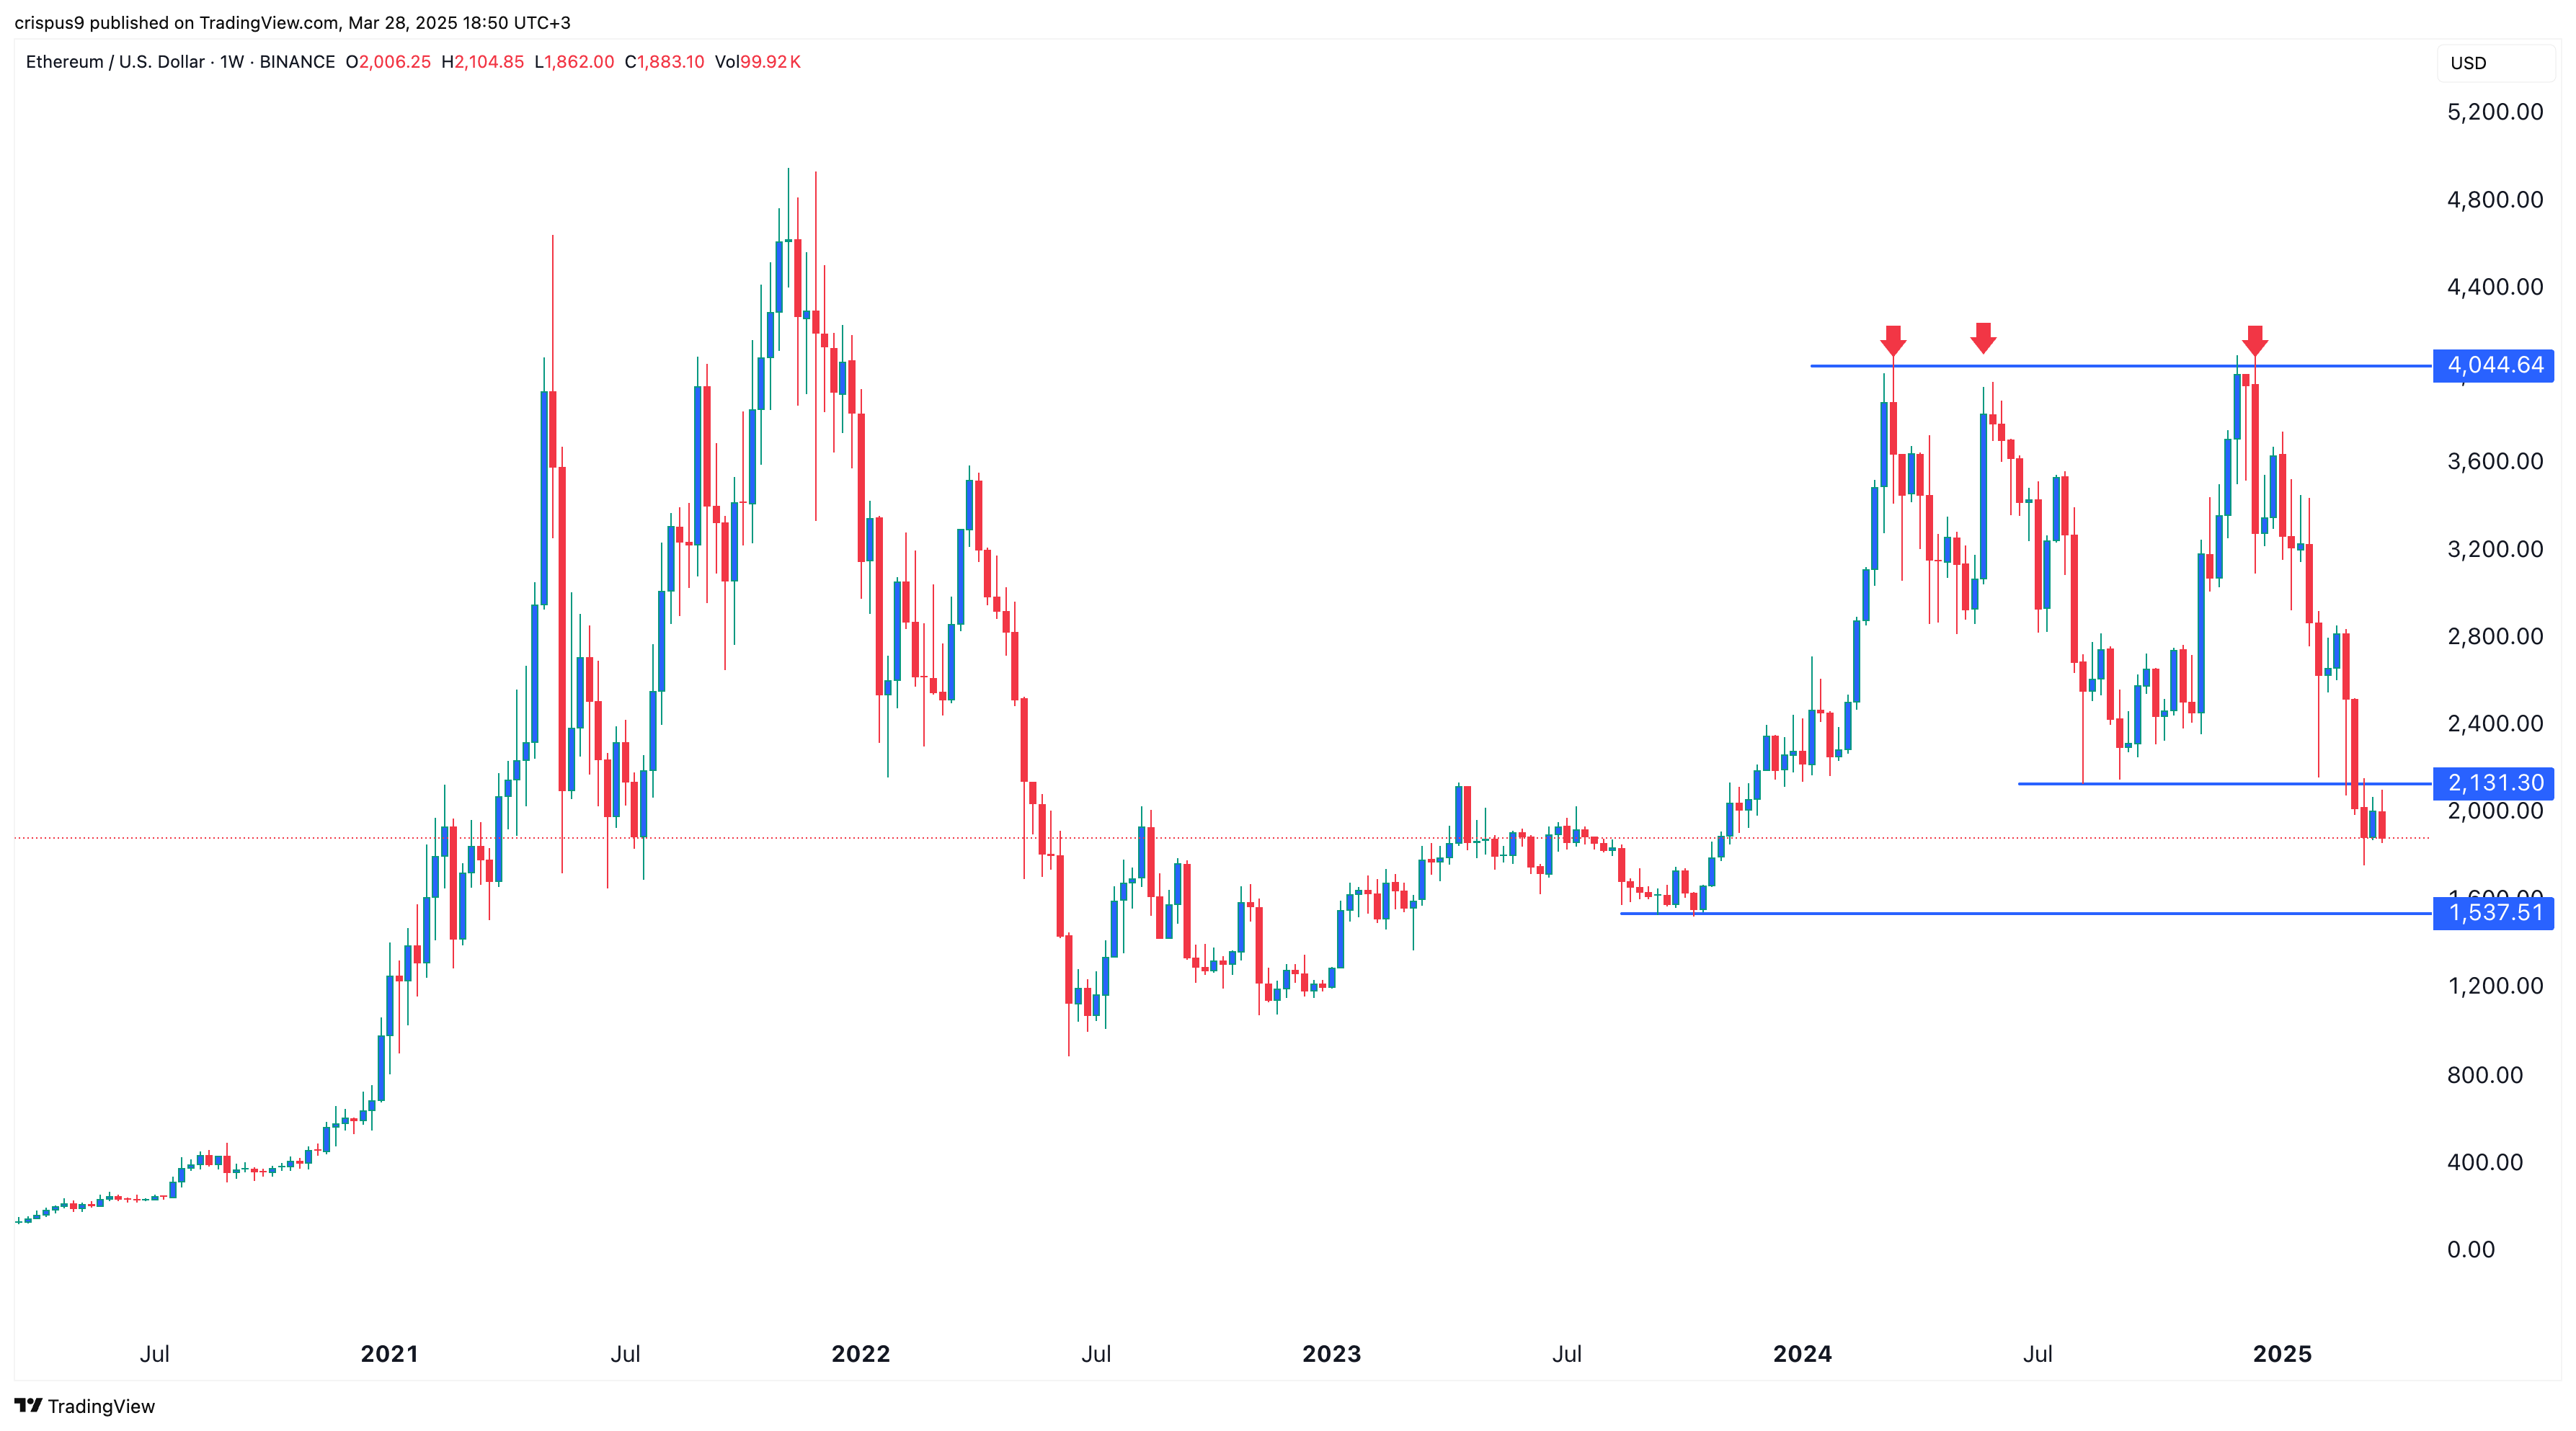
The drop in ETH price can also be attributed to technical factors. The weekly chart indicates the formation of a triple-top pattern at $4,000 with a neckline established at $2,130, the lowest level recorded last August.
Ethereum traded below this neckline earlier this month and has made a retest in recent days. A break-and-retest pattern is commonly viewed as a signal for continuation. Additionally, a bearish flag pattern has emerged, consisting of a vertical line and subsequent consolidation.
Consequently, there is a possibility that the coin could decline to $1,537, which was its lowest point on October 9. A movement above the resistance level at $2,131 would negate the bearish outlook.