The TUT cryptocurrency surged by as much as 235% today following community votes that secured it a spot on the Binance exchange.
As per data, Tutorial (TUT) jumped from $0.0167 to a peak of $0.0564 during the day, before settling back to $0.0396 by Friday afternoon in Asia. This movement extended its weekly gains to an astonishing 2,600%, positioning it among the top-performing altcoins for this period.
The upward movement was supported by significant trading activity, as on-chain data revealed a 600% rise in daily volume, surpassing $189 million. TUT’s market capitalization reached $38.5 million. There was also notable interest from derivatives traders, with reports indicating a 400% increase in open interest for TUT futures, hitting $73.59 million at the time of writing.
The day’s gains were primarily driven by excitement within the community following TUT’s listing on Binance. It was selected in the initial round of the exchange’s “Vote to List” initiative, alongside other meme cryptocurrencies such as Mubarak (MUBARAK), CZ’s Dog (BROCCOLI714), and Banana For Scale (BANANAS31).
According to the official announcement from the platform, these meme coins, which are exempt from listing fees, can now be traded against USDT and USDC pairs. Withdrawals are set to begin on March 28 at 21:00 UTC. A seed tag has been applied to them.
Traders appear to be split regarding future movements. Some speculate that a sell-off could be on the horizon—a typical scenario following a significant exchange listing, as hype is often factored into the price prior to the listing becoming official.
Previously, after being listed on KuCoin, Gate.io, and Bitget on March 20, TUT experienced a rise of over 330%, reaching a peak of $0.057. However, this surge was short-lived as the token lost nearly half its value within 24 hours as early investors took profits.
Nonetheless, not all market participants are pessimistic. Technical analysts like gemxbt_agent highlight a potentially bullish chart structure.
In a post from March 27, they noted that TUT had recently broken out of a consolidation pattern, suggesting a possible double-bottom reversal. They identified key support around $0.03, with potential target levels ranging from $0.06 to $0.065.
TUT Price Analysis
On the 4-hour chart (TUT/USDT), the price recently produced a notable candle followed by several red candles, typically indicating some selling pressure following the initial pump.
However, the Supertrend indicator has recently turned green and remains above the price, suggesting that bullish momentum may still persist, potentially allowing for another upward movement.
The MACD indicator looks robust as well, with the MACD line crossing above the signal line. Furthermore, the Chaikin Money Flow suggests that new capital is still entering TUT.
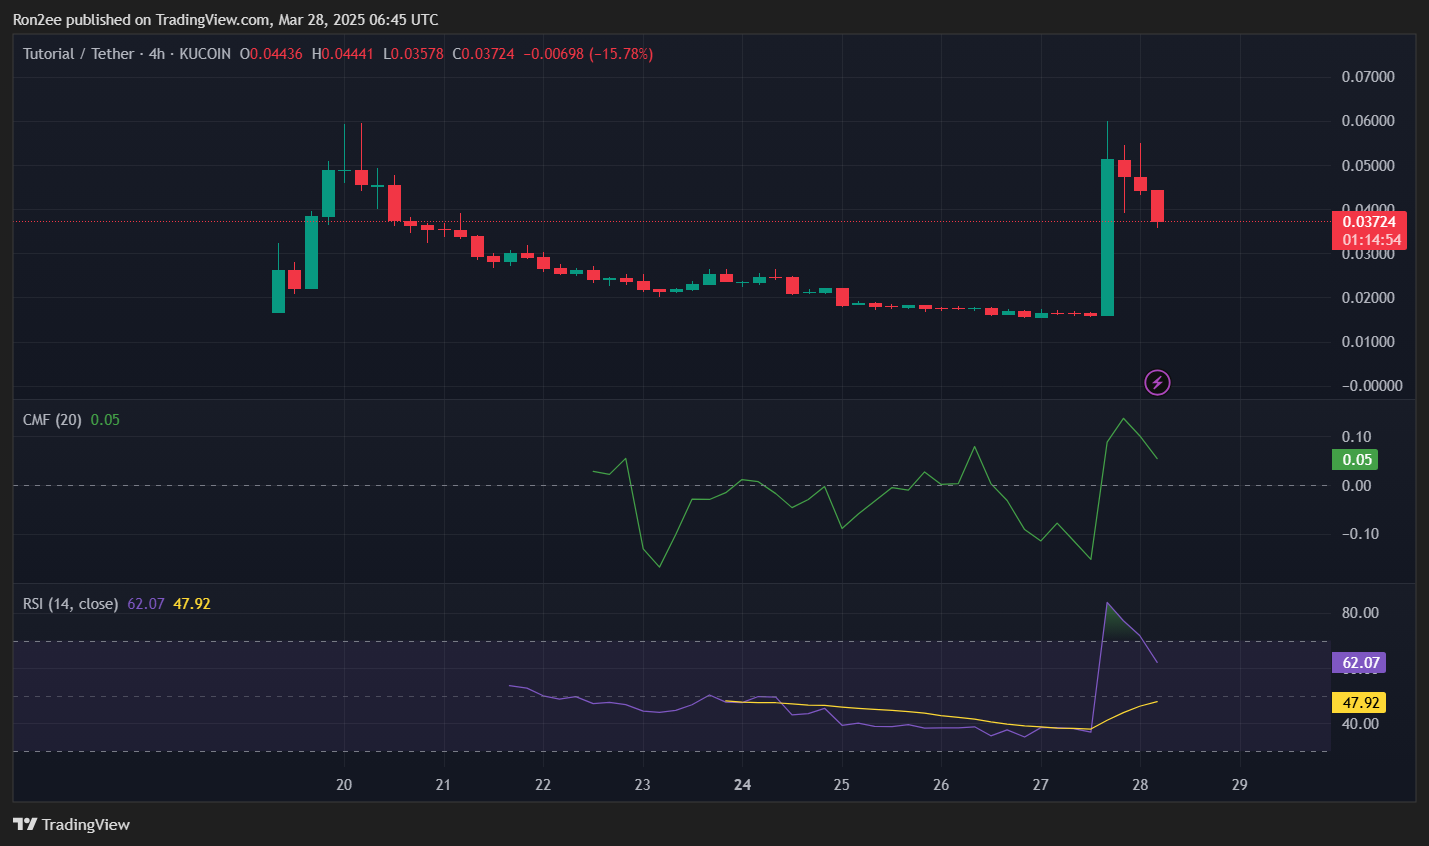
Meanwhile, the RSI has somewhat stabilized, dropping back to around 60 after reaching overbought territory. This could indicate that selling pressure is subsiding, providing bulls with an opportunity to regain control.
If the momentum sustains, TUT might attempt another rise toward the $0.06 resistance level, which it previously struggled to surpass on March 20.
That said, there may be another wave of selling before achieving that level. According to CoinGlass, TUT’s weighted funding rate was negative at the time of writing, indicating that most derivatives traders were anticipating a price correction.
Disclosure: This article does not constitute investment advice. The information and materials provided on this page are intended for educational purposes only.