The price of Bitcoin (BTC) has seen a decrease of more than 2.5% in the past 24 hours, settling at $85,100, as recent tariffs imposed by Trump exert continued pressure on global markets and cryptocurrencies.
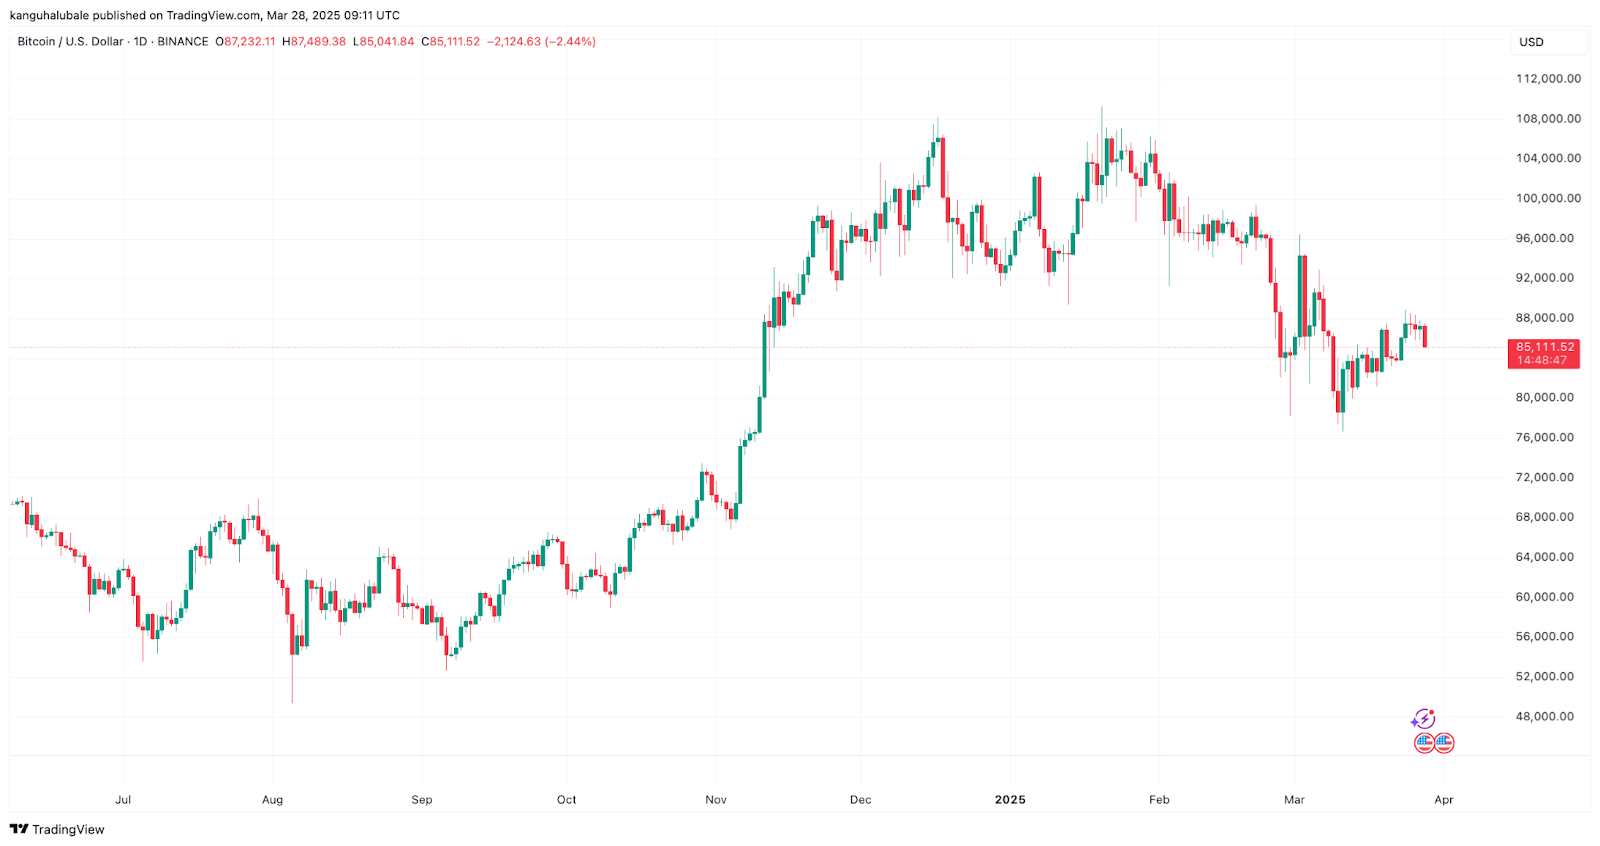
Daily chart of BTC/USD.
Key points:
-
Bitcoin’s decline follows President Trump’s announcement regarding tariffs on automobiles.
-
Bitcoin’s fall aligns with declines in US equities, highlighting a strengthening correlation.
-
Bearish predictions for BTC emerge as trader sentiment becomes increasingly negative.
Bitcoin’s price drops alongside risk assets
The persistent drop in BTC’s value reflects broader declines in the risk-on market amid challenging macroeconomic conditions.
Key observations:
-
The total market cap of the cryptocurrency sector has decreased more than 2.6% in the last 24 hours, coinciding with sell-offs in US equities.
-
The S&P 500 fell 0.33% to conclude at 5,693.31 on March 27, while the Nasdaq composite index slid 94 points (-0.53%).
-
The Dow Jones index experienced a loss of 0.37%, finishing the trading day on March 27 at 42,299.70.
-
This reaction comes after President Trump declared a 25% tariff on all imported vehicles, set to take effect on April 2, 2025.
-
Earlier in March, Trump had implemented 25% tariffs on all goods imported from Mexico and Canada, as well as 10% tariffs on imports from China.
-
Canada and Mexico have expressed intentions to introduce retaliatory tariffs on US goods, escalating trade tensions and raising fears of a potential trade war.
“Markets are bracing for Trump’s April 2nd day of reciprocal tariffs to bring clarity,” noted a market commentator in a post on X on March 26.
Related: ‘Bitcoin Macro Index’ signals cast doubt on $110K BTC price return
This commentator also expressed skepticism, predicting a drawback, especially as tech stocks have lost over $400 billion in just a week.
“The trade war is back.”
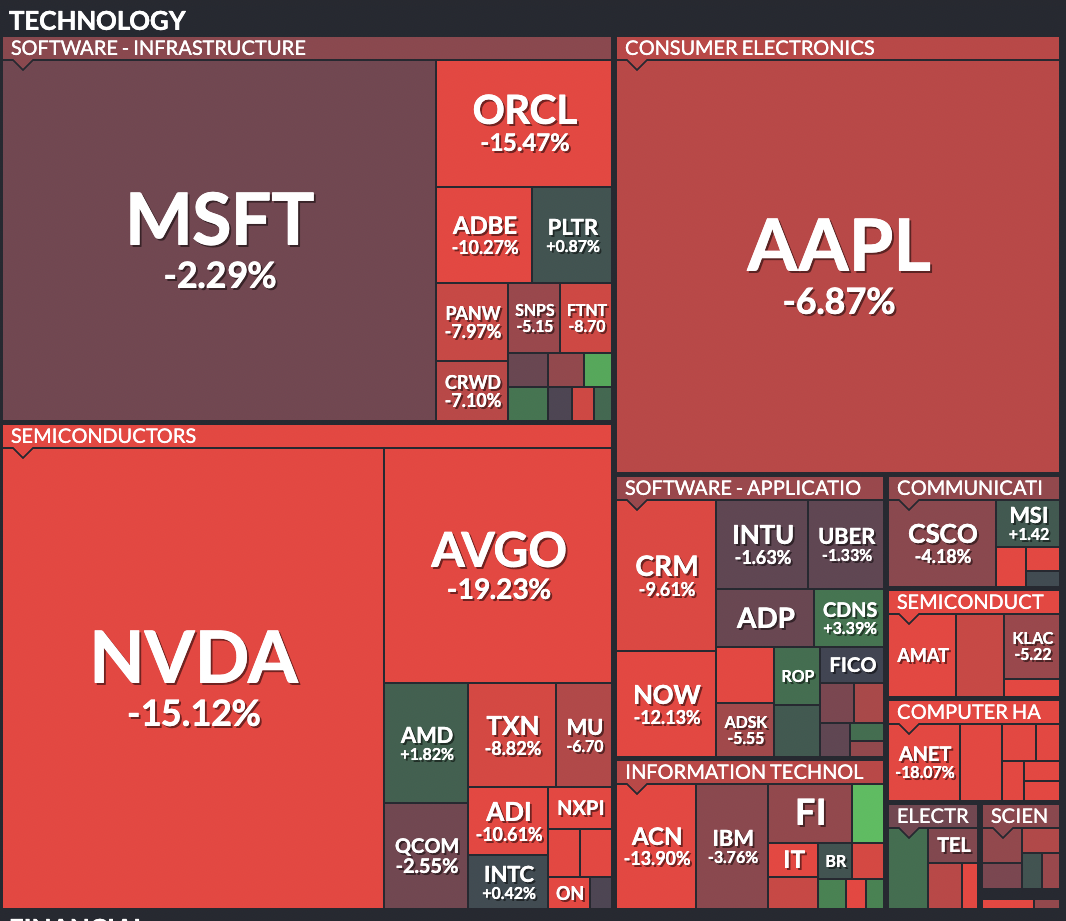
30-day performance overview of US tech stocks.
-
In the short term, Bitcoin is considered a risk asset, typically declining when traditional markets struggle.
-
Historically, both Bitcoin and leading altcoins have faced declines during economically turbulent times, such as during the COVID-19 sell-off in March 2020.
-
As of March 28, the weekly correlation between BTC and US stocks stood at 0.88.
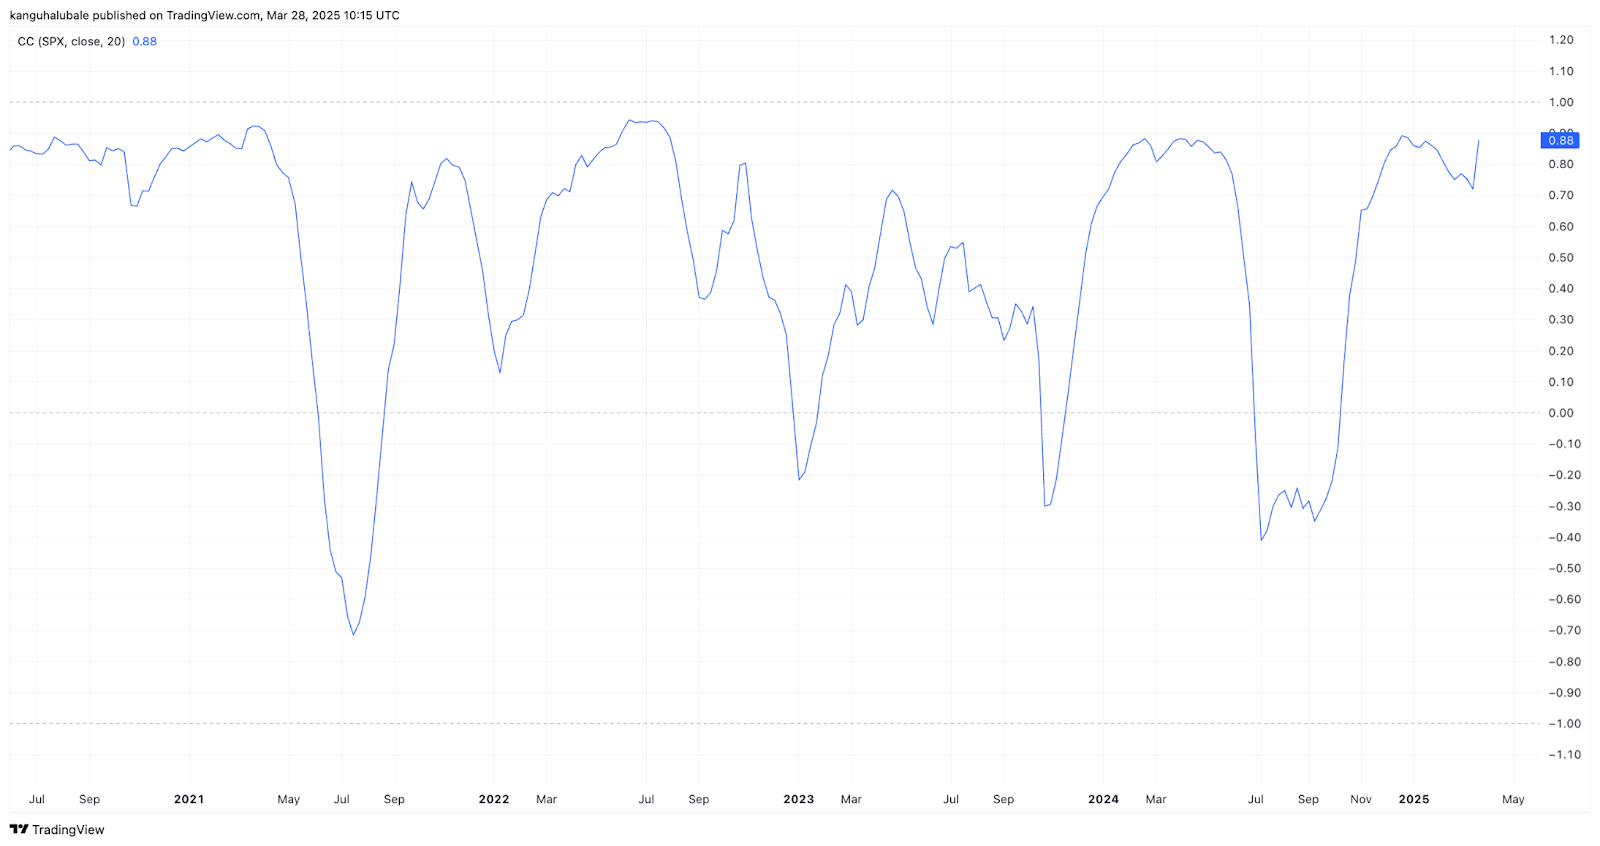
Weekly correlation between Bitcoin and the S&P 500.
Bitcoin traders prepare for a potential drop below $80K
“Bitcoin is falling below the weekly open” at $86,000, he mentioned in a post on X discussing the hourly chart.
“It seems $BTC has made its decision and is heading towards the monthly open and maximum pain for options expiry.”
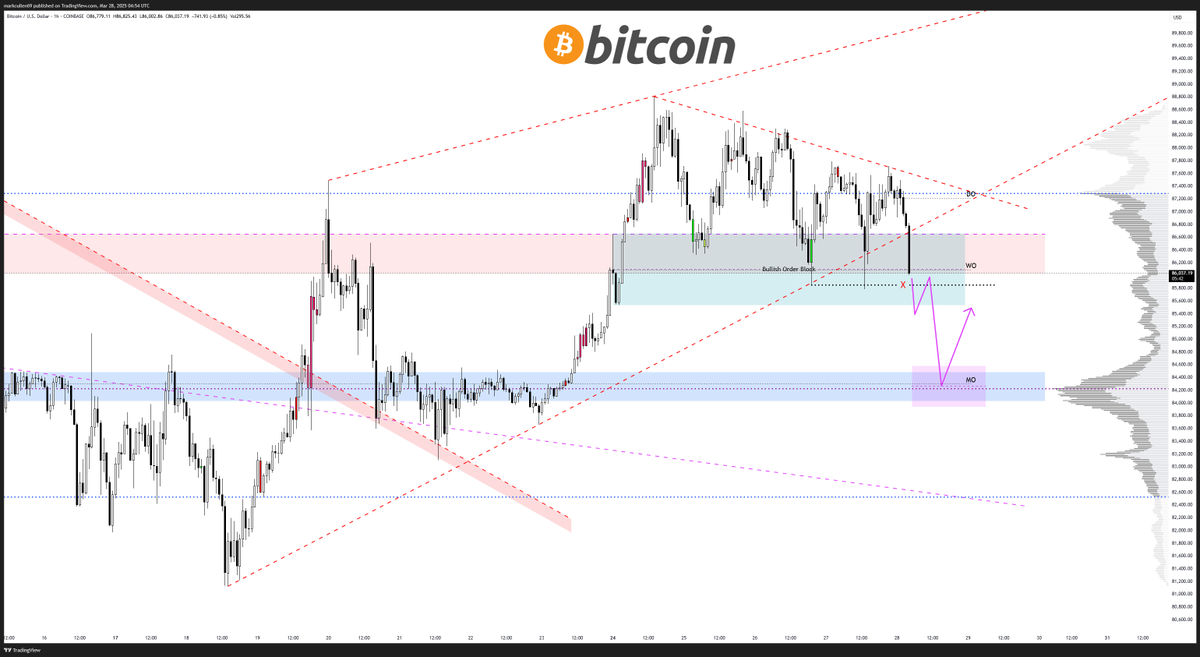
Hourly chart of BTC/USD.
AlphaBTC pointed to the March 1 open at $84,300, warning that BTC must maintain this level to prevent an unfavorable month-end outcome and risk further declines.
Others suggest adopting a long-term perspective amid the heightened volatility, with Bitcoin rising only 1.6% in March at the time of writing.
“BTC’s range breakdown might be gradual,” noted fellow trader Daan Crypto Trades in part of his commentary on X.
This decline coincides with the “largest equity sell-off since the Yen Carry Trade issues,” he further explained regarding BTC’s price behavior during the last range sweep in August 2024.
Daan Crypto Trades stated Bitcoin needs to surpass $90,000 to affirm that the range sweep was merely a shakeout, as this area remains a critical resistance level.
“Prices will continue to be heavily influenced by news, and with April 2 (Tariff/Liberation Day) on the horizon, volatility is assured. I wouldn’t be surprised if we linger around the mid-80Ks for a while until the situation stabilizes.”
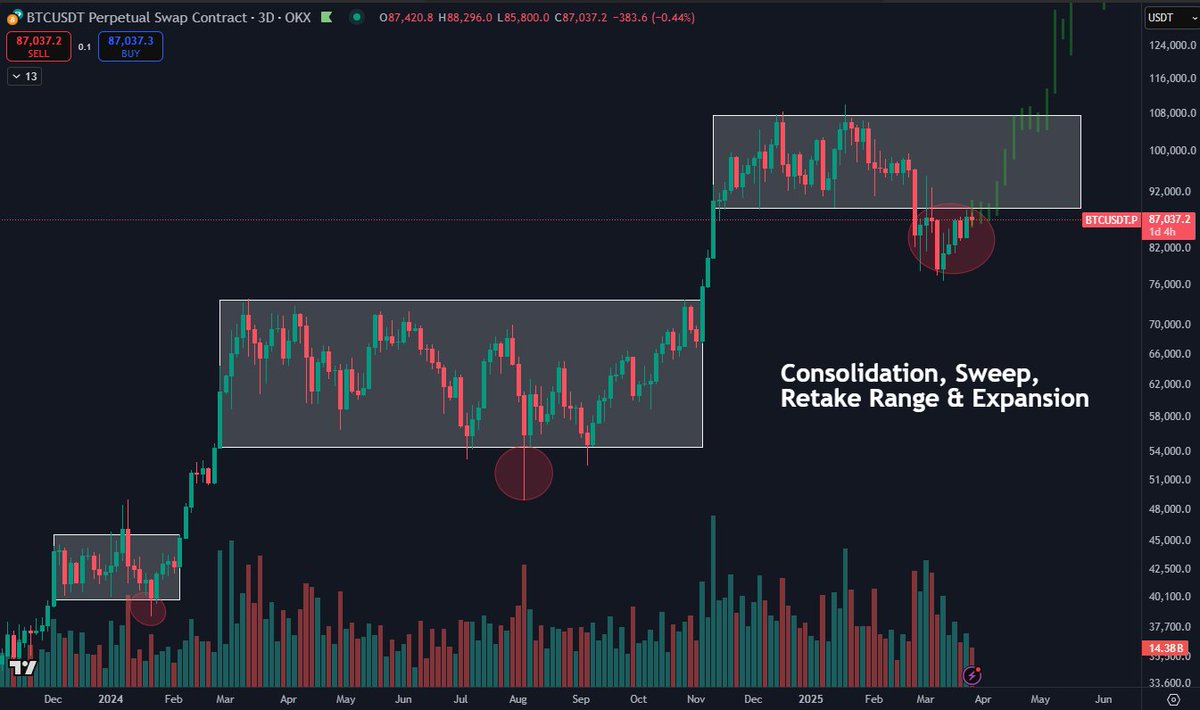
Three-day chart of BTC/USD.
Nevertheless, more bearish forecasts have surfaced from those cautious of macroeconomic implications. Analyst and capital markets expert Michael van de Poppe thinks Bitcoin is starting to “appear slightly less favorable,” indicating that a retest of the $78,000-$80,000 range may be imminent if the support at $84,000 fails.
The overall trend for $BTC remains upward, but it does seem to be losing strength.
It’s wobbling.
If it drops below $84K, I reckon we’ll test the $78-80K range, and perhaps even lower before a rebound. pic.twitter.com/nZaweAv9nv
— Michaël van de Poppe (@CryptoMichNL) March 28, 2025
This article is not intended as investment advice or recommendations. All investment and trading decisions carry risk, and readers should perform their due diligence before making any choices.
