Bitcoin (BTC) enthusiasts are attempting to initiate a recovery, but ongoing selling at elevated levels consistently thwarts their efforts to reach the upper boundaries of the trading range. Seasoned trader Peter Brandt mentioned in a post that Bitcoin has fallen from a bear wedge formation, which sets a target of $65,635.
The current macroeconomic landscape and concerns over a protracted trade war have led to a 40% likelihood of a recession by 2025, according to Nic Puckrin, founder of Coin Bureau. He noted that a potential recession and the prevailing macroeconomic volatility could exert pressure on speculative assets, including cryptocurrencies.
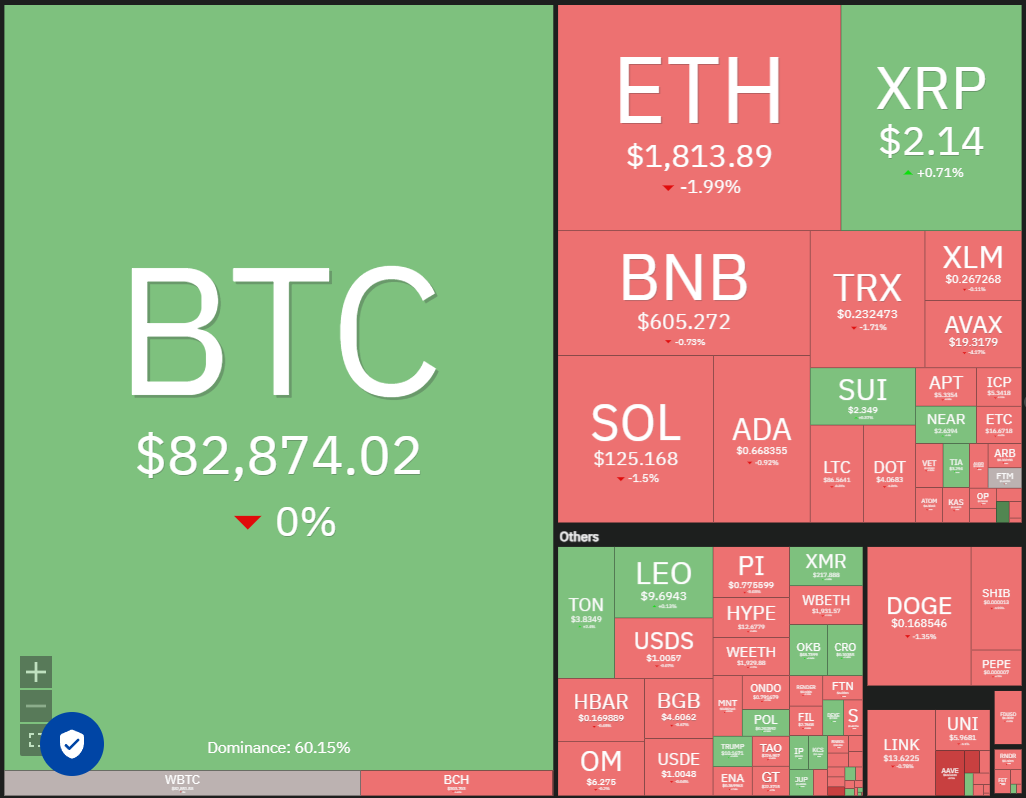
Daily cryptocurrency market data overview.
Nonetheless, the outlook for Bitcoin isn’t entirely gloomy in the short term. Analyst Stockmoney Lizards suggested in a recent update that Bitcoin’s local bottom might fall between $82,000 and $80,000. They predict a potential reversal for Bitcoin in the upcoming week.
Should Bitcoin begin its recovery, specific altcoins are expected to rally as well. Let’s analyze the charts of leading cryptocurrencies displaying bullish tendencies.
Bitcoin Price Analysis
Bitcoin’s inability to break through the resistance line may have prompted traders to sell. The bears will likely attempt to drive the price down toward the crucial $80,000 support level.
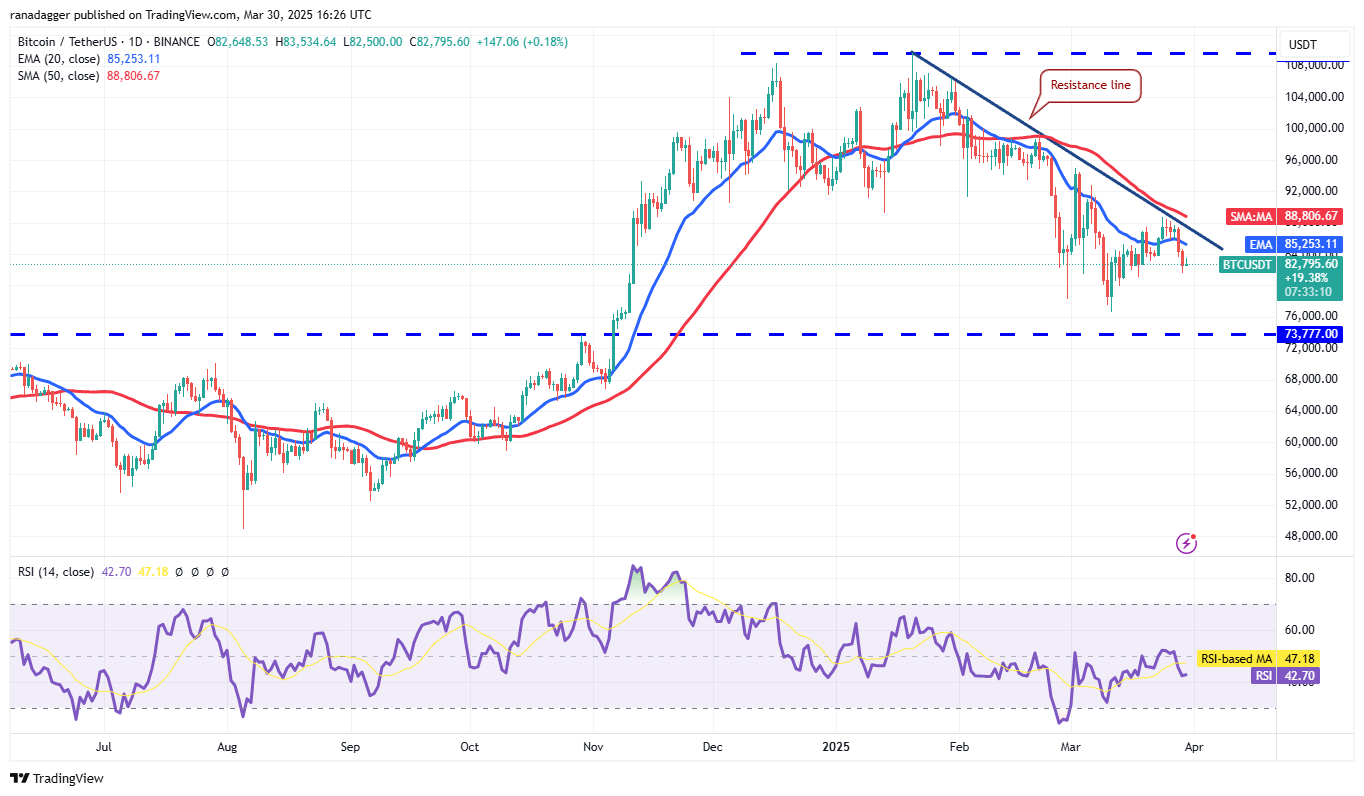
BTC/USDT daily chart analysis.
The 20-day exponential moving average ($85,253) is rather flat, and the relative strength index (RSI) sits slightly below the midline, favoring the bears. If the $80,000 support level fails, the BTC/USDT pair might dive to $76,606.
Conversely, if the price starts to rise from its current position or from $80,000, it could enhance the chances of breaking above the resistance line. Such a development would indicate the end of the corrective phase, potentially allowing the price to rally to $95,000 and eventually reach $100,000.
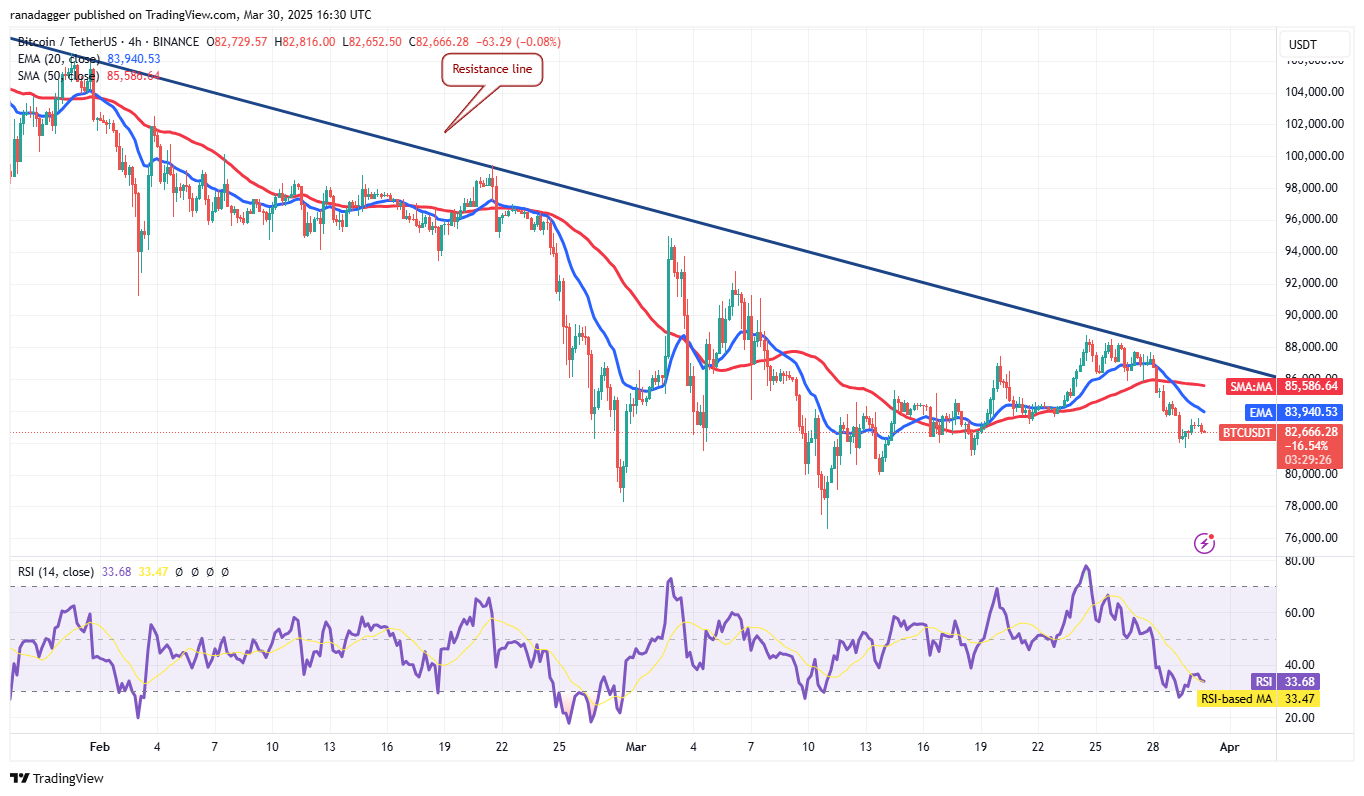
BTC/USDT 4-hour chart analysis.
The 20-EMA on the 4-hour chart is declining, and the RSI is in negative territory, indicating bears have the upper hand. If the price retreats from the current level, the pair could drop to $80,000 and possibly to $78,000.
Buyers must push and sustain the price above the 20-EMA to indicate strength. If they can succeed, the price may rise to the resistance line, an essential watchpoint. Bullish momentum is anticipated to commence above $89,000.
Toncoin Price Analysis
Toncoin (TON) rebounded off the moving averages on March 30, reflecting positive market sentiment.
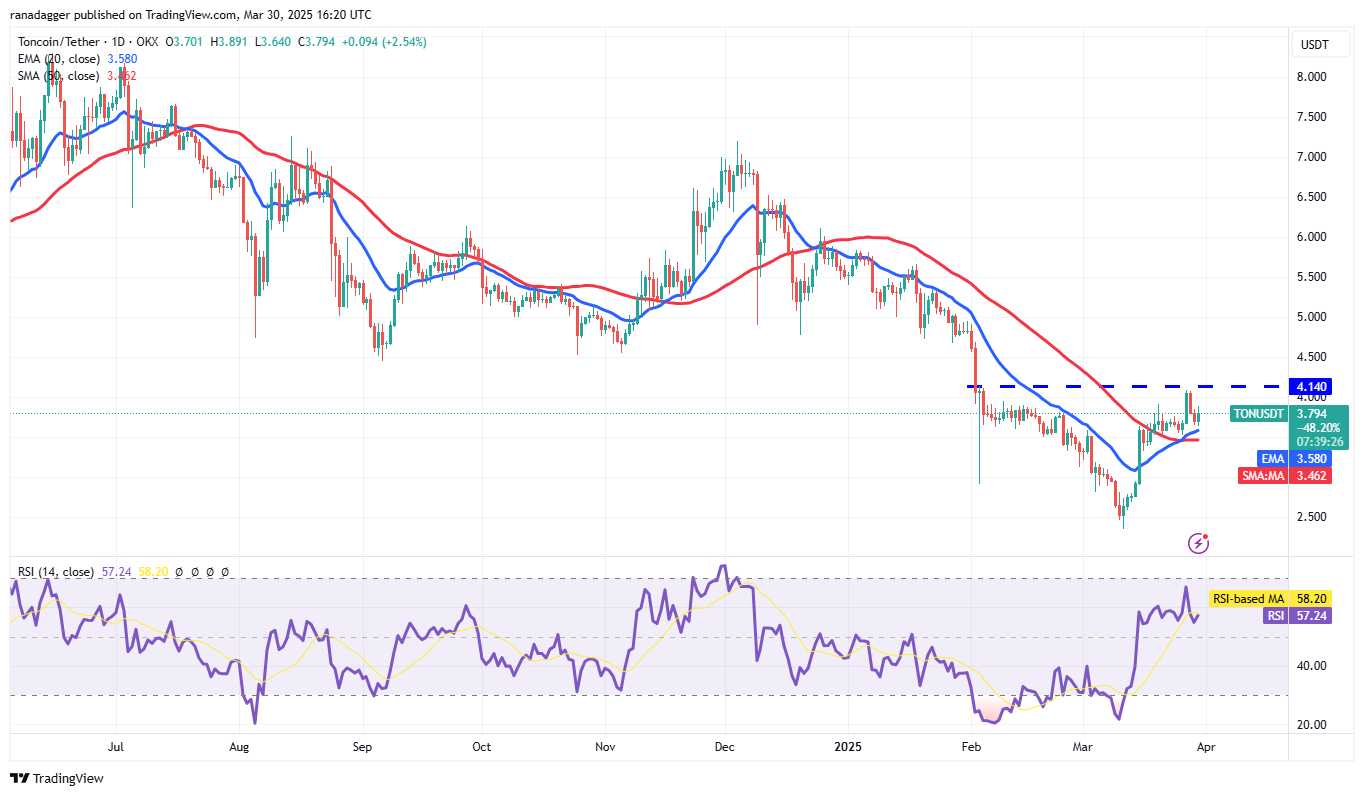
TON/USDT daily chart analysis.
The rising 20-day EMA ($3.58) and the RSI positioned in the positive zone suggest a favorable outlook for buyers. The bulls will seek to strengthen their position by pushing the price above $4.14. If successful, the TON/USDT pair may initiate a fresh upward move toward $5, followed by $5.65.
Sellers will need to push the price below the $3.3 support to reclaim control. Such a move would indicate that bears are still looking to sell during rallies, leading the pair down to $2.81 and subsequently to $2.64.
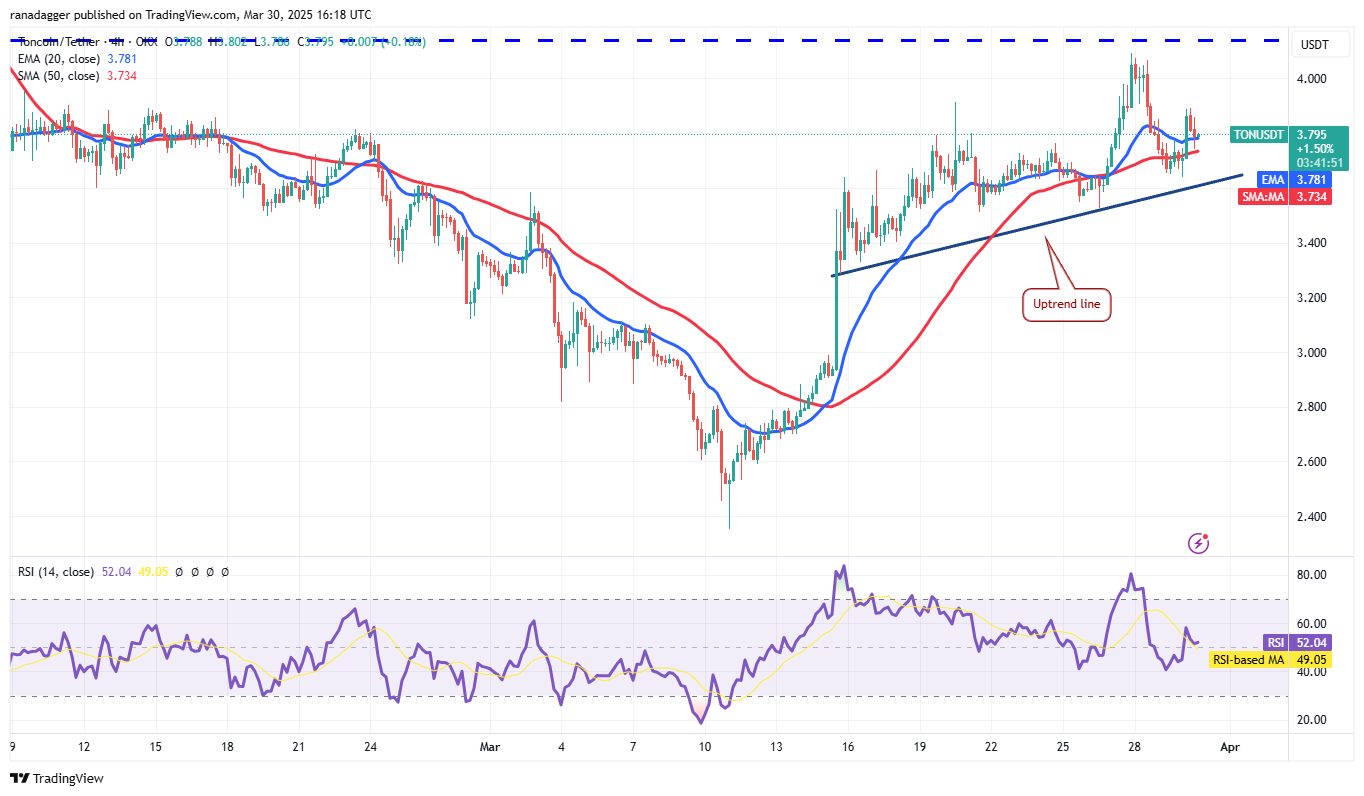
TON/USDT 4-hour chart analysis.
The pair has rebounded from the uptrend line, suggesting that bulls perceive dips as buying opportunities. The pair could target the overhead resistance at $4.14, where bears are likely to oppose. However, if buyers break through this resistance, the pair may embark on a new upward trajectory toward $5.
If sellers manage to push the price below the uptrend line, they would regain control, and the pair may then fall to $3.28.
Cronos Price Analysis
Cronos (CRO) broke above the moving averages on March 24, signaling a potential end to the downtrend.
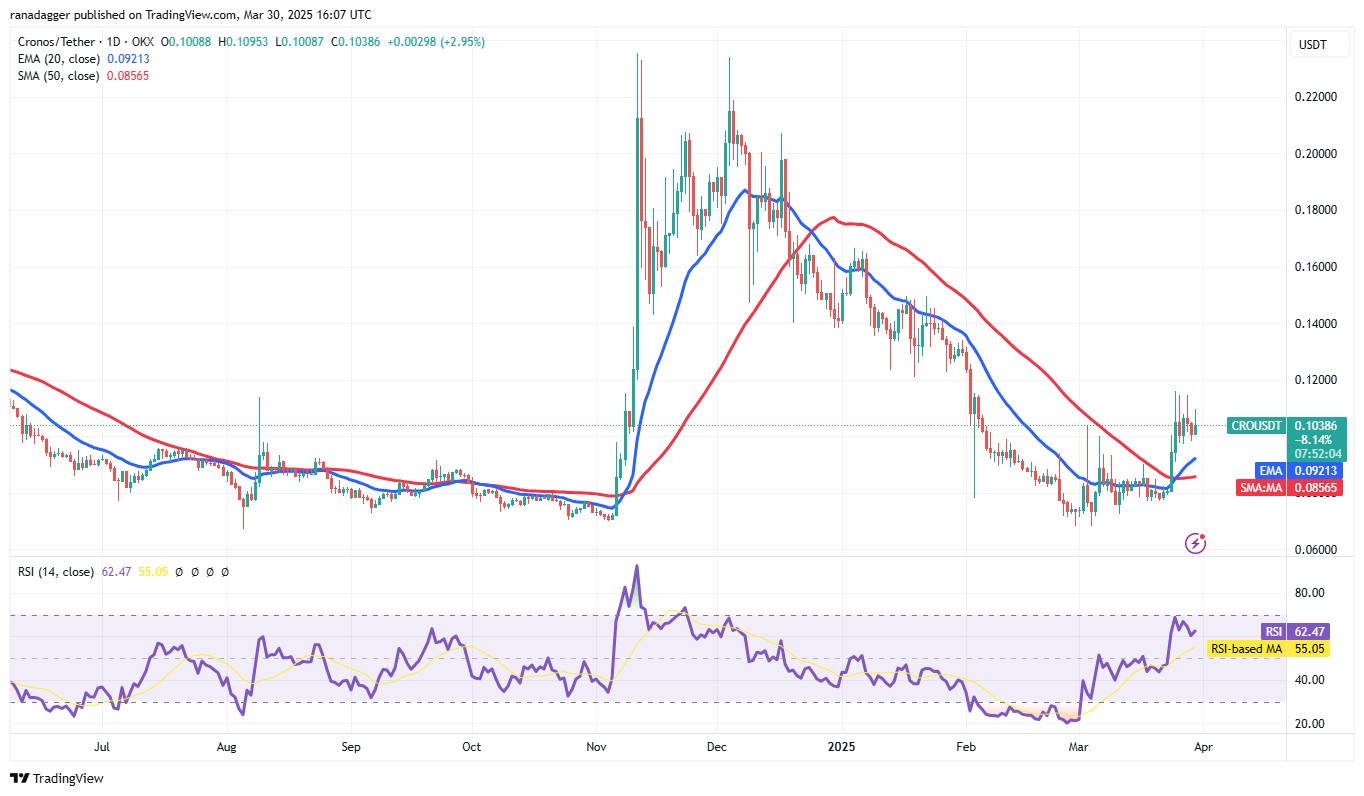
CRO/USDT daily chart analysis.
The CRO/USDT pair is encountering selling pressure near $0.12, but a positive development for bulls is that they have managed to maintain the price above the $0.10 support. This suggests that buyers are trying to establish a higher low. If they succeed in pushing the price above $0.12, the pair could rally toward $0.14.
However, sellers might have a different plan. They will attempt to drive the price below the moving averages to trap aggressive buyers.
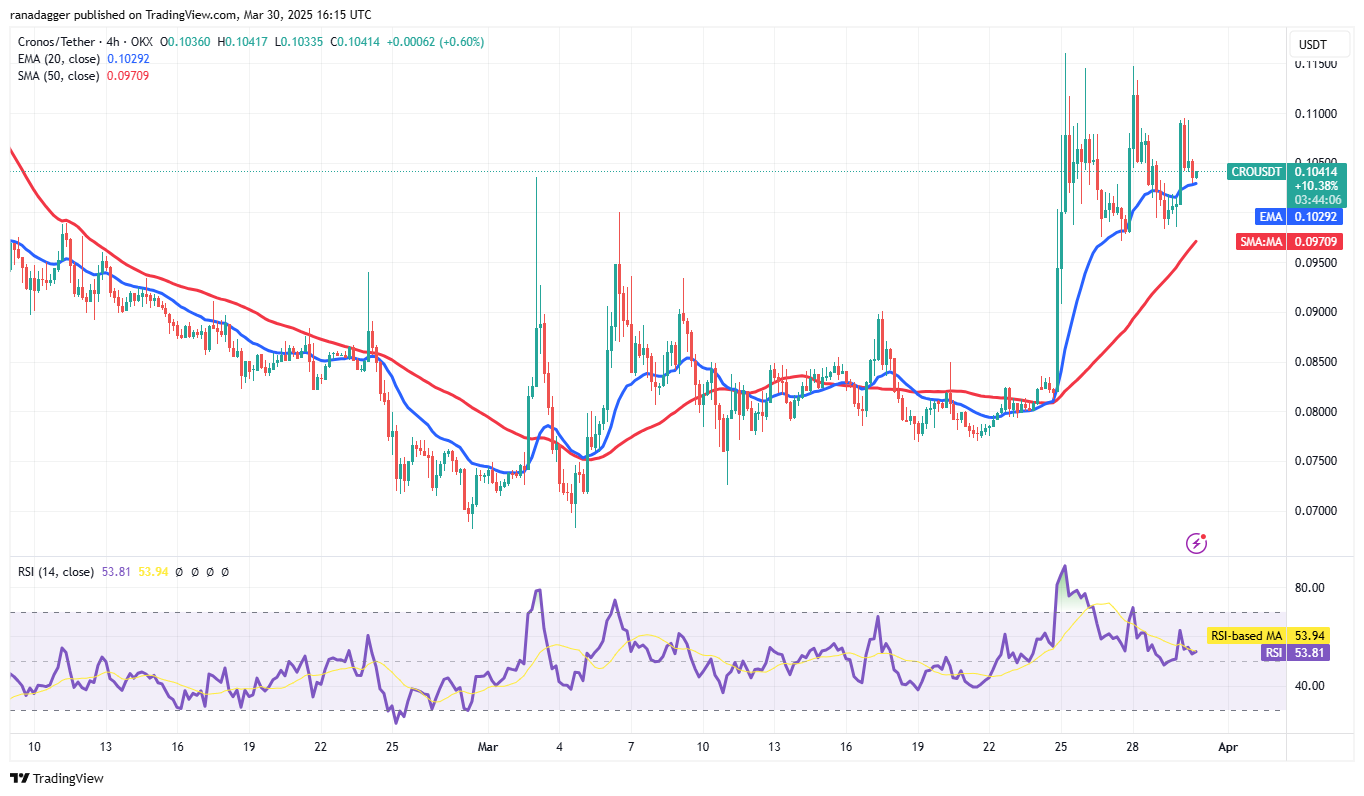
CRO/USDT 4-hour chart analysis.
The pair is currently trading in a range between $0.10 and $0.12, reflecting indecision among bulls and bears. The 20-EMA is gradually sloping upwards, and the RSI is just above the midline, slightly favoring bulls. A close above $0.11 would heighten the chances of a rally beyond $0.12.
Sellers would regain control if they manage to sustain the price below the 50-SMA, possibly dragging the pair down to $0.08.
Mantle Price Analysis
Mantle (MNT) struggled to rise above the 50-day SMA ($0.84) recently, but a positive indicator is that bulls are trying to keep the price above the 20-day EMA ($0.80).
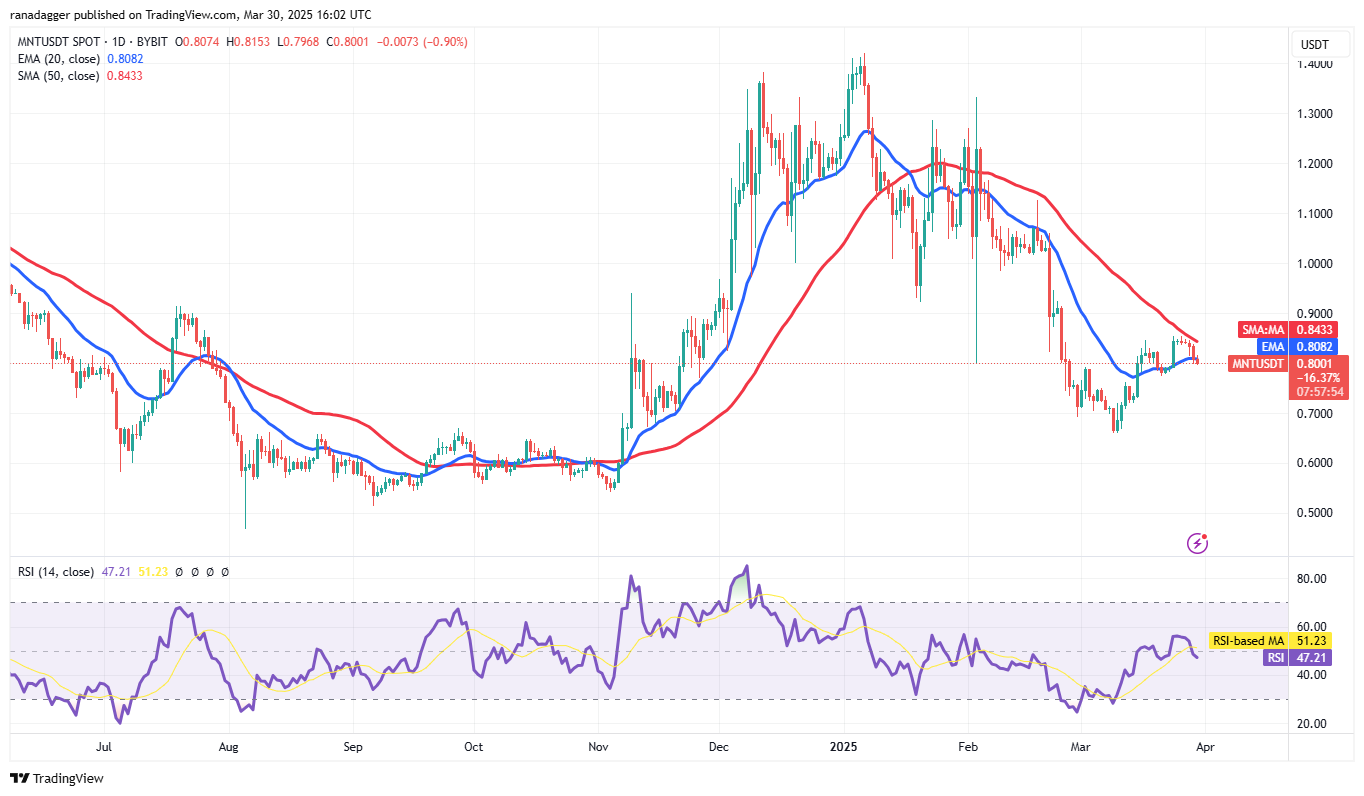
MNT/USDT daily chart analysis.
If the price bounces off the 20-day EMA with strength, it would signal a shift in sentiment from selling into buying on dips. This would improve the chances of a break above the 50-day SMA. If that occurs, the MNT/USDT pair could rise to $0.94 and eventually to $1.06.
On the contrary, if the price continues to decline and falls below $0.77, it would favor bears in the short term. The pair might then drop to $0.72, postponing the anticipated upward movement.
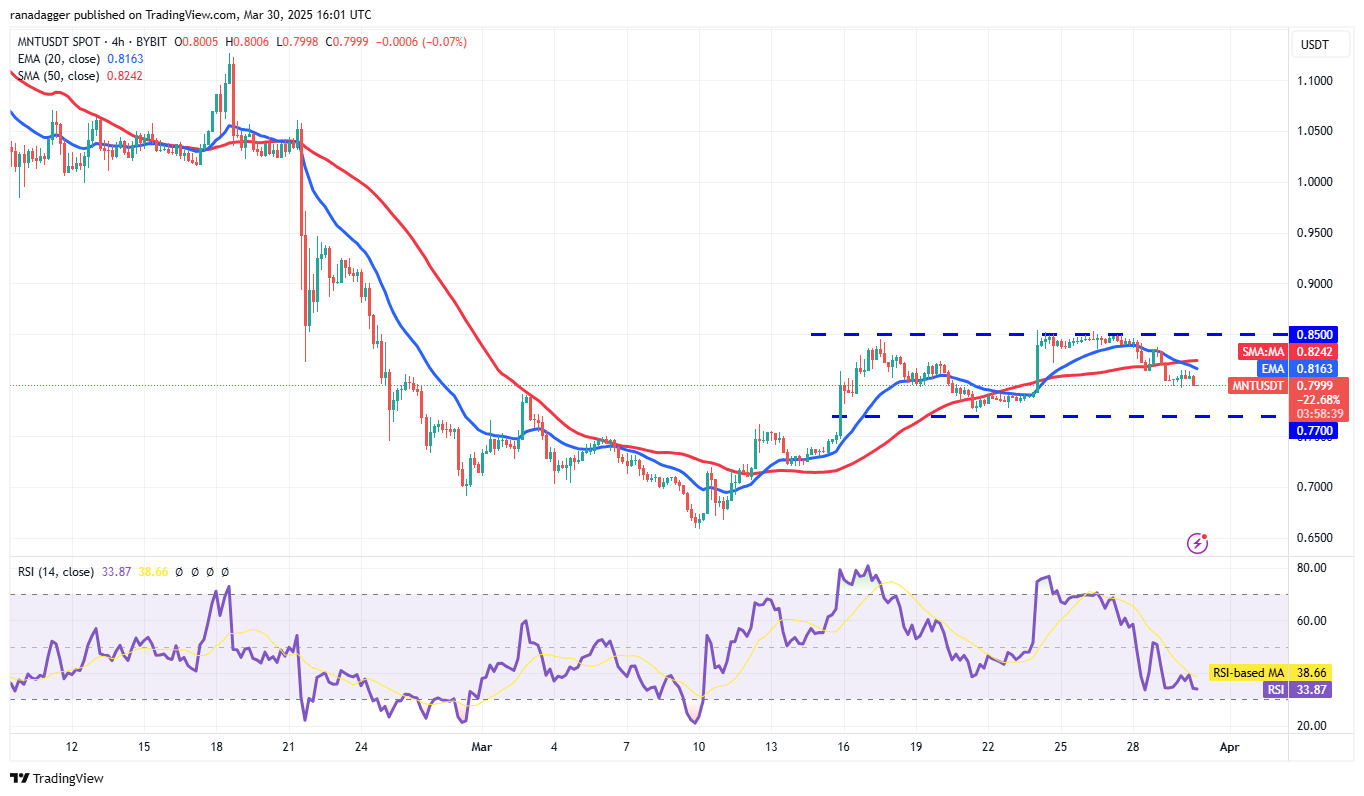
MNT/USDT 4-hour chart analysis.
The 4-hour chart shows significant resistance at $0.85. The pair may decline to $0.77, which is a critical support level to monitor. If the price rebounds from $0.77, it will indicate that bulls are buying on dips. The pair may then trade between $0.77 and $0.85 for a while. A break and close beyond $0.85 could propel the pair toward $0.95.
Sellers will need to push the price below $0.77 to take charge. That could lead to a drop toward $0.69.
Render Price Analysis
Render (RNDR) has been in a significant downtrend for several weeks, but bulls managed to push the price above the 50-day SMA ($3.77) on March 25, indicating demand at lower levels.
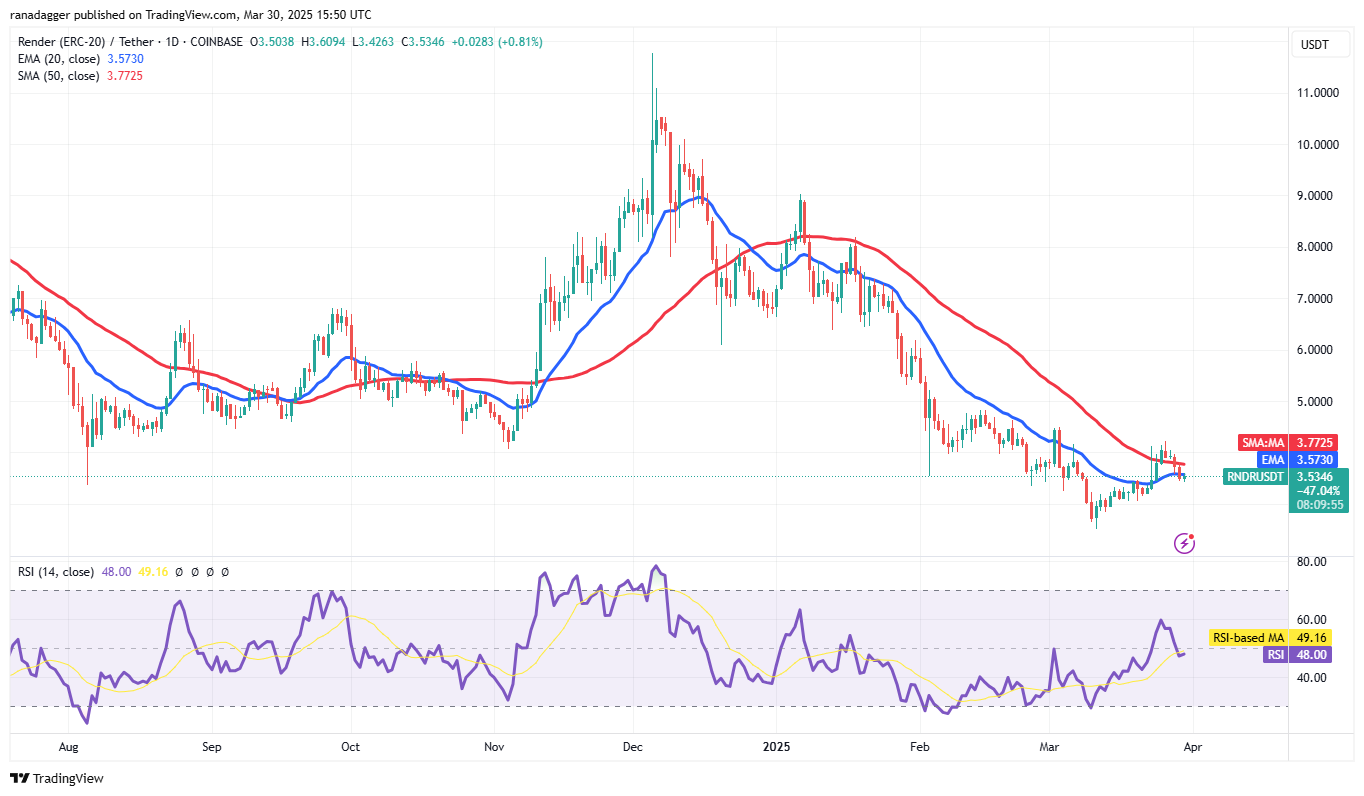
RNDR/USDT daily chart analysis.
The bears have driven the price down to the 20-day EMA ($3.57), an essential level to watch. If the price rebounds strongly from the 20-day EMA, the bulls will aim to push the RNDR/USDT pair to $5 and then to $6.20.
This optimistic view would be negated if the price continues downward and closes below $3.05, indicating strong selling at higher levels. In that case, the pair could decrease to $2.83 and later to $2.52.
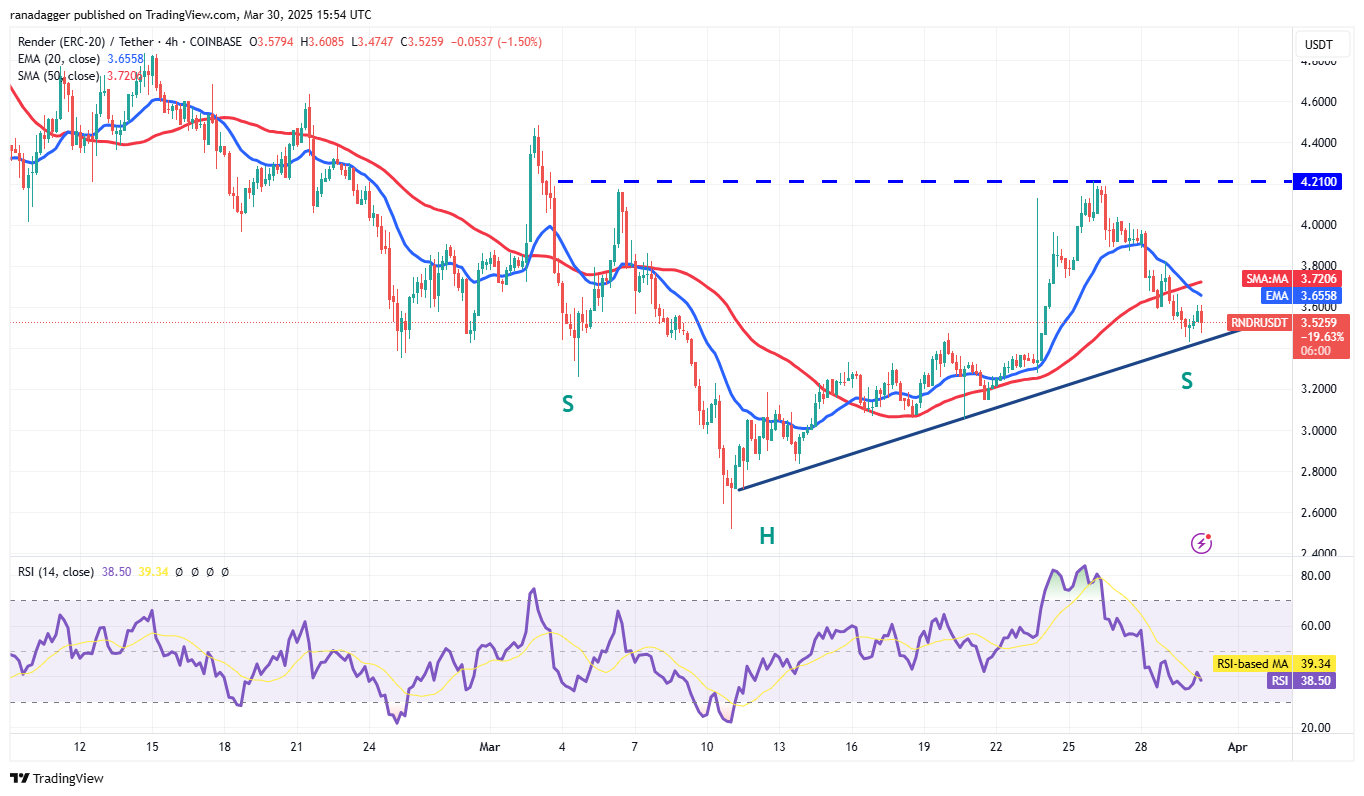
RNDR/USDT 4-hour chart analysis.
The 20-EMA has turned downward, and the RSI is in negative territory on the 4-hour chart, signaling an advantage for sellers. A break and close below the uptrend line would strengthen the bears further and pull the pair down to $3.
The first indication of strength will be a break and close above the moving averages, which could pave the way for a rally to $4. An uptick could accelerate once the pair closes above $4.20, completing a bullish head-and-shoulders pattern.
This overview does not constitute investment advice or recommendations. All trading and investment activities carry risk, and readers should conduct their own due diligence before making decisions.