Cardano (ADA) may be on the brink of a significant surge in the coming weeks, with some analysts predicting gains exceeding 130%.
In a recent post, a pseudonymous analyst with a following of 124K highlighted that Cardano seems to be forming a traditional “ABCDE” triangle pattern, which is a consolidation structure often observed before major price movements.
In this pattern, the price fluctuates in five distinct phases labeled A through E within a narrowing range, typically culminating in a powerful movement in one direction.
According to the analyst, ADA is currently positioned in the C wave, which is a downward phase; however, once it completes the D and E waves, a strong upward breakout may occur.
The analyst mentioned that a bounce from the 0.5–0.618 Fibonacci retracement zone could act as a springboard, propelling the price towards $1.5.
“This is where seasoned traders buy,” he remarked, suggesting that experienced investors tend to accumulate during this pattern.
Another analyst supported this view, emphasizing that ADA is adhering to its long-term trend and sitting near the lower edge of a symmetrical triangle formation—a classic sign of price consolidation where values are constricted between converging trend lines.
This analyst believes that once ADA surpasses the convergence area, there will be minimal resistance until it reaches $1.9. “Everything will start in an instant,” he noted, observing ongoing net buying as an encouraging indicator.
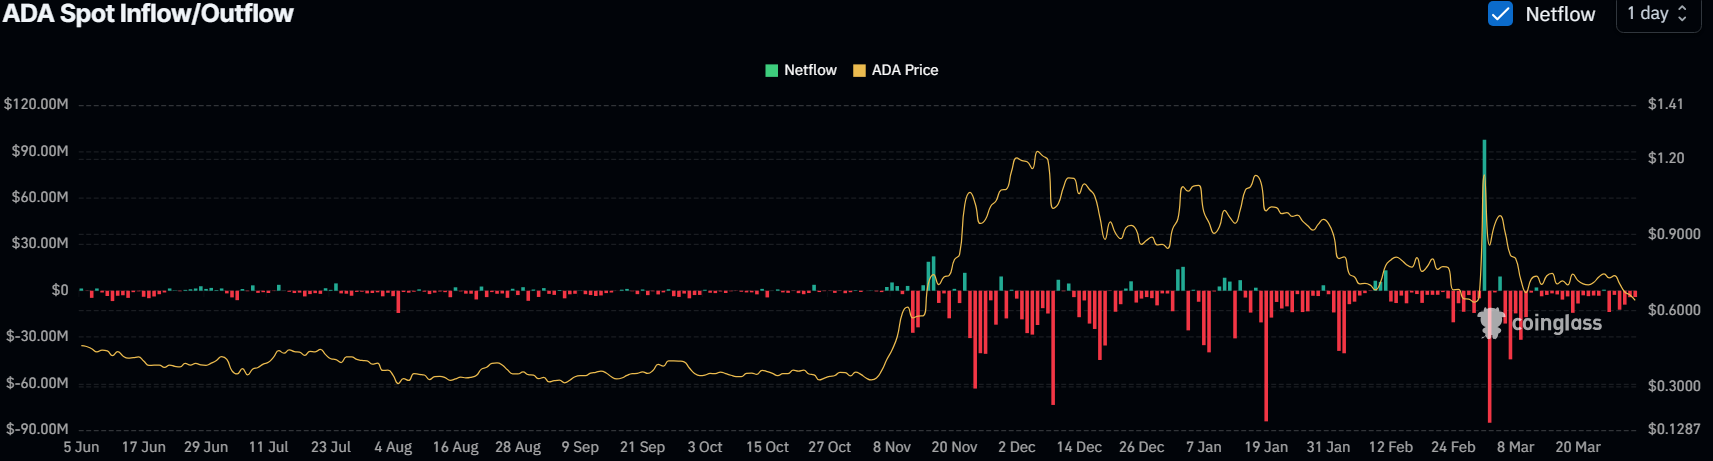
Evidence from investor activity points to a trend of accumulation for the altcoin, with data indicating net outflows on most days since early March. This suggests that more tokens are being withdrawn from exchanges than deposited, reflecting strong investor confidence in its long-term prospects.
Adding to the bullish narrative, another analyst drew comparisons between ADA’s current price trajectory and its performance from August to September 2024. At that time, the token experienced a notable rally following an extended consolidation phase.
Since ADA has not reached a new low after its dip to $0.49 on February 3, akin to the previous cycle, the analyst believes a similar breakout could materialize in May, potentially pushing the price up to $2.5.
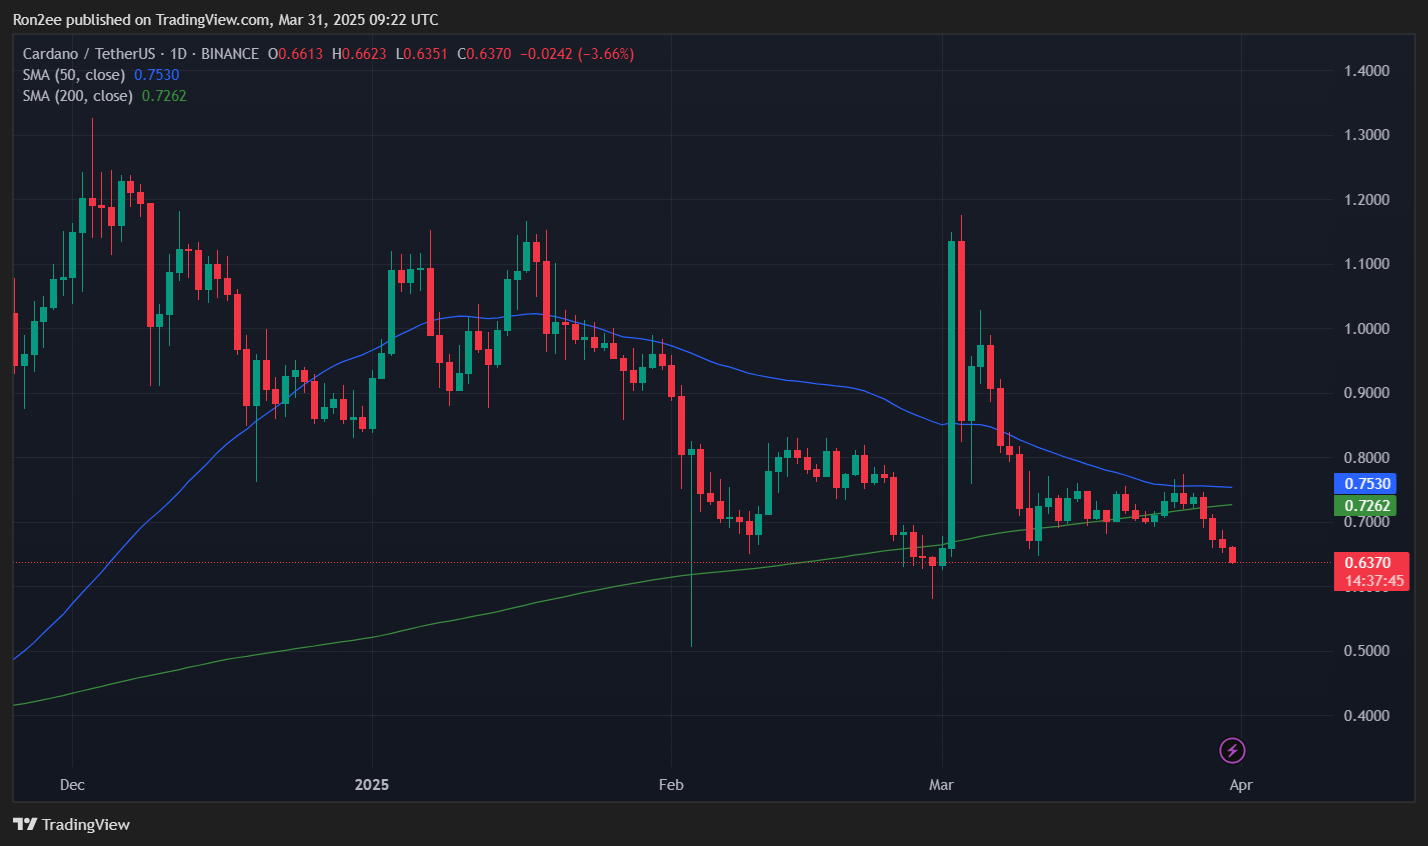
As of the latest update, ADA was still facing bearish pressure, with its price down 6.2% over the past 24 hours, now at $0.64, while its market capitalization stood at $23.3 billion.
Technical Analysis of ADA
On the 1-day USDT price chart, the 50-day moving average was above the 200-day moving average, indicating a bullish configuration that signals ongoing momentum and bolsters the case for a possible breakout.
The Supertrend indicator has dipped below the price level and switched to green, signaling a potential trend reversal on the horizon.
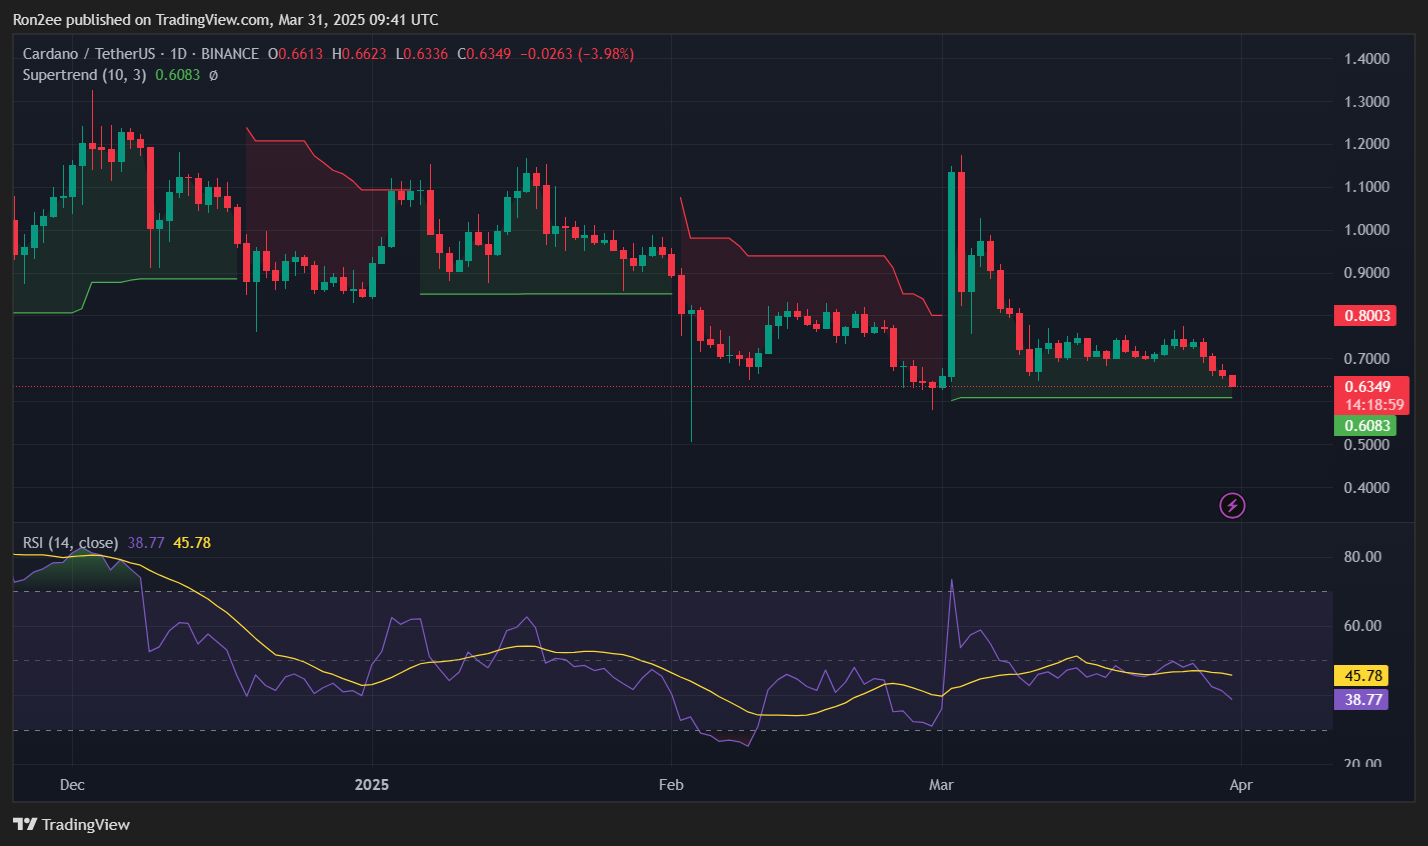
The Relative Strength Index, which has dropped to $39, is nearing the oversold territory, which could incentivize bulls to step in and drive prices higher.
Meanwhile, ADA’s MVRV Z-score has fallen to 0.0077—the lowest level since early March—suggesting that the average holder is nearing the breakeven point. This level often indicates a reduction in selling pressure and the beginning of accumulation, raising the likelihood of a price rebound if sentiment in the market shifts.
Data shows that ADA’s price correlation with Bitcoin currently stands at 0.79, indicating a strong positive relationship over the past 30 days. As such, ADA’s next moves will largely depend on Bitcoin, which has been trending downward amid economic developments.
At the time of writing, Bitcoin (BTC) was priced at $81,484, down approximately 7% over the prior week.
Disclaimer: This article is not intended as investment advice. The information and materials presented here are meant for educational purposes only.