- On Monday, Bitcoin’s price dipped below $82,000 following a 4.29% drop over the previous week.
- The return for BTC in the first quarter thus far stands at -12.51%, marking the fourth lowest Q1 since 2013.
- The Economic Policy Uncertainty (EPU) index is currently at 600, which is 80% higher than during the 2008 Global Financial Crisis, indicating significant market anxiety and a risk-averse mindset.
As of Monday, Bitcoin (BTC) has fallen below the $82,000 mark after recently experiencing a 4.29% decline over the past week. The BTC return for the first quarter of this year is -12.51%, which is the fourth lowest Q1 recorded since 2013. Meanwhile, the EPU Index stands at 600, reflecting a level 80% above what was seen during the 2008 financial crisis, illustrating heightened market anxiety and a risk-off approach among investors.
Market unease and risk-averse sentiment rise as tariff deadline approaches
Bitcoin’s price adjustment continues on Monday, trading below $82,000 after a previous week drop of 4.29%. Market unease and risk-averse attitudes are intensifying as the deadline for tariffs set by President Donald Trump—referred to as ‘Liberation Day’—approaches this Wednesday. Reports from various analysts suggest that traders should prepare for heightened volatility.
Furthermore, the current EPU Index, which has tracked uncertainties in U.S. economic policy since 1985, is over 600—a staggering 80% higher than during the 2008 financial crisis. This suggests pronounced market apprehension. Historical surges in this index indicate that periods of high uncertainty often precede significant market volatility, as witnessed during both the 2008 collapse and the 2020 pandemic-related shutdown.
This level of uncertainty and volatility frequently encourages investors to adopt a risk-averse stance, directing their investments towards safer assets like Gold, which could subsequently reduce interest in cryptocurrencies.
US Economic Policy Uncertainty Index Chart
In a recent report from the Wall Street Journal, it was mentioned that Trump’s administration is considering “broader and higher tariffs” as the reciprocal tariffs deadline approaches on Wednesday.
President Trump is reportedly considering implementing an overall increase of up to 20%. Additionally, this coming Wednesday marks not just the end of tariff ambiguity, according to insights from certain analysts on social media.
As turbulence and uncertainty sweep through global and crypto markets, the potential for sell-offs looms large amid prevailing risk-averse sentiment in the cryptocurrency sphere. Yet, in the medium to long term, Bitcoin and similar cryptocurrencies may experience an uptick in demand as inflation hedges, particularly if inflation rates rise and traditional markets struggle. The historical correlation between shocks in the EPU and cryptocurrency trading volumes, alongside Bitcoin’s status as a “safe haven asset,” supports this perspective, even as immediate risks remain due to broader market influences.
To further understand how cryptocurrencies might respond to these tariff developments, insights were gathered from experts in the field.
Bitcoin’s quarterly return dips, though historical trends for April indicate potential recovery
Recent data shows that Bitcoin’s quarterly returns for Q1 are in negative territory, with a decline of -12.51%. This marks the worst quarterly performance since 2018 and the fourth lowest overall since 2013.
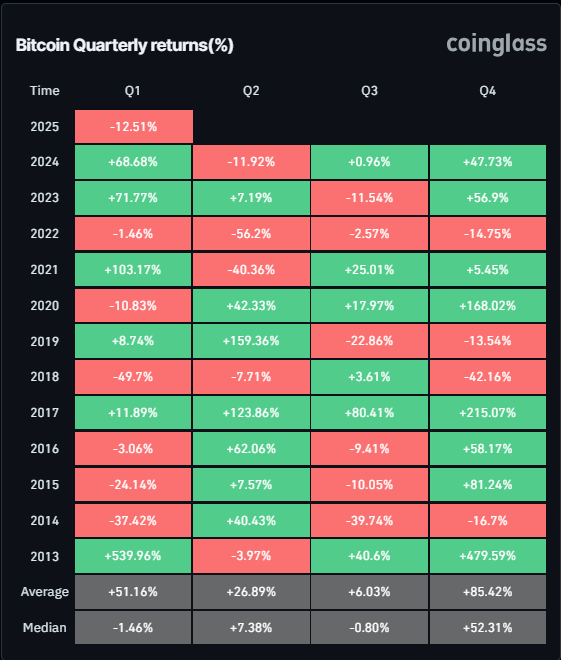
BTC Quarterly returns (%) chart
Analyzing the monthly return data, March recorded a modest drop of 3.06%. Conversely, historical data for April suggests monthly averages and medians are showing optimistic trends, with gains of 12.98% and 5.04%, respectively.
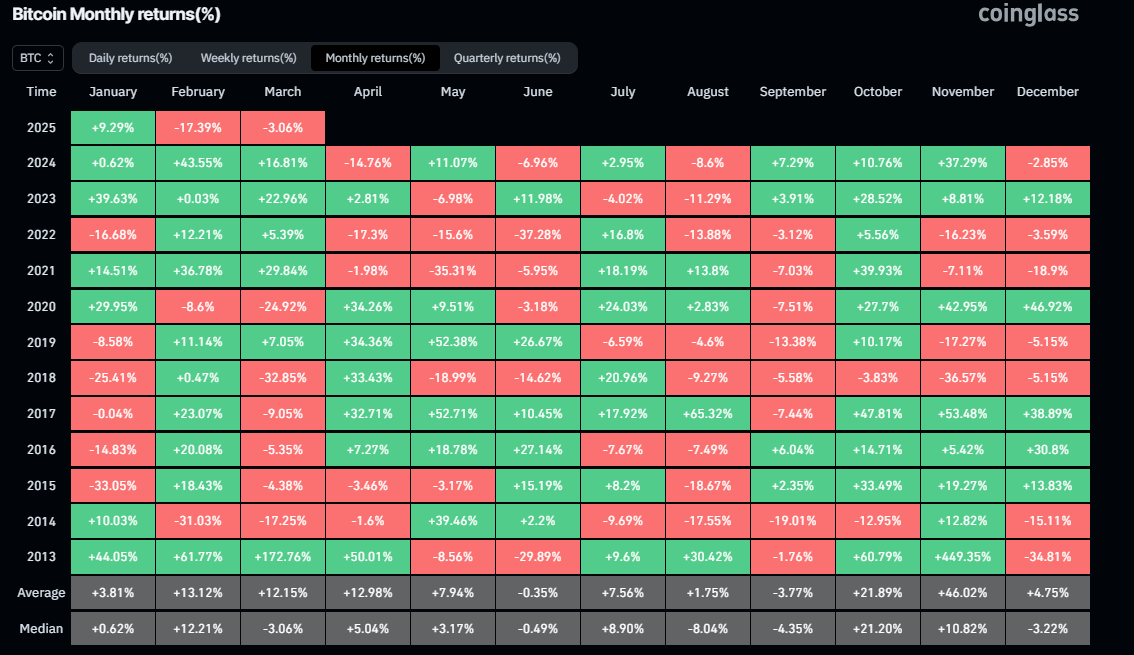
Bitcoin Monthly returns(%) chart
Current data highlights a decrease in institutional demand for Bitcoin. Reports indicate that last week’s inflow into Bitcoin spot ETFs was a mere $196.40 million, following a substantial influx of $744.30 million the week prior. This recent inflow is notably lower compared to values seen in early November. A sustained recovery in Bitcoin’s price likely relies on a resurgence of institutional investor demand.
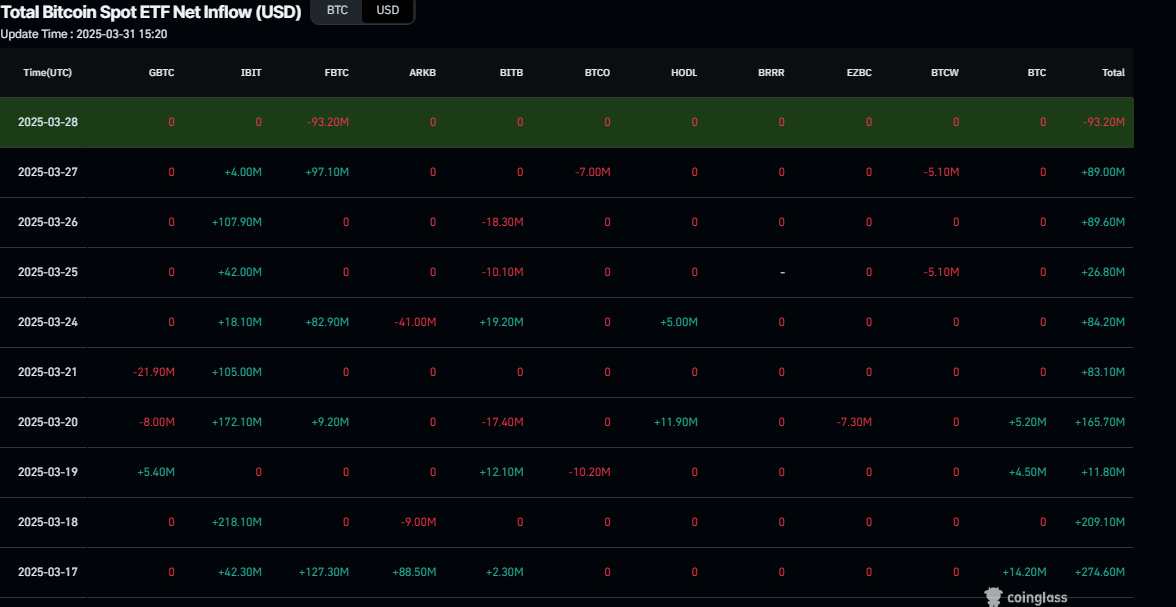
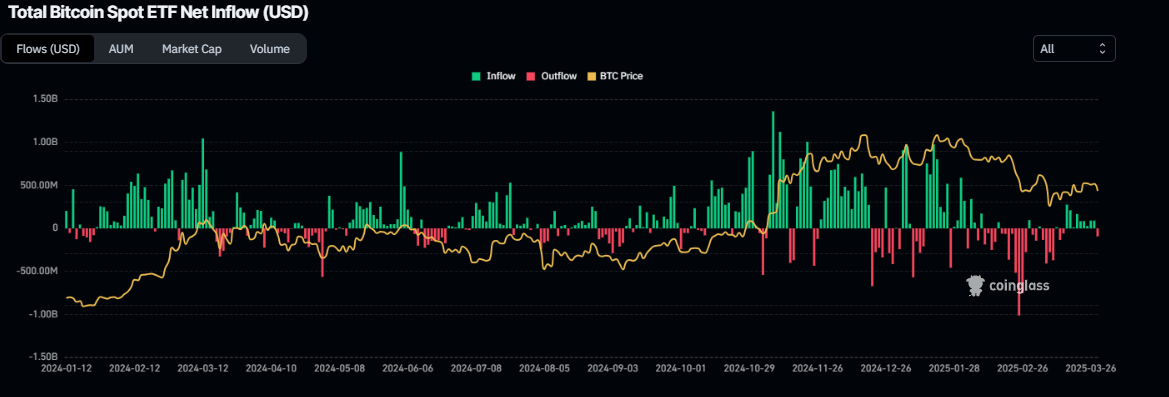
Total Bitcoin spot ETF net inflow chart. Source: Coinglass
Bitcoin Price Prediction: Bearish sentiment prevails
Last week, Bitcoin’s price fluctuated between $85,000 and $88,000. However, it closed beneath its lower boundary on Friday, leading to a 5.53% decrease by Sunday. At the time of writing on Monday, it remains below $82,000.
If the current correction continues, it may extend further down to test the next support at $78,258.
The Relative Strength Index (RSI) on the daily chart stands at 40, falling below the neutral level of 50, indicating a strong bearish sentiment.
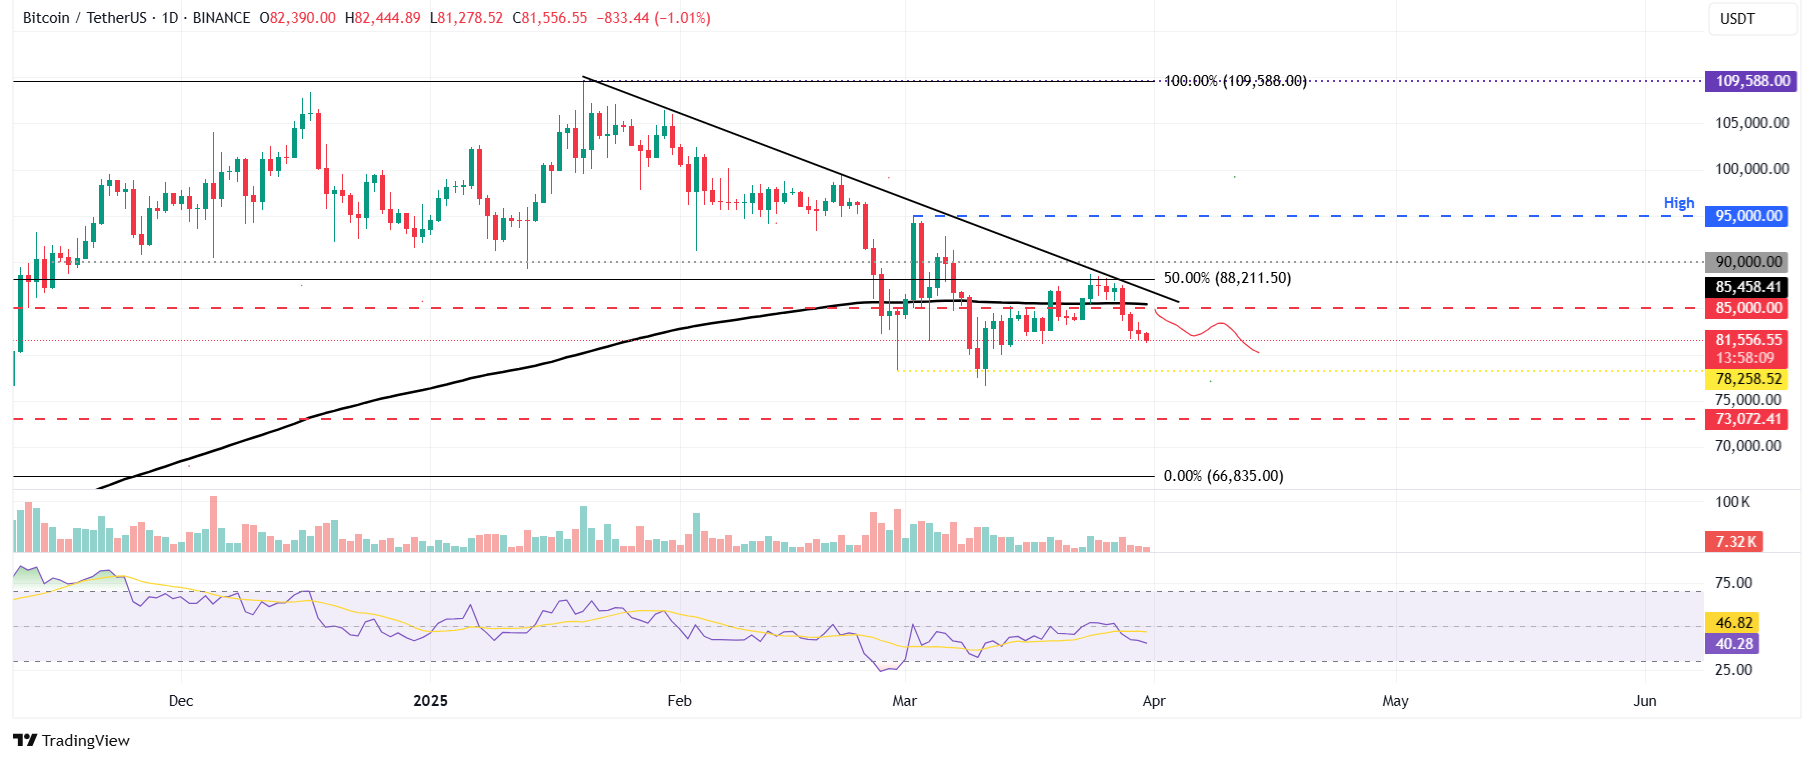
BTC/USDT daily chart
Should Bitcoin manage a recovery, it could revisit its daily resistance level at $85,000. A successful breach of this resistance could propel it toward the key psychological threshold of $90,000.
Bitcoin, altcoins, stablecoins FAQs
Bitcoin is the leading cryptocurrency by market capitalization, designed to function as a form of money. This decentralized currency cannot be governed by any individual, group, or organization, removing the need for third-party oversight in financial transactions.
Altcoins refer to any cryptocurrency that is not Bitcoin. Some view Ethereum as a non-altcoin due to the forking that occurs from these two. If true, Litecoin is the first altcoin, a fork of the Bitcoin protocol, essentially offering enhancements to it.
Stablecoins are cryptocurrencies aimed at maintaining a consistent value, with their worth supported by a reserve of the corresponding asset. To achieve this stability, a stablecoin’s value is pegged to a commodity or financial instrument, such as the US Dollar (USD), with supply regulated by either algorithms or market demand. The primary purpose of stablecoins is to facilitate trading and investment in the cryptocurrency market while providing a stable store of value, given the general volatility of cryptocurrencies.
Bitcoin dominance refers to the proportion of Bitcoin’s market capitalization relative to the total market capitalization of all cryptocurrencies. This ratio offers insights into Bitcoin’s attractiveness among investors. Typically, high Bitcoin dominance occurs during bullish market phases when investors prioritize more stable and well-capitalized cryptocurrencies. A decrease in Bitcoin dominance often indicates that investors are reallocating their assets towards altcoins in search of higher returns, triggering rallies in those alternative cryptocurrencies.