The price of Bitcoin (BTC) fell beneath its upward channel over the weekend, hitting a low of $81,222 on March 31. The leading cryptocurrency is on track to experience its worst quarterly performance since 2018; however, a group of significant investors is displaying signs reminiscent of a 2020 bull run.
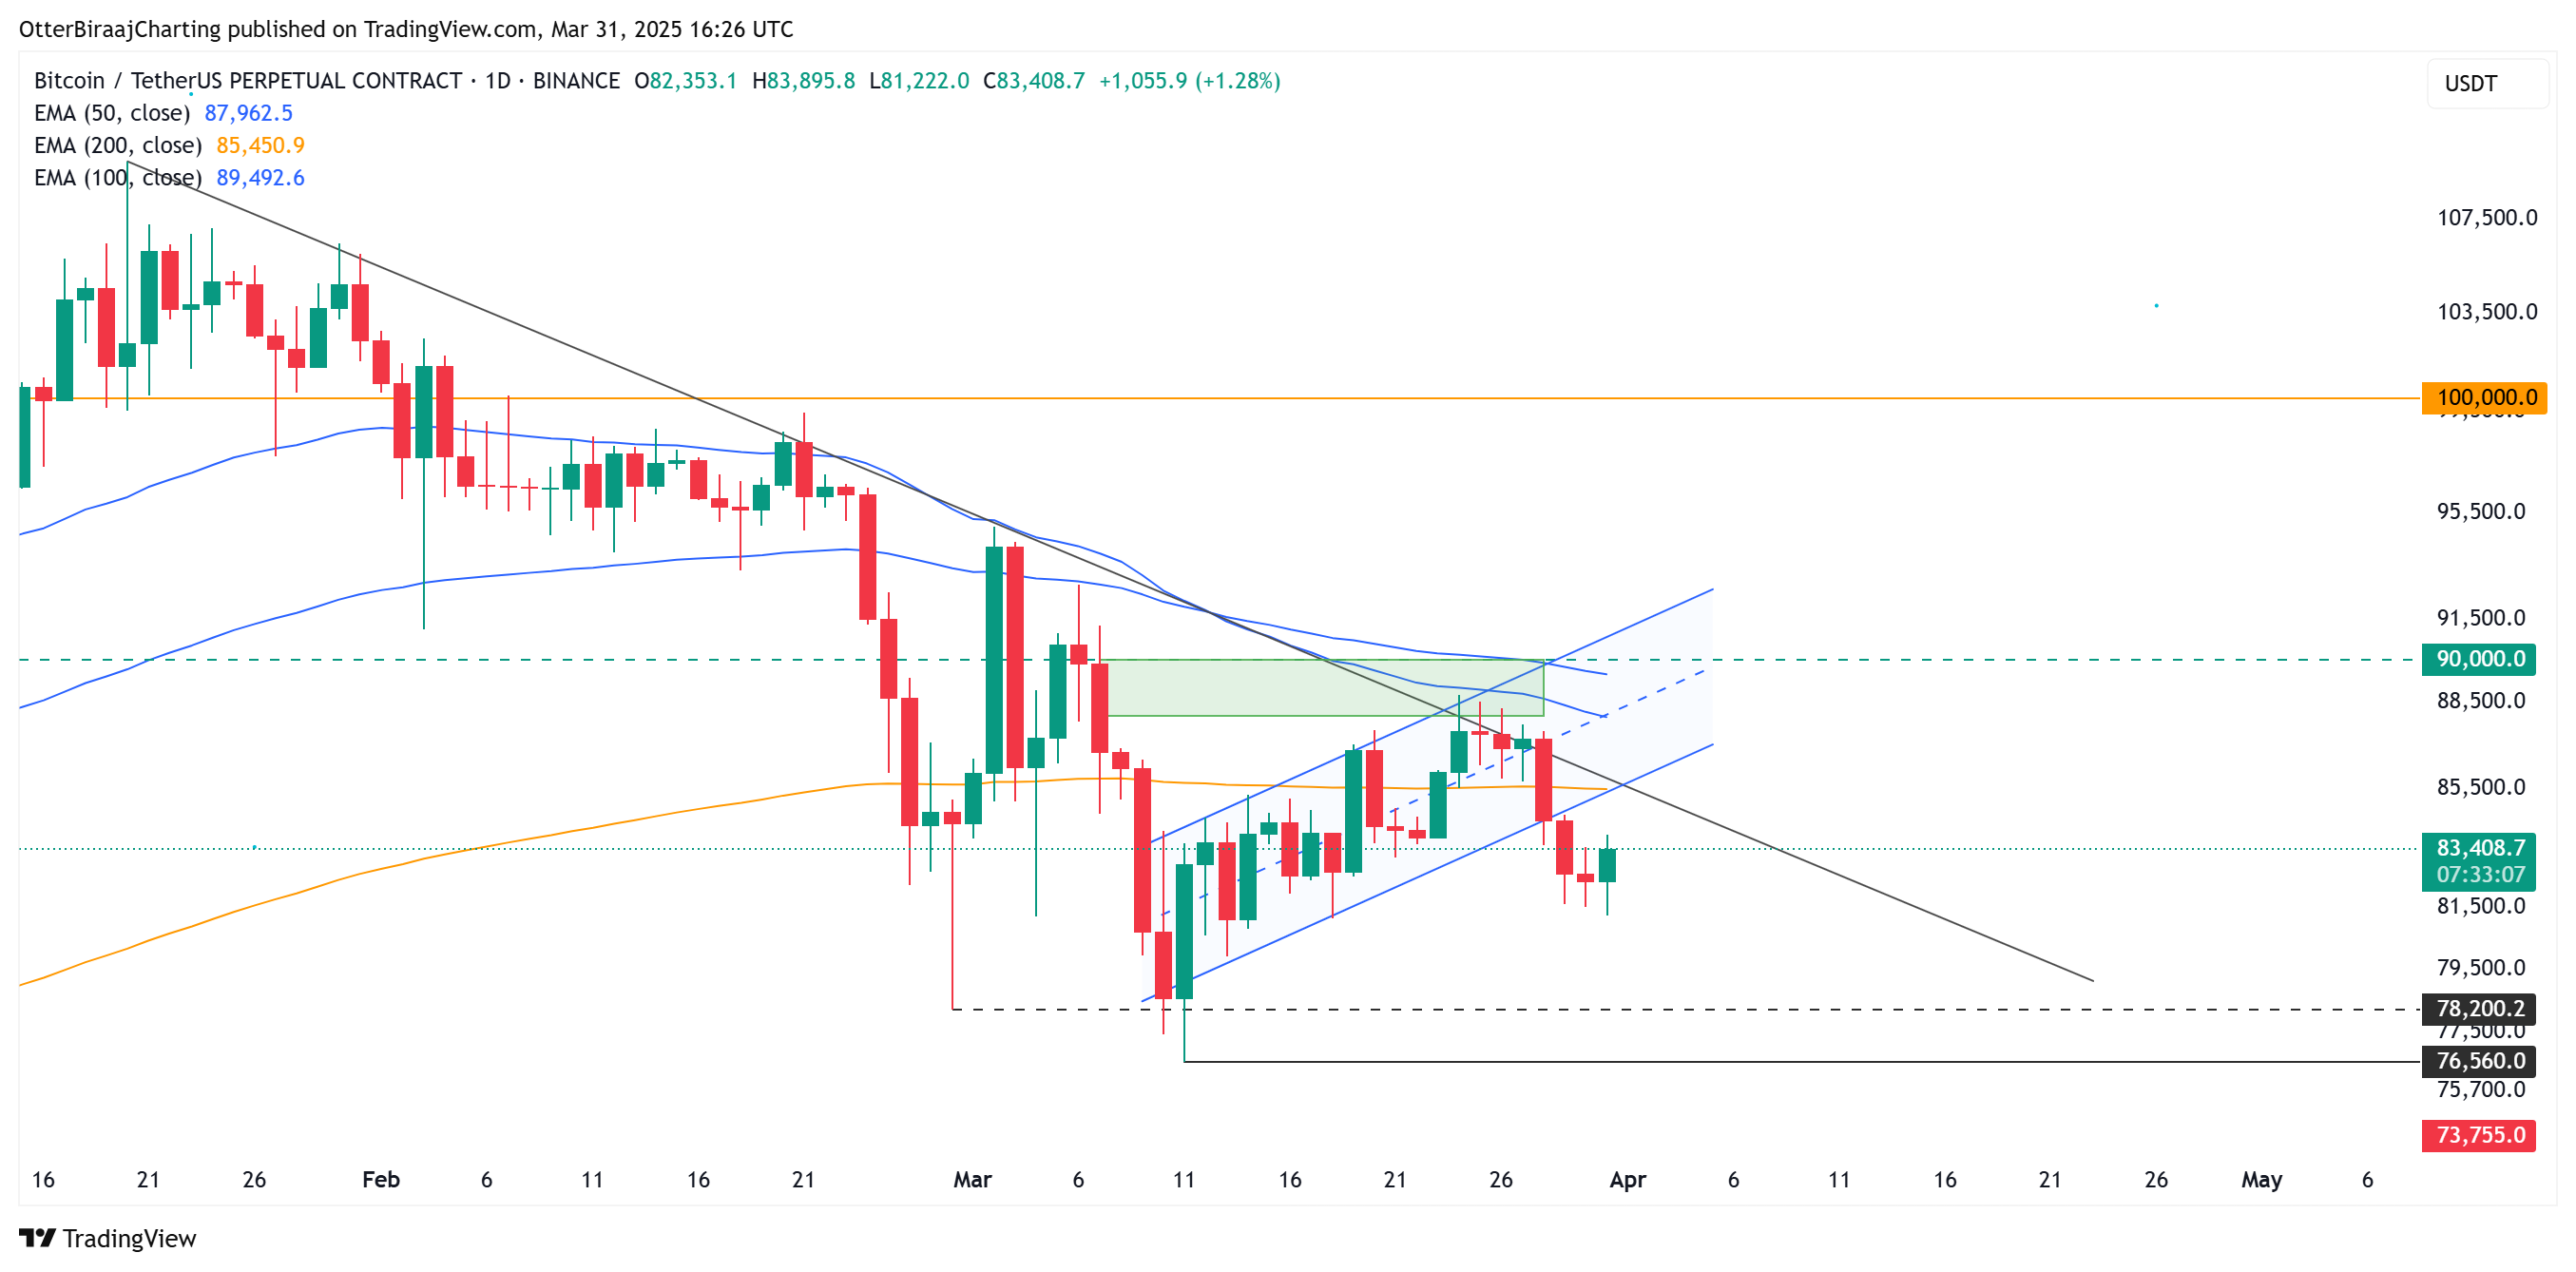
Bitcoin 1-day chart. Source: TradingView
In a recent analysis, an on-chain expert noted that addresses holding between 1,000 to 10,000 BTC are closely correlated with the price of Bitcoin. These large entities have shown resilience against market fluctuations and are actively accumulating, reflecting patterns consistent with the 2020 bull cycle.
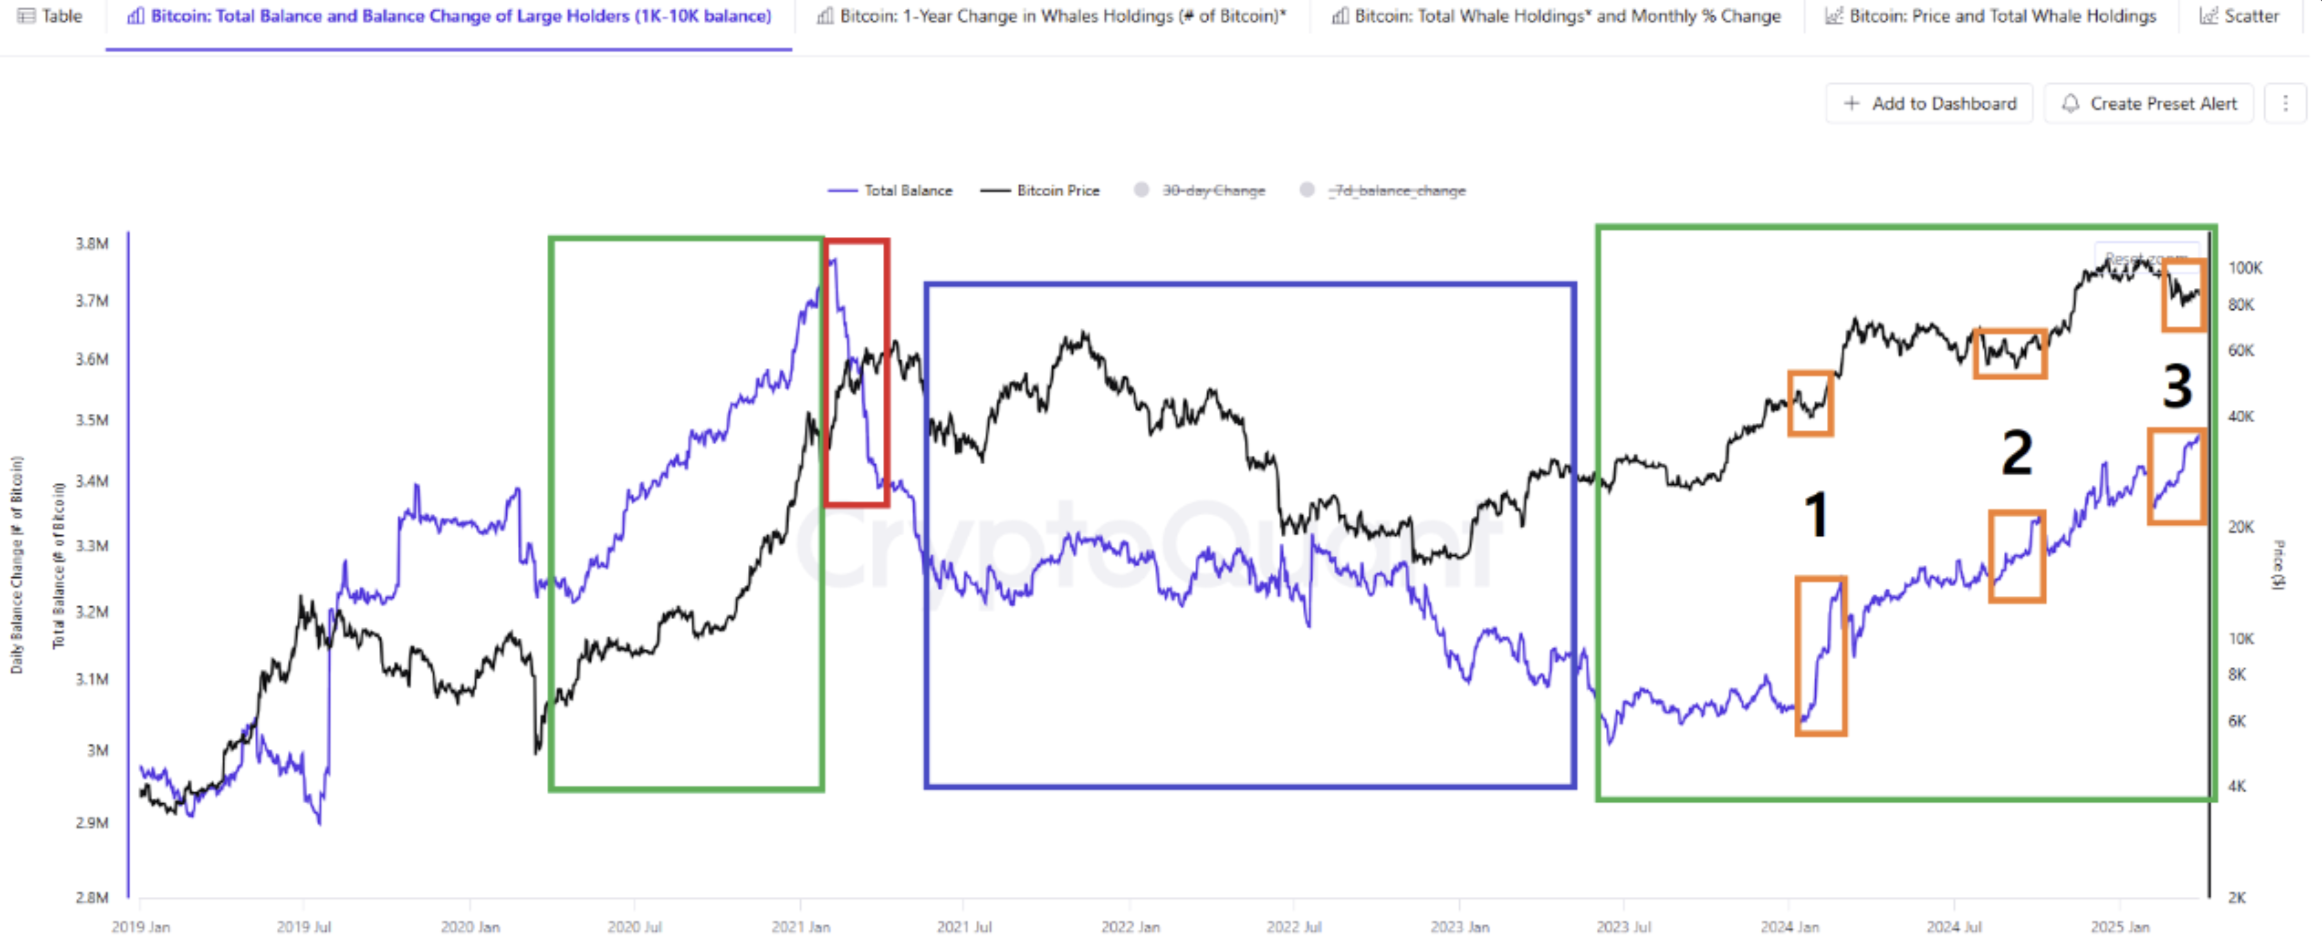
Bitcoin whale accumulation analysis. Source: CryptoQuant
This distinctive behavior appeared three times in the current bull market, characterized by swift BTC accumulation by whales, despite skepticism among retail investors regarding a bullish trend.
These instances occurred during periods of negative market sentiment and were followed by significant price increases, indicating that whales were strategically positioning themselves prior to a rebound.
Even though BTC is currently experiencing a decline, the analyst mentioned,
“There are no signs yet that the leading whales are exiting.”
As depicted in the chart above, the third pattern showed a similar accumulation rate, while BTC price fluctuated sideways.
Related: Bitcoin trader issues ‘overbought’ warning as BTC price targets $84K
Is Bitcoin poised to surpass $84,000 after the CME gap?
As trading resumed on March 31, BTC surged to close the CME futures gap that had developed over the weekend. The CME gap refers to the disparity between the closing price of BTC futures on Friday and the opening price on Sunday evening.
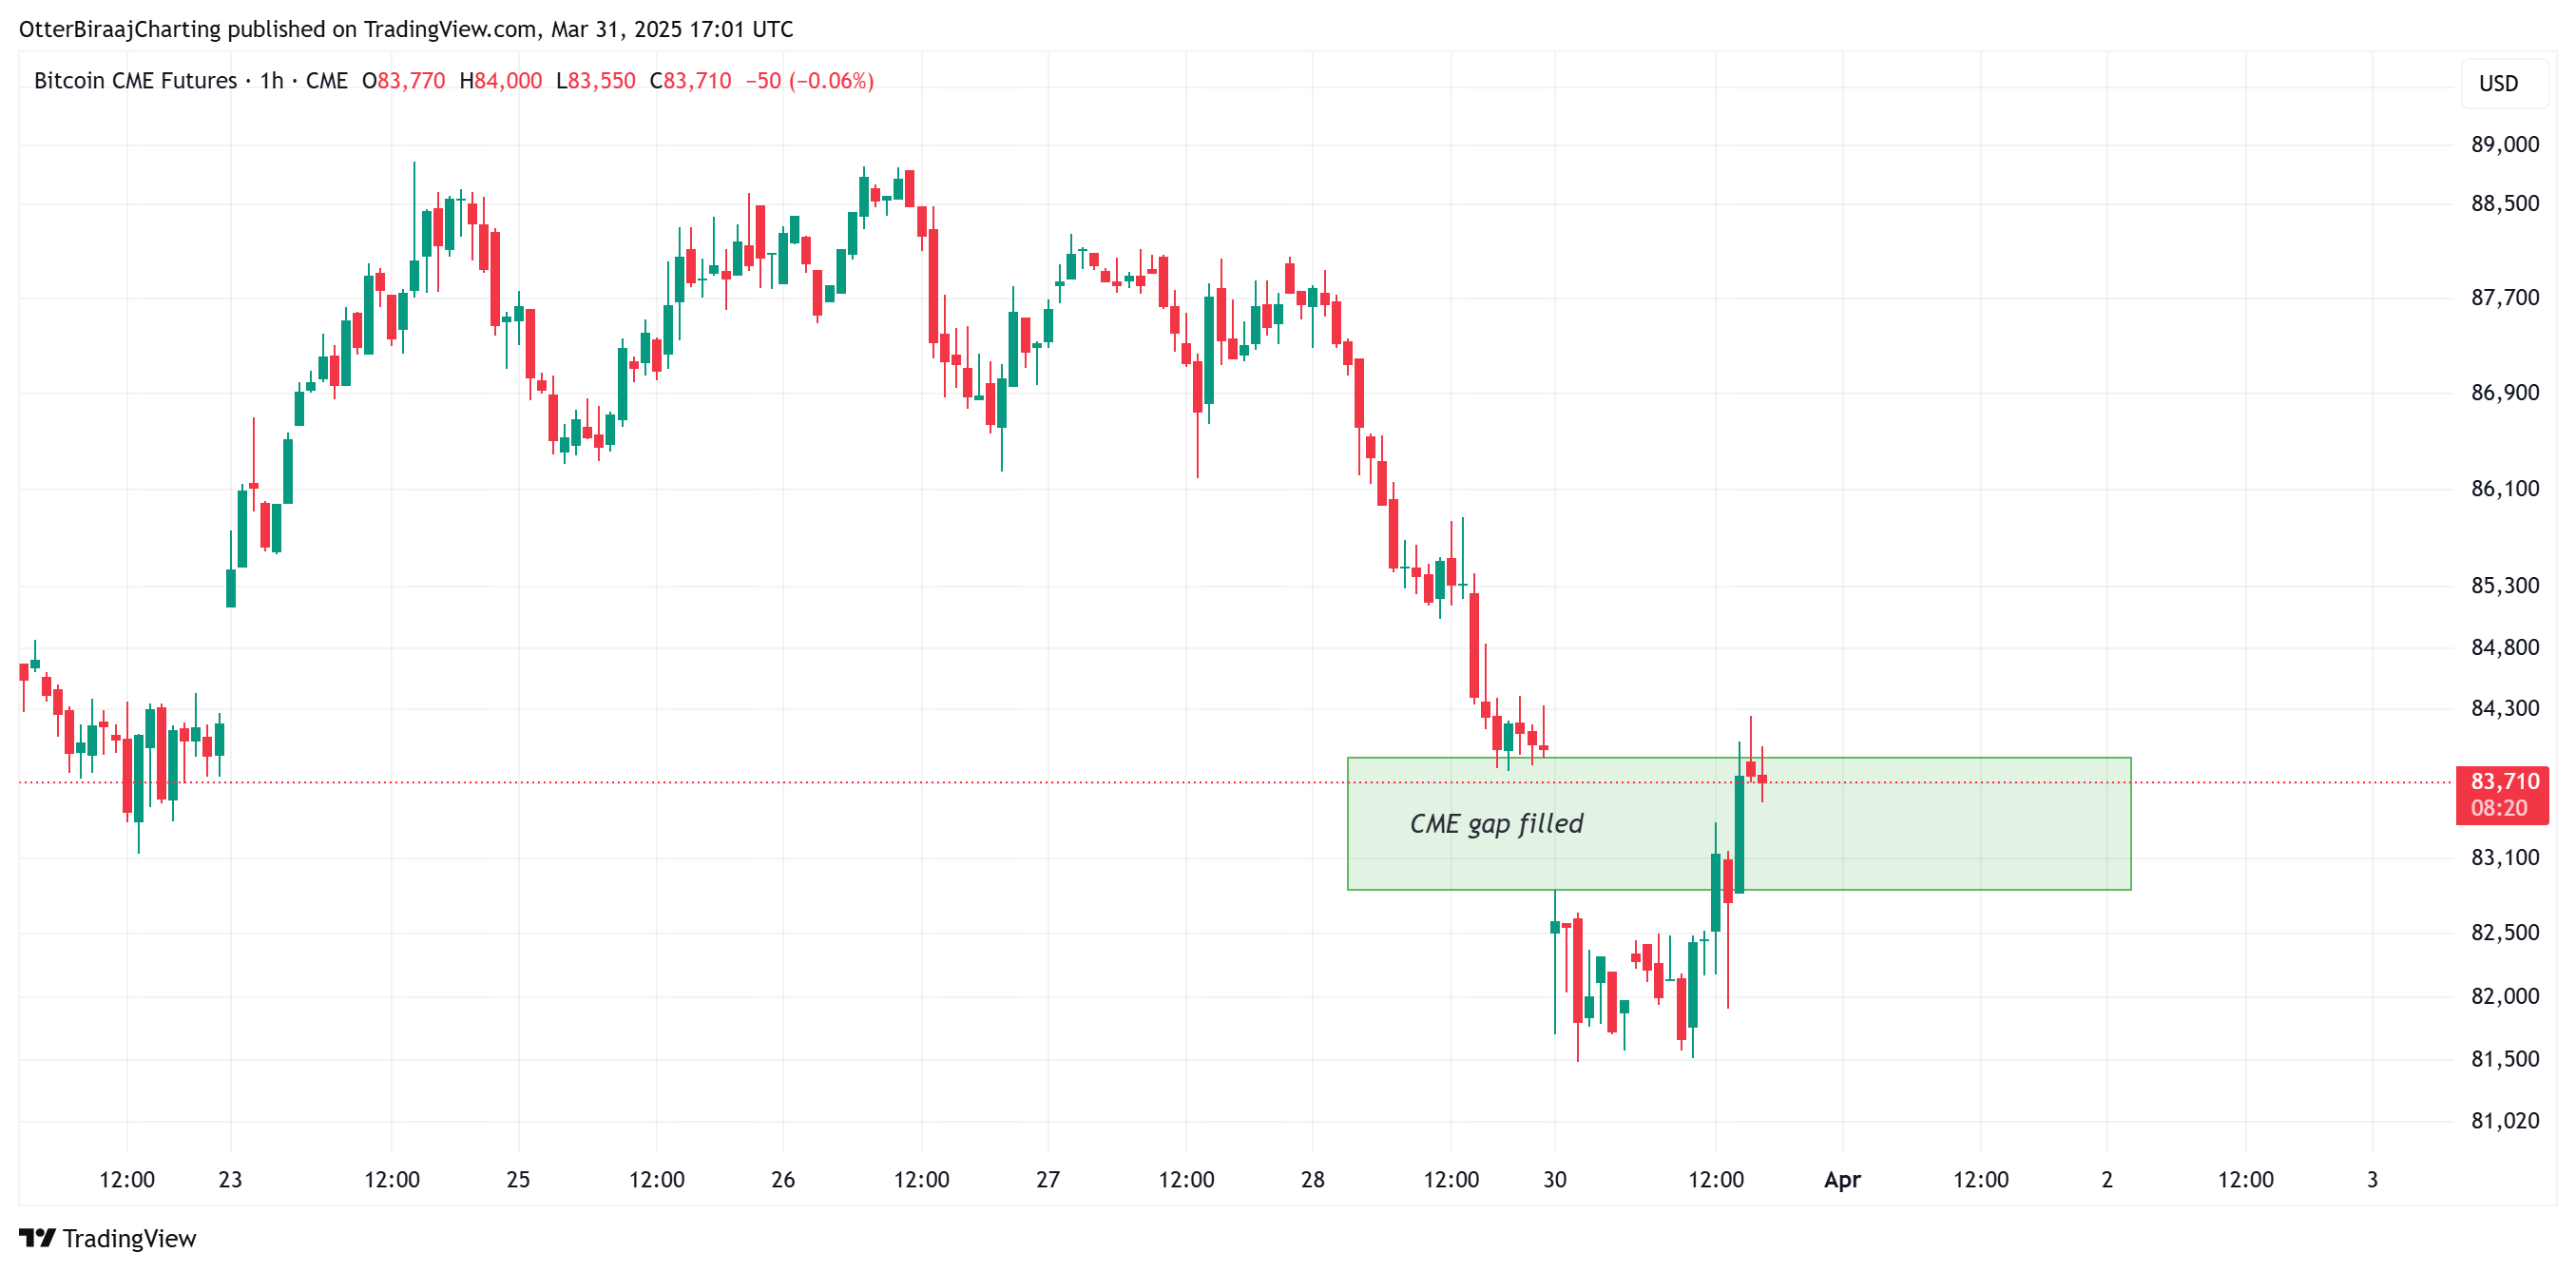
Bitcoin CME gap analysis. Source: TradingView
While Bitcoin kicked off the week on a positive note, several upcoming economic events in the US could influence the price.
-
April 1, JOLTS Job Openings: This report gauges labor market demand; a decline may indicate weakness.
-
April 2, US tariff implementation: dubbed “Liberation Day,” with tariffs of 20% or more applied to up to 25 countries.
-
April 4, Non-farm payrolls (NFP), unemployment data, and a speech from Federal Reserve Chair Jerome Powell.
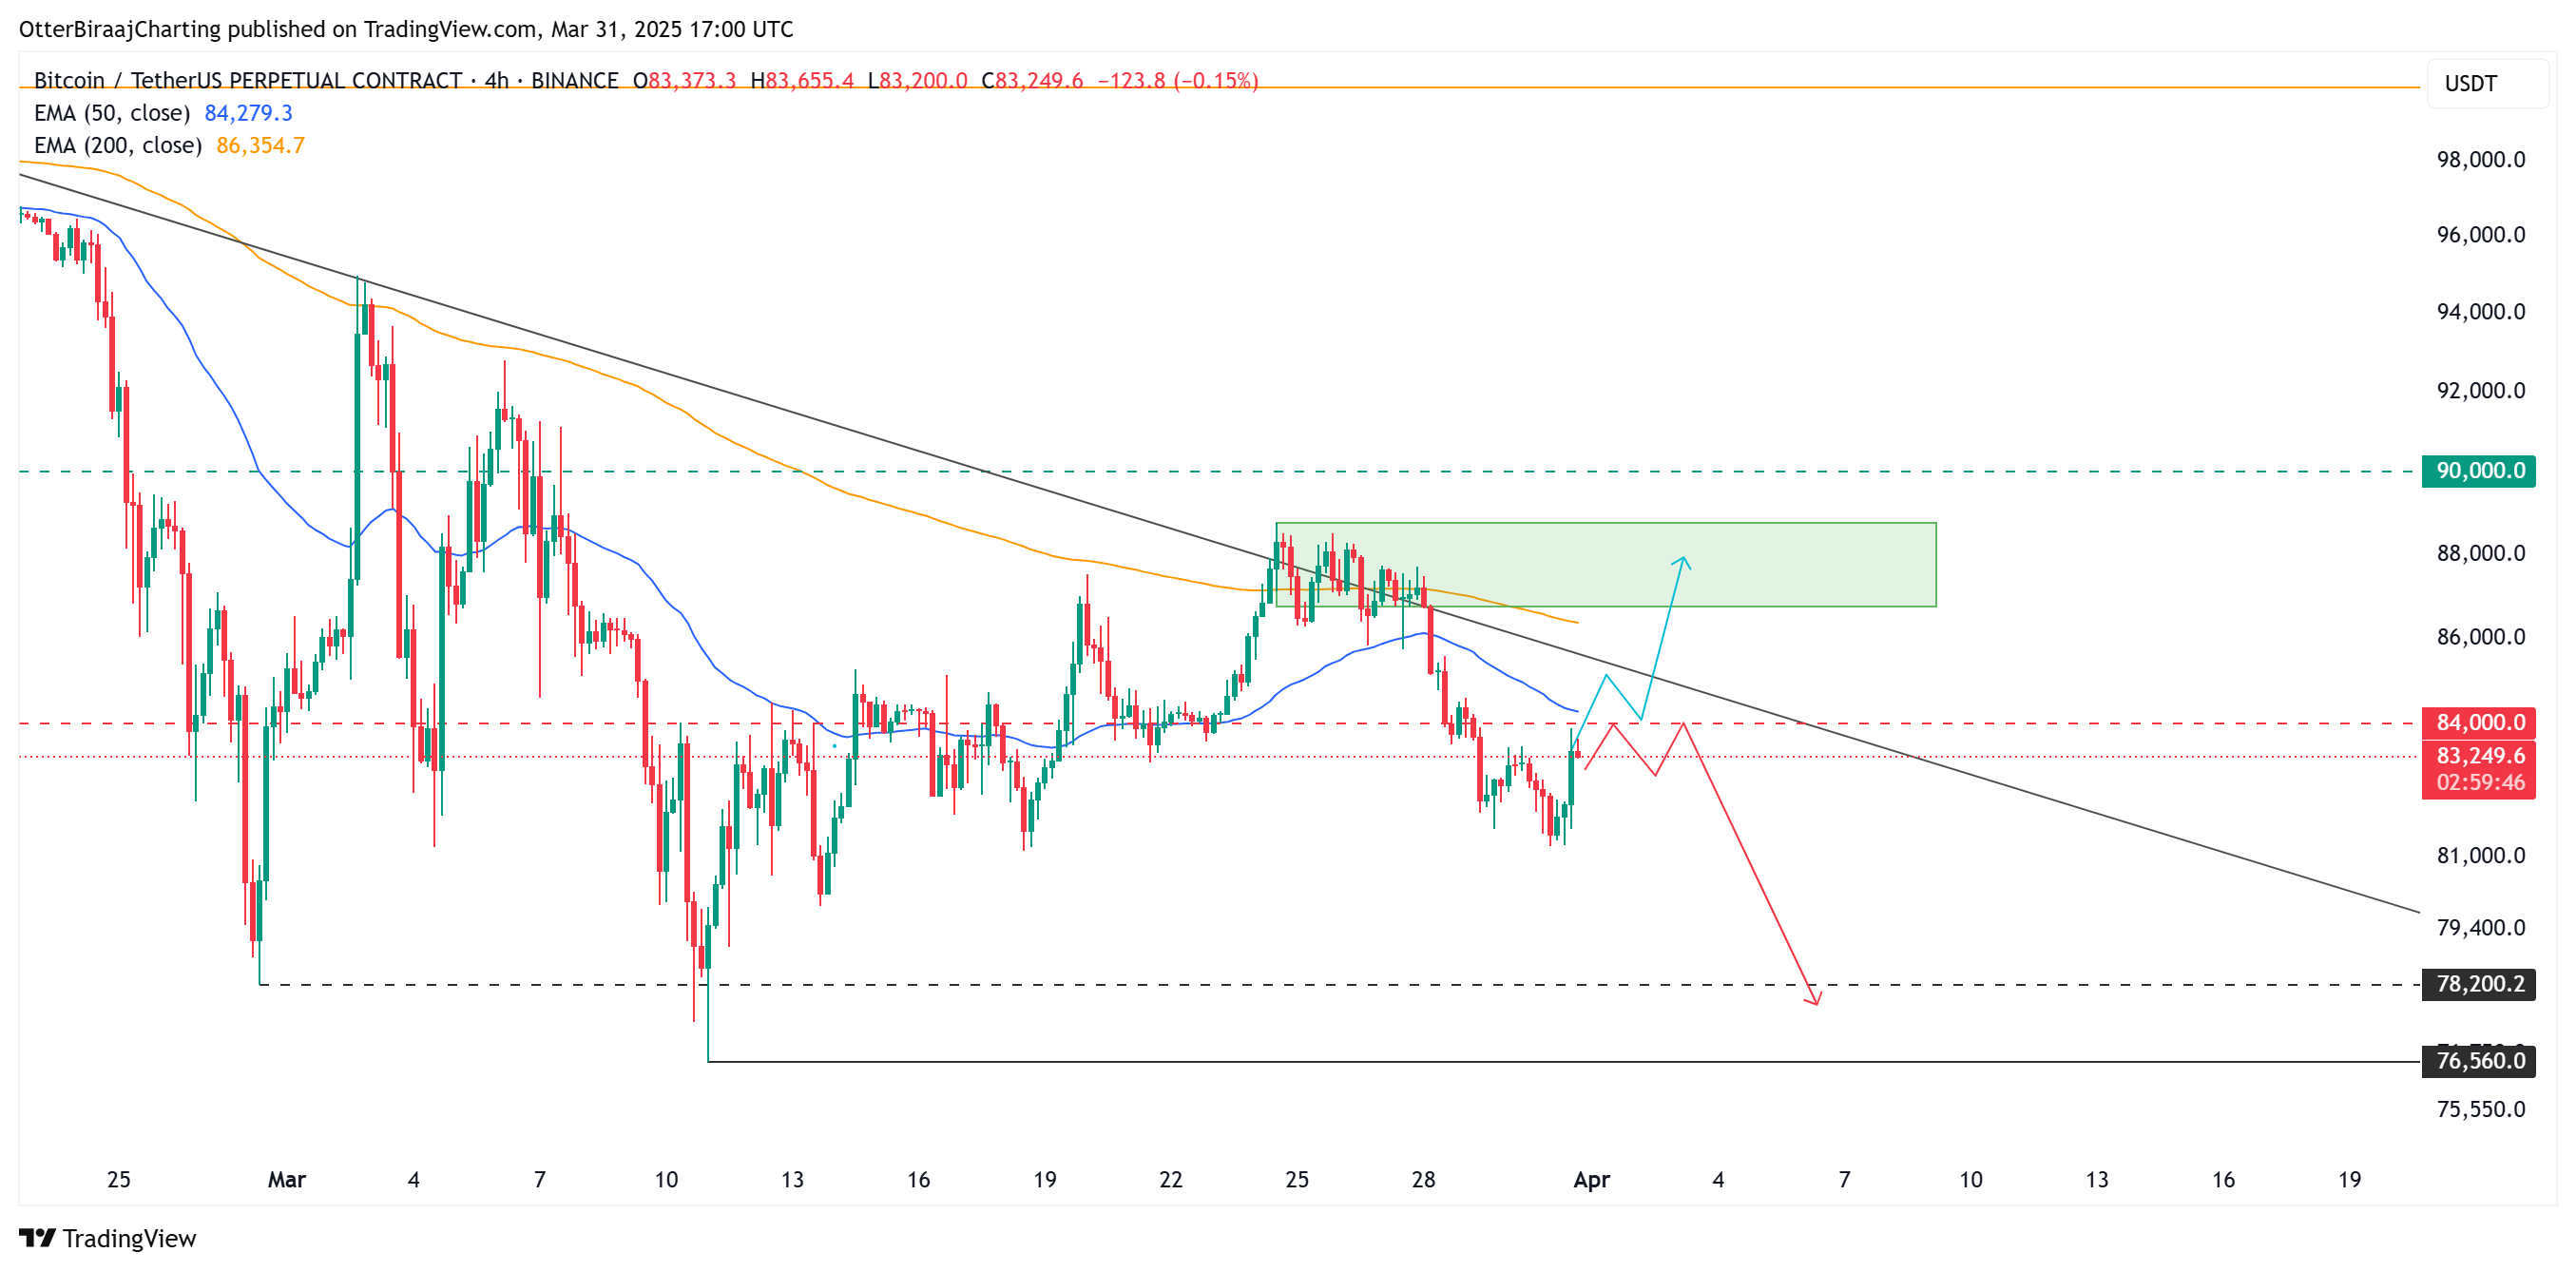
Bitcoin 4-hour chart. Source: TradingView
BTC’s immediate focus is on transforming the $84,000 level into support to facilitate a bullish continuation. Reclaiming this level could push BTC above the 50-day exponential moving average, potentially sparking a short-term rally to the supply zone between $86,700 and $88,700.
On the other hand, if prolonged consolidation occurs below $84,000, it will strengthen its resistance characteristics, possibly leading to further corrections towards liquidity zones ranging from $78,200 to $76,560.
Related: Bitcoin’s ‘digital gold’ assertion challenged as traders shift to bonds, and gold reaches new peaks
This article does not offer investment advice or endorsements. Each investment and trading move carries risks, and readers should perform their own research before making decisions.