- Bitcoin continues its downward trend on Monday after a 4.29% correction over the past week.
- Ethereum’s price ends below its daily support level of $1,861, signaling potential further declines.
- XRP has dropped below its 100-day EMA, suggesting a correction may be imminent.
Bitcoin (BTC) remains on the decline, trading below $82,000 on Monday after a 4.29% loss in the previous week. Ethereum (ETH) and Ripple (XRP) also followed suit, falling by 9.88% and 12.40%, respectively.
In a recent report, President Trump’s team is examining the possibility of “broader and higher tariffs” as the deadline for reciprocal tariffs approaches on Wednesday. The president is reportedly considering an overall increase of up to 20%. Moreover, April 2 is the deadline, but it might not resolve all tariff uncertainties.
BREAKING: President Trump’s team is weighing “broader and higher tariffs” ahead of Wednesday’s reciprocal tariffs deadline, per WSJ.
President Trump is reportedly weighing “an across-the-board hike of up to 20%.”
Again, April 2nd is NOT the end of tariff uncertainty. pic.twitter.com/1R568CP4U4
— The Kobeissi Letter (@KobeissiLetter) March 31, 2025
Bitcoin exhibits weakness by closing under its lower consolidation boundary
After successfully breaking and closing above the 200-day Exponential Moving Average (EMA) on Sunday, Bitcoin’s price consolidated between $85,000 and $88,000 until Thursday. However, BTC closed beneath its lower consolidation boundary on Friday and dropped by 5.53% until Sunday. At the time of writing on Monday, it continues to trade below the $82,000 mark.
Should BTC continue its recent downturn, it could further decline to retest its next support level at $78,258.
The Relative Strength Index (RSI) on the daily chart currently stands at 40, which is below the neutral level of 50 and indicates pronounced bearish momentum.
BTC/USDT daily chart
Conversely, if BTC manages to break and close above the descending trendline (traced by connecting various high points from mid-January), which aligns closely with the upper boundary of the recent range, it could lead to a recovery that retests the critical psychological level of $90,000 and the March 2 high of $95,000.
Ethereum experiences a correction as it settles below its daily support at $1,861
The price of Ethereum closed below its daily support level of $1,861 last week, resulting in a 9.88% loss. As the week starts, it hovers around $1,800.
If ETH continues on this downward path, it might further decline to retest its significant psychological level of $1,700.
The RSI currently reads 34, falling below the neutral median of 50, which highlights strong bearish momentum.
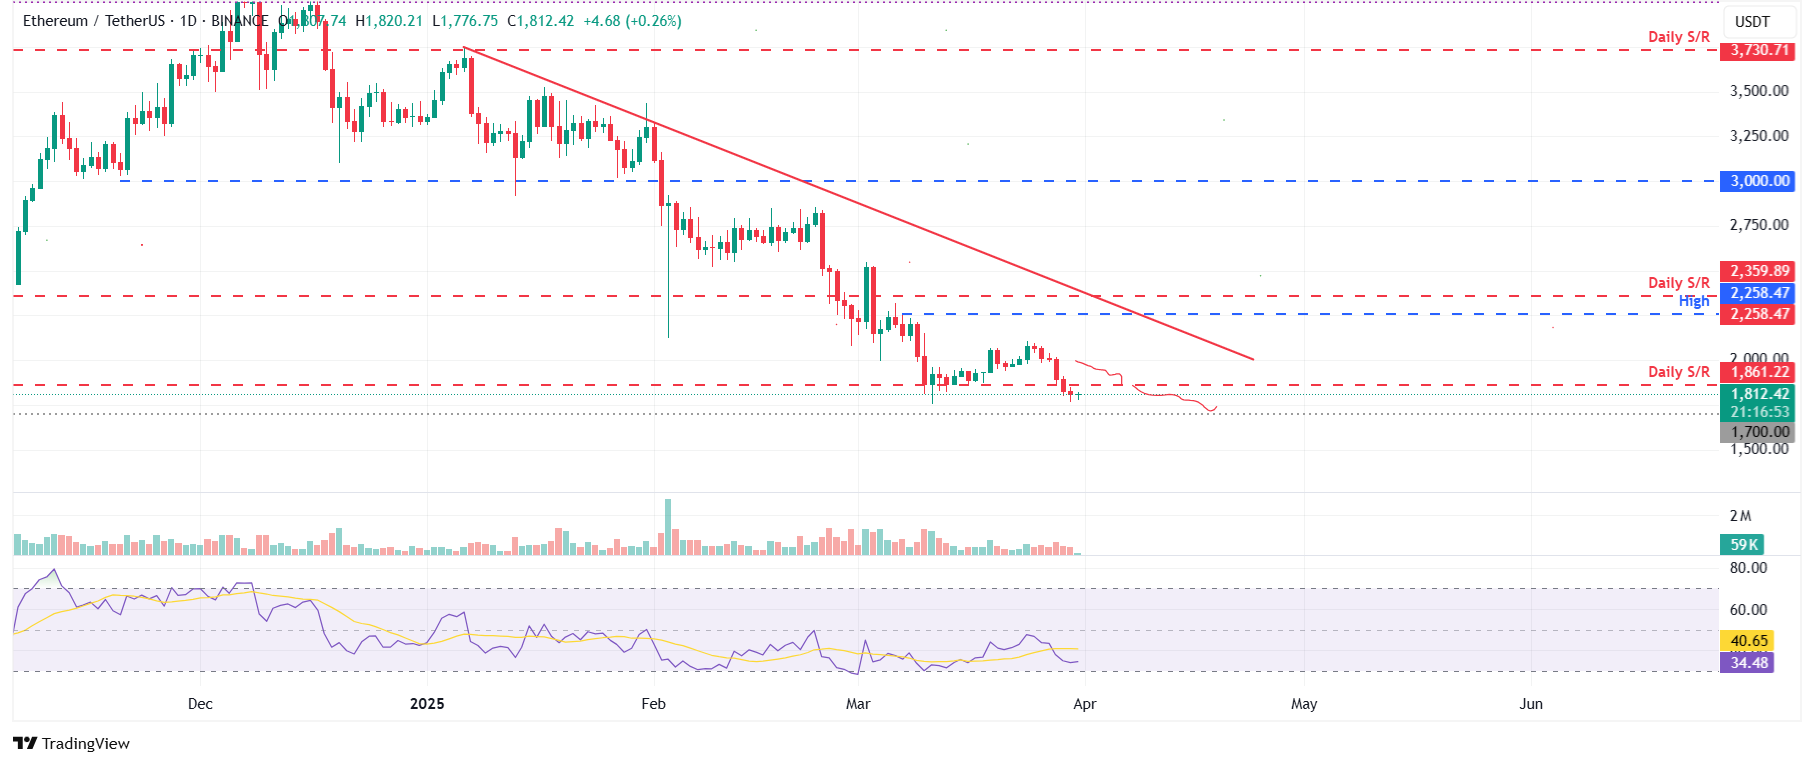
ETH/USDT daily chart
On the other hand, if it begins to recover, it may return to its previously held daily support level of $1,861.
Ripple displays weakness as it closes below its 100-day EMA
Ripple’s price settled below its 100-day EMA at $2.30 last week, leading to a 12.40% drop. As of Monday, it continues to trade around $2.11.
If XRP continues its correction, it may fall to test its next support level at $1.96.
The RSI on the daily chart is currently at 39, below the neutral threshold of 50, similarly indicating bearish momentum as seen in Bitcoin and Ethereum.
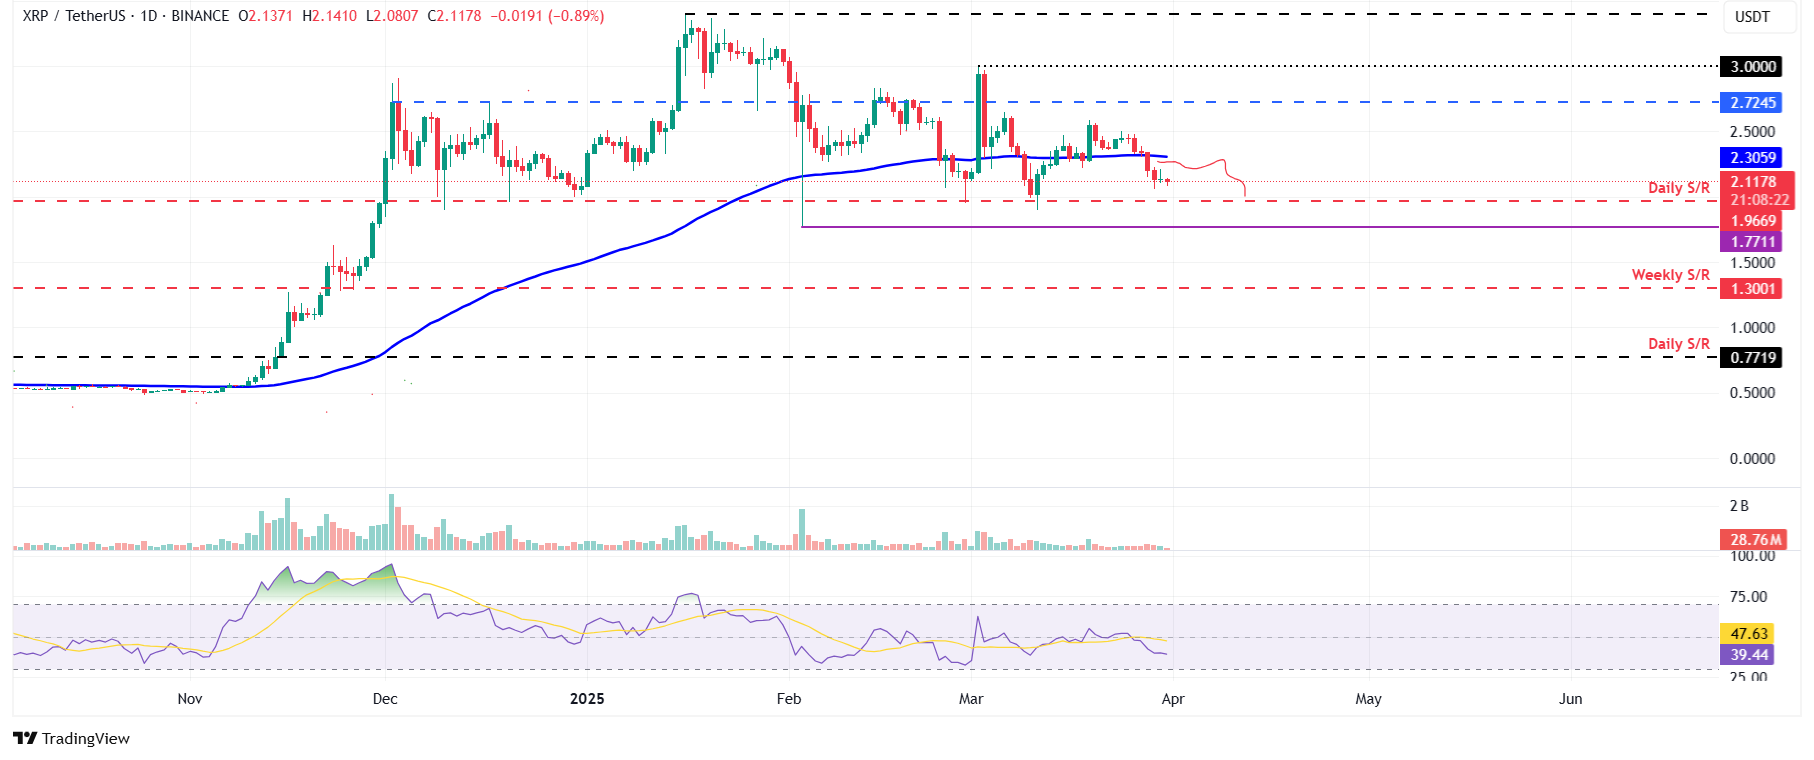
XRP/USDT daily chart
However, if XRP begins to recover, it may continue its upward movement toward the previously breached 100-day EMA at $2.30.
FAQs on Bitcoin, Altcoins, and Stablecoins
Bitcoin is the largest digital currency by market capitalization, intended to function as a form of money. This payment method is decentralized, meaning no single entity or group can control it, eliminating the necessity for third-party involvement in transactions.
Altcoins refer to any cryptocurrencies other than Bitcoin; however, some consider Ethereum a non-altcoin due to its foundational role in forking. If accepted, that would deem Litecoin the first altcoin, having been forked from Bitcoin’s protocol as an “enhanced” variant.
Stablecoins are cryptocurrencies designed to maintain a stable value, typically backed by a reserve of the asset they represent. To achieve this, a stablecoin’s value is pegged to a commodity or financial instrument like the US Dollar (USD), regulated by either an algorithm or market demand. The main aim of stablecoins is to offer a stable trading and investment option in the volatile cryptocurrency market.
Bitcoin dominance indicates the ratio of Bitcoin’s market cap to the total market cap of all cryptocurrencies combined. It offers insight into Bitcoin’s appeal among investors. Typically, high BTC dominance occurs prior to and during a bullish phase, as investors gravitate towards relatively stable, high market cap cryptocurrencies like Bitcoin. A decrease in BTC dominance often signals a shift in investor capital towards altcoins in search of higher returns, potentially sparking significant rallies in those assets.