The price of Cardano (ADA) continued its downward trajectory on March 31, experiencing a 4.5% decrease over the past 24 hours, bringing it to a trading value of $0.6529.
Over the last week, the altcoin has declined by 10% and has fallen 45% from its March 2 peak of $1.19.
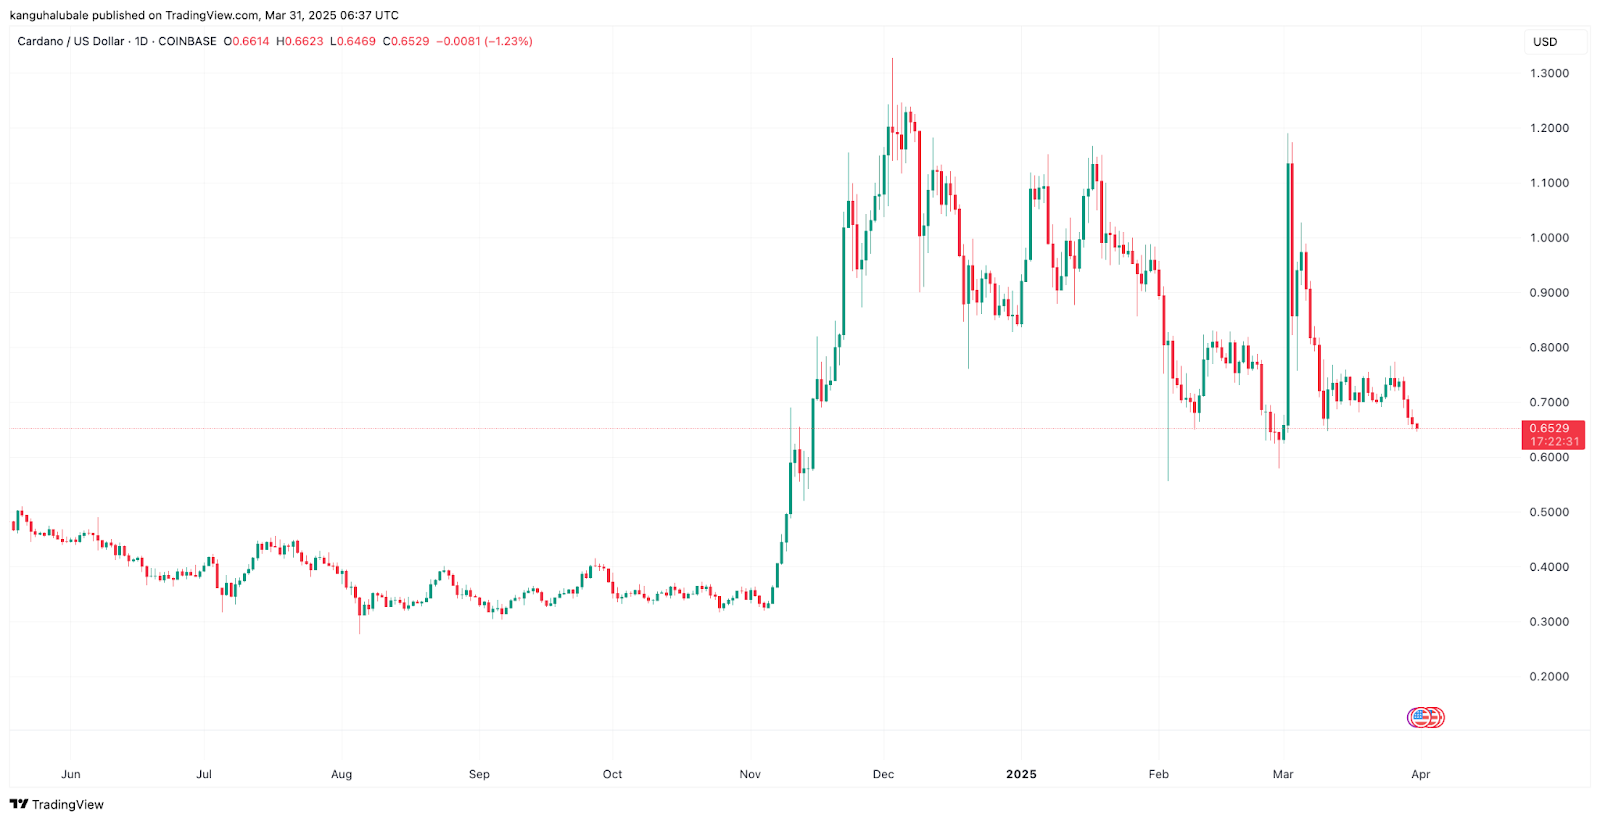
ADA/USD daily chart. Image source: TradingView
Several factors contribute to the poor performance of Cardano, including:
Declining Cardano on-chain activity
The current bearish sentiment around ADA’s price follows a notable decrease in network activity and total value locked (TVL), which has dropped significantly over the past month.
-
The number of active addresses on Cardano fell by over 70%, from 70,700 on March 2 to fewer than 20,000 by March 31.
-
Additionally, daily transactions have decreased by more than 71% during the same timeframe.
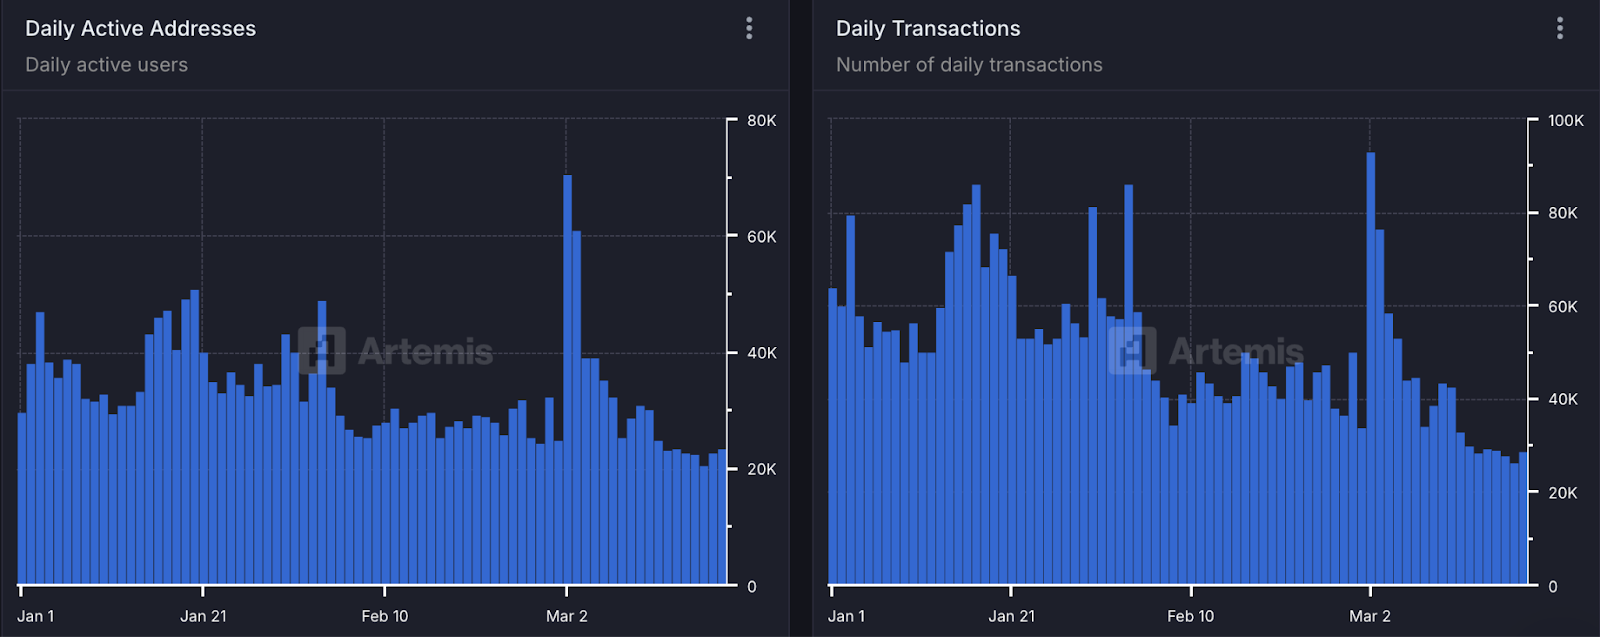
Daily active addresses and transactions on Cardano. Image source: Artemis
-
The TVL for Cardano has plummeted from $529.8 million on March 3, reaching only $317.9 million by March 31.
-
This figure has also decreased by 13% in the past five days.
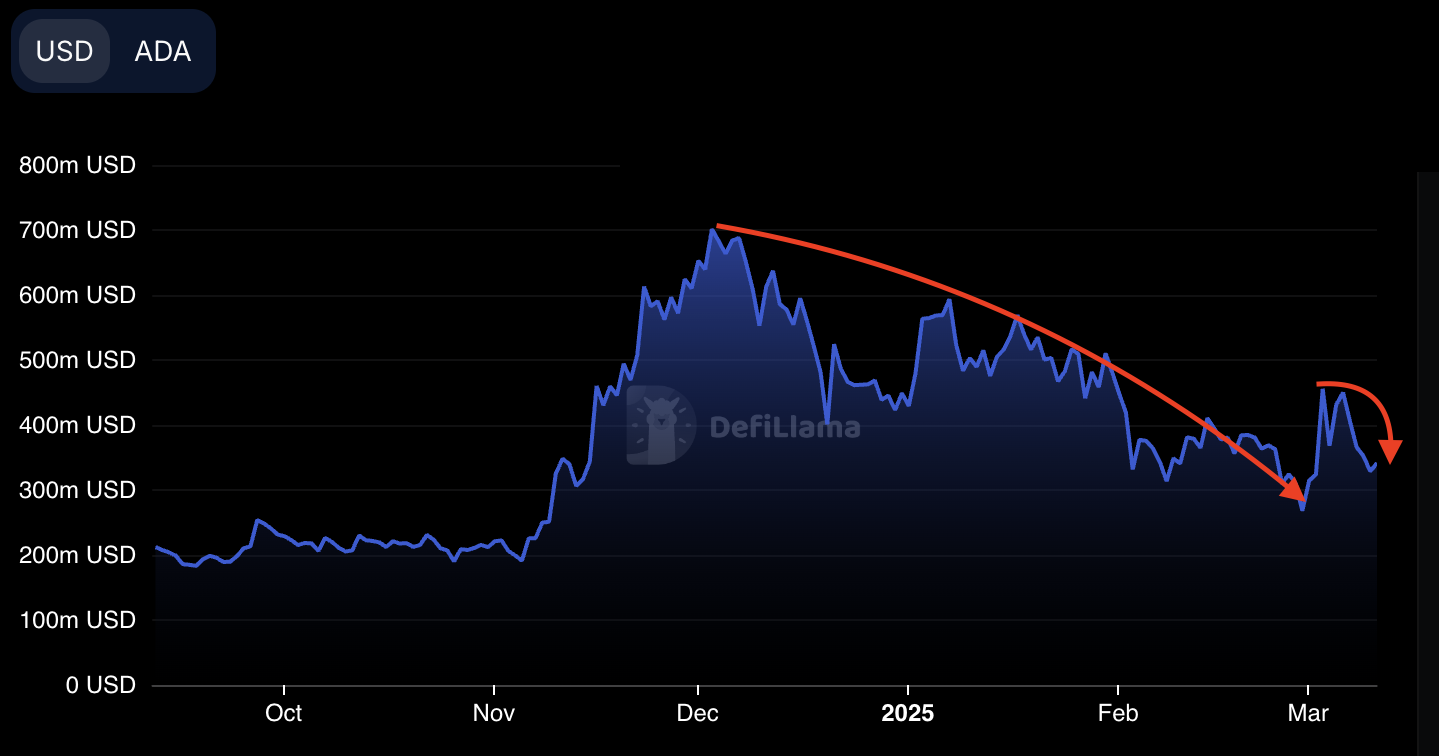
Total value locked in Cardano, USD. Image source: DefiLlama
Bearish signals from ADA futures data
The price struggles are compounded by a lack of enthusiasm in the derivatives market, reflected in low open interest and negative funding rates.
Key highlights include:
-
ADA funding rates have remained below zero for the past four weeks.
-
Negative funding rates indicate that shorts are compensating their counterparts to maintain their positions, highlighting the dominance of bearish sentiment in the market.
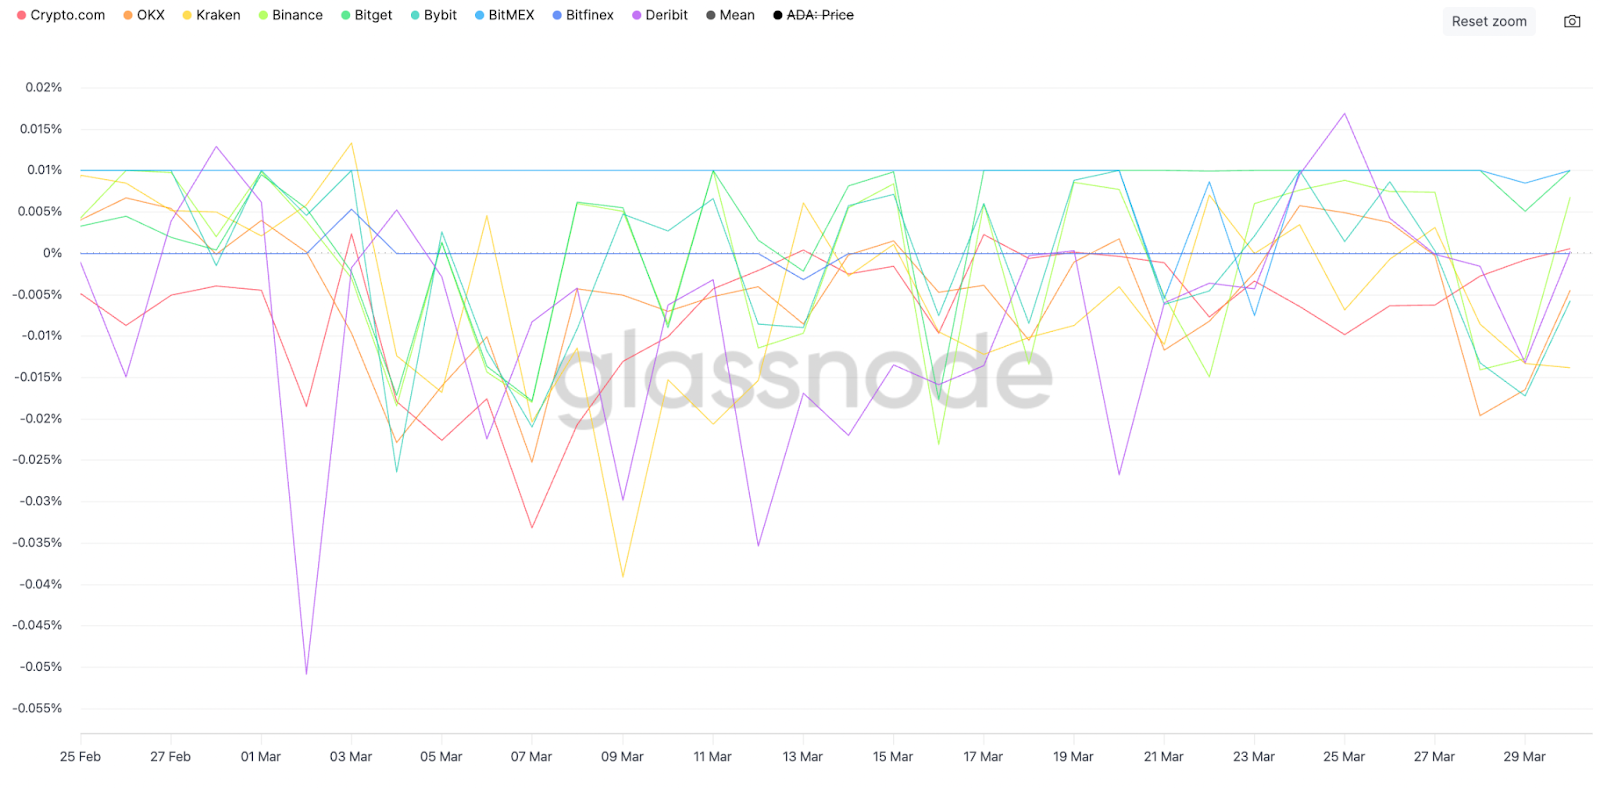
ADA funding rates. Image source: Glassnode
-
Moreover, the total open interest in perpetual futures across major exchanges has remained below $1.0 billion since March 4.
-
This is significantly lower than the $1.50 billion peak reached on January 18.
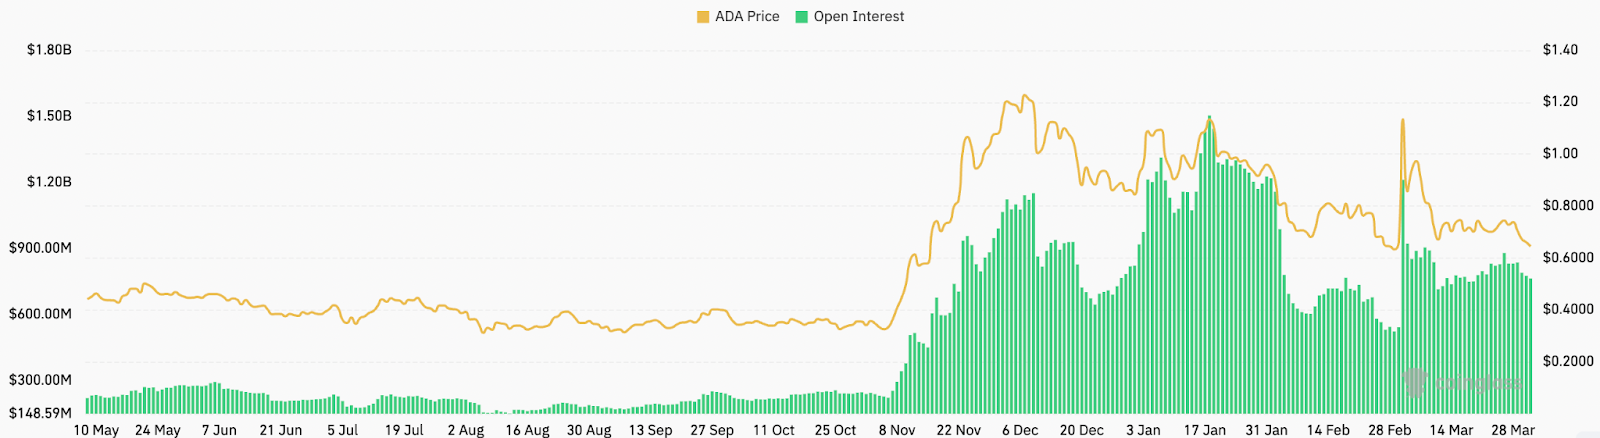
ADA open interest. Image source: CoinGlass
-
Historically, assets with declining open interest find it challenging to sustain upward momentum, as there is less capital and enthusiasm to propel prices higher.
-
For ADA, this suggests that even small amounts of selling pressure could lead to liquidations, especially if leveraged positions are unwound, putting further downward pressure on prices.
-
Without renewed interest from institutional or retail traders, ADA could face additional losses.
Moving averages suggest challenges for Cardano bulls
The current decline in ADA is part of a broader downtrend that began when prices were rejected from a significant resistance zone, as depicted in the chart below.
Related: Is Cardano (ADA) a “zombie crypto”?
Notable points include:
-
ADA’s price fluctuated between the 50-day simple moving average (SMA) and the 200-day SMA from March 9 to March 27.
-
All recovery efforts were thwarted by the 50-day SMA, which is currently positioned at $0.7531.
-
This indicates that whenever prices tried to breach this level, more sellers entered the market, creating additional sell-side pressure.
-
On March 28, the price fell below the 200-day SMA at $0.7262, converting this level into a resistance point as well.
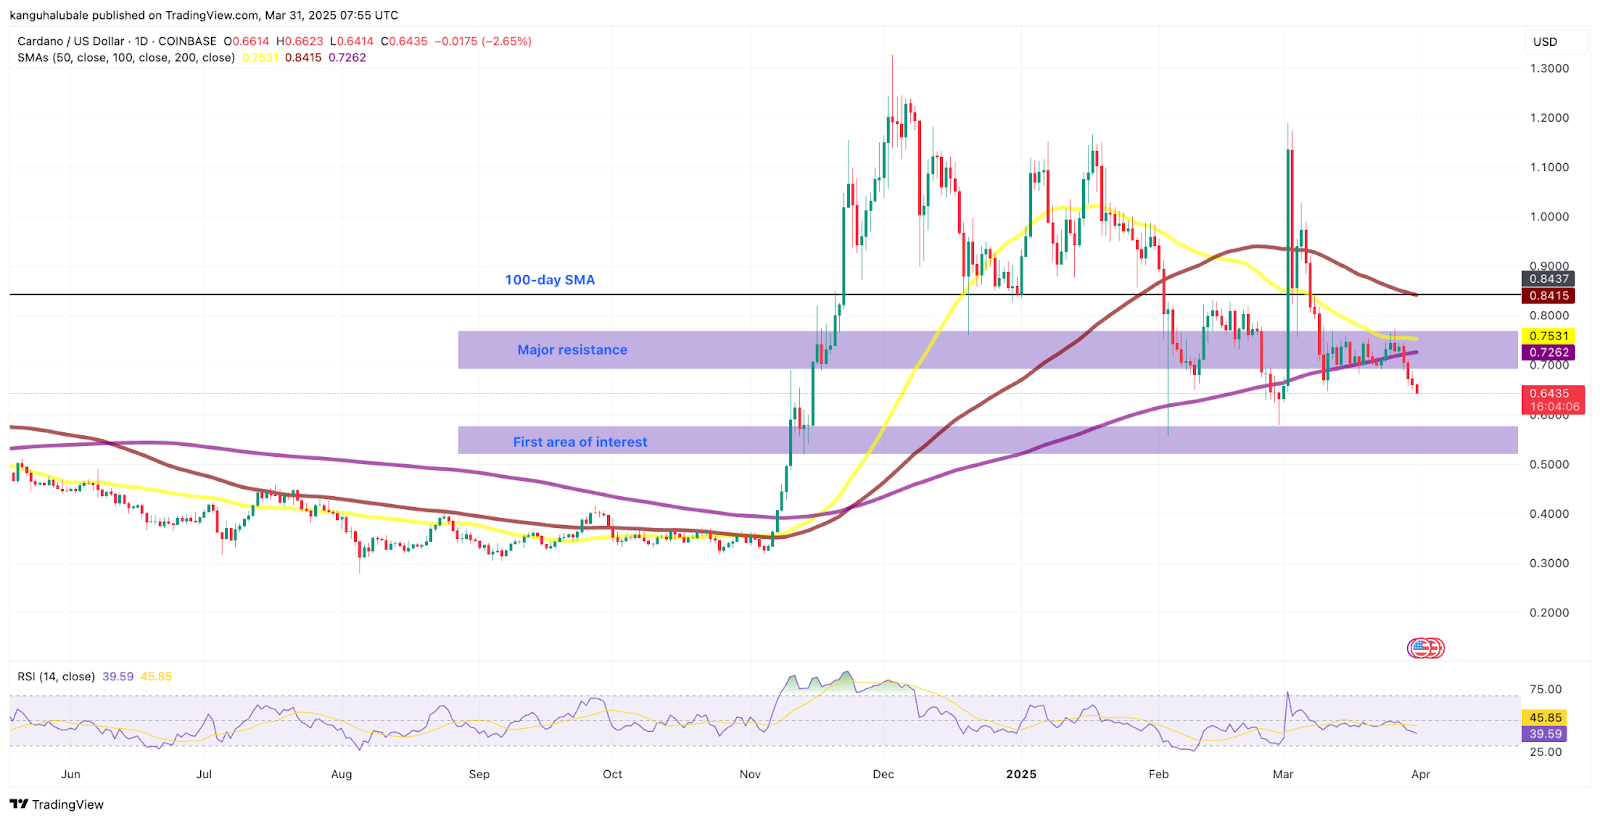
ADA/USD daily chart. Image source: TradingView
-
The next support level to monitor for ADA is the psychological barrier at $0.60.
-
Further down, significant interest appears between $0.5794 (a low on February 28) and $0.5197 (the low reached on November 13, 2024).
This article does not provide investment advice or recommendations. All investment and trading activities carry risks, and readers are encouraged to conduct their own research before making decisions.