XRP has experienced a decline of over 40% since reaching a multi-year peak near $3.40 in January, and on-chain metrics indicate that the downward trend may continue in the coming weeks.
“Denial” phase seen before prior XRP crashes returns
The Net Unrealized Profit/Loss (NUPL) data suggests that the cryptocurrency could be on the verge of another prolonged slump. This metric, which measures the total unrealized gains or losses among XRP holders, has historically acted as a solid indicator for potential reversals in market trends. Previous market cycles have shown that NUPL tends to peak in the “euphoria” zone just prior to significant price highs.
For instance, in 2018, XRP surged past $3.00 as NUPL indicated extreme optimism, only to plummet by 90% to below $0.30 as market sentiment shifted from “denial” to “capitulation.”
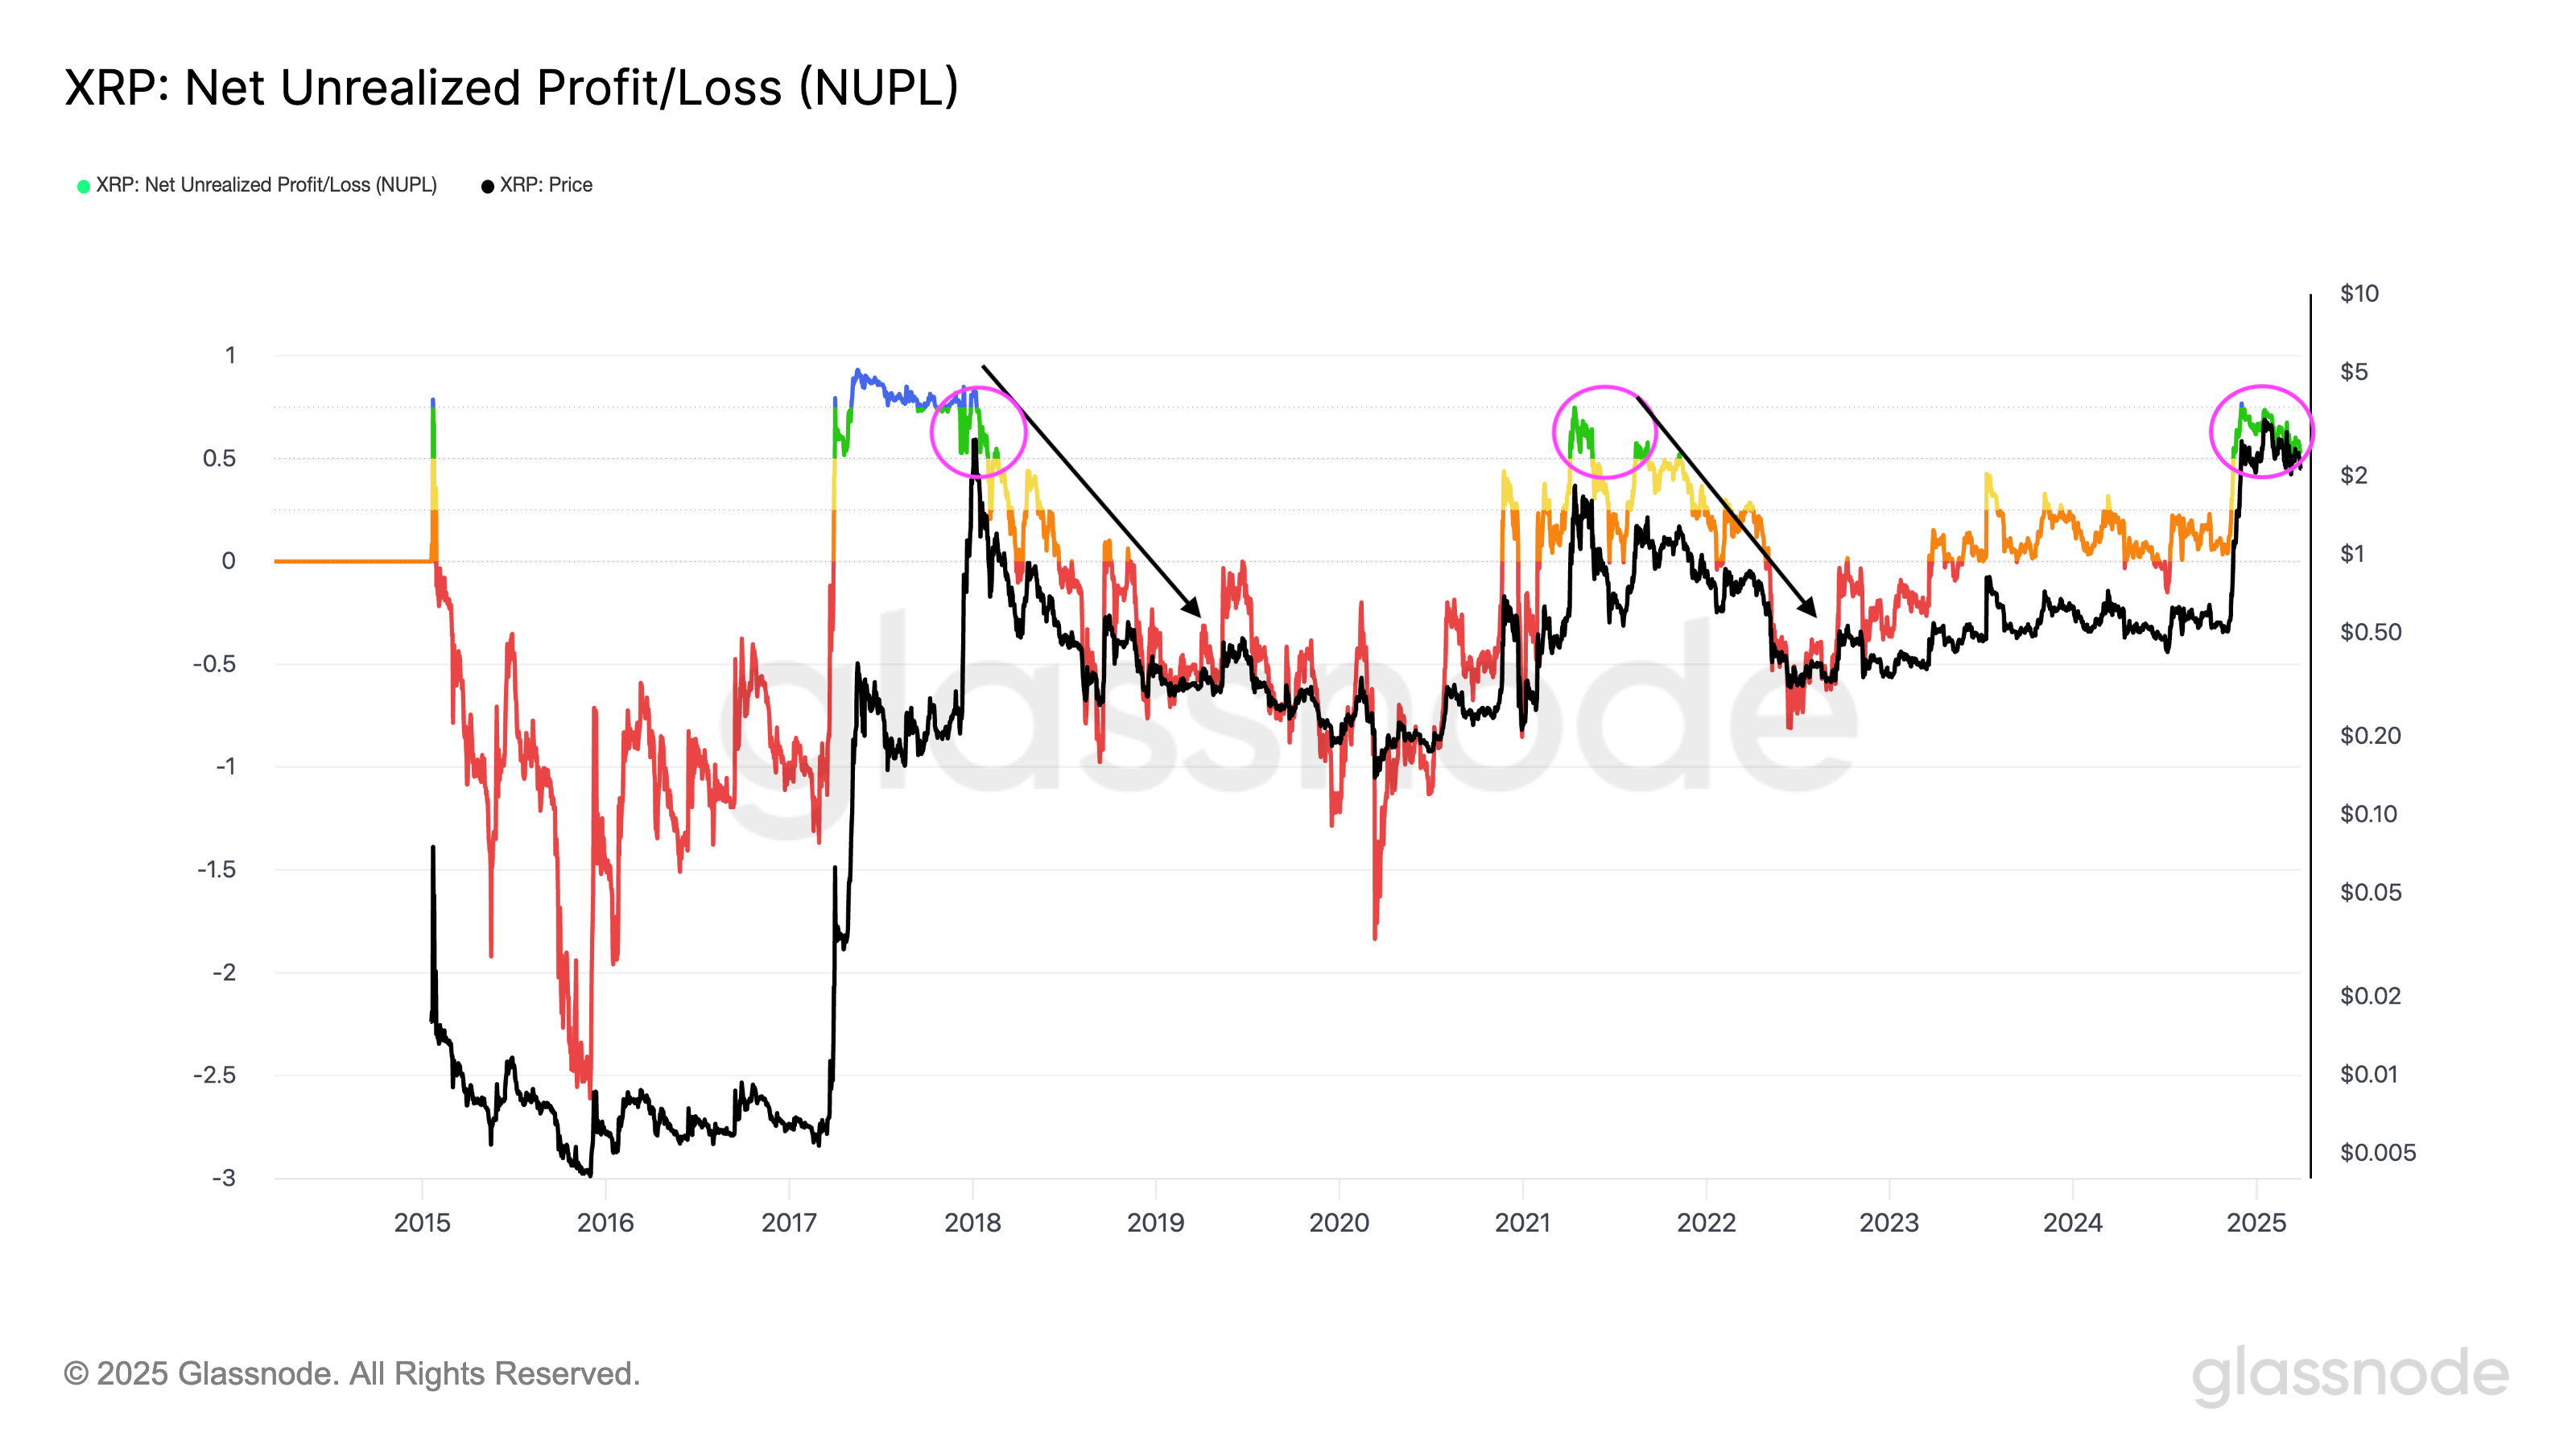
XRP NUPL historical performance chart.
A similar scenario unfolded in 2021 when XRP hit $1.96 before falling 75% to $0.50 as the market shifted from euphoria to fear.
As of March 2025, XRP’s NUPL has again slipped into the “denial” zone, with prices hovering around $2.50 after a robust rally. If history repeats, XRP could encounter further declines reminiscent of the bear markets seen in 2018 and 2021.
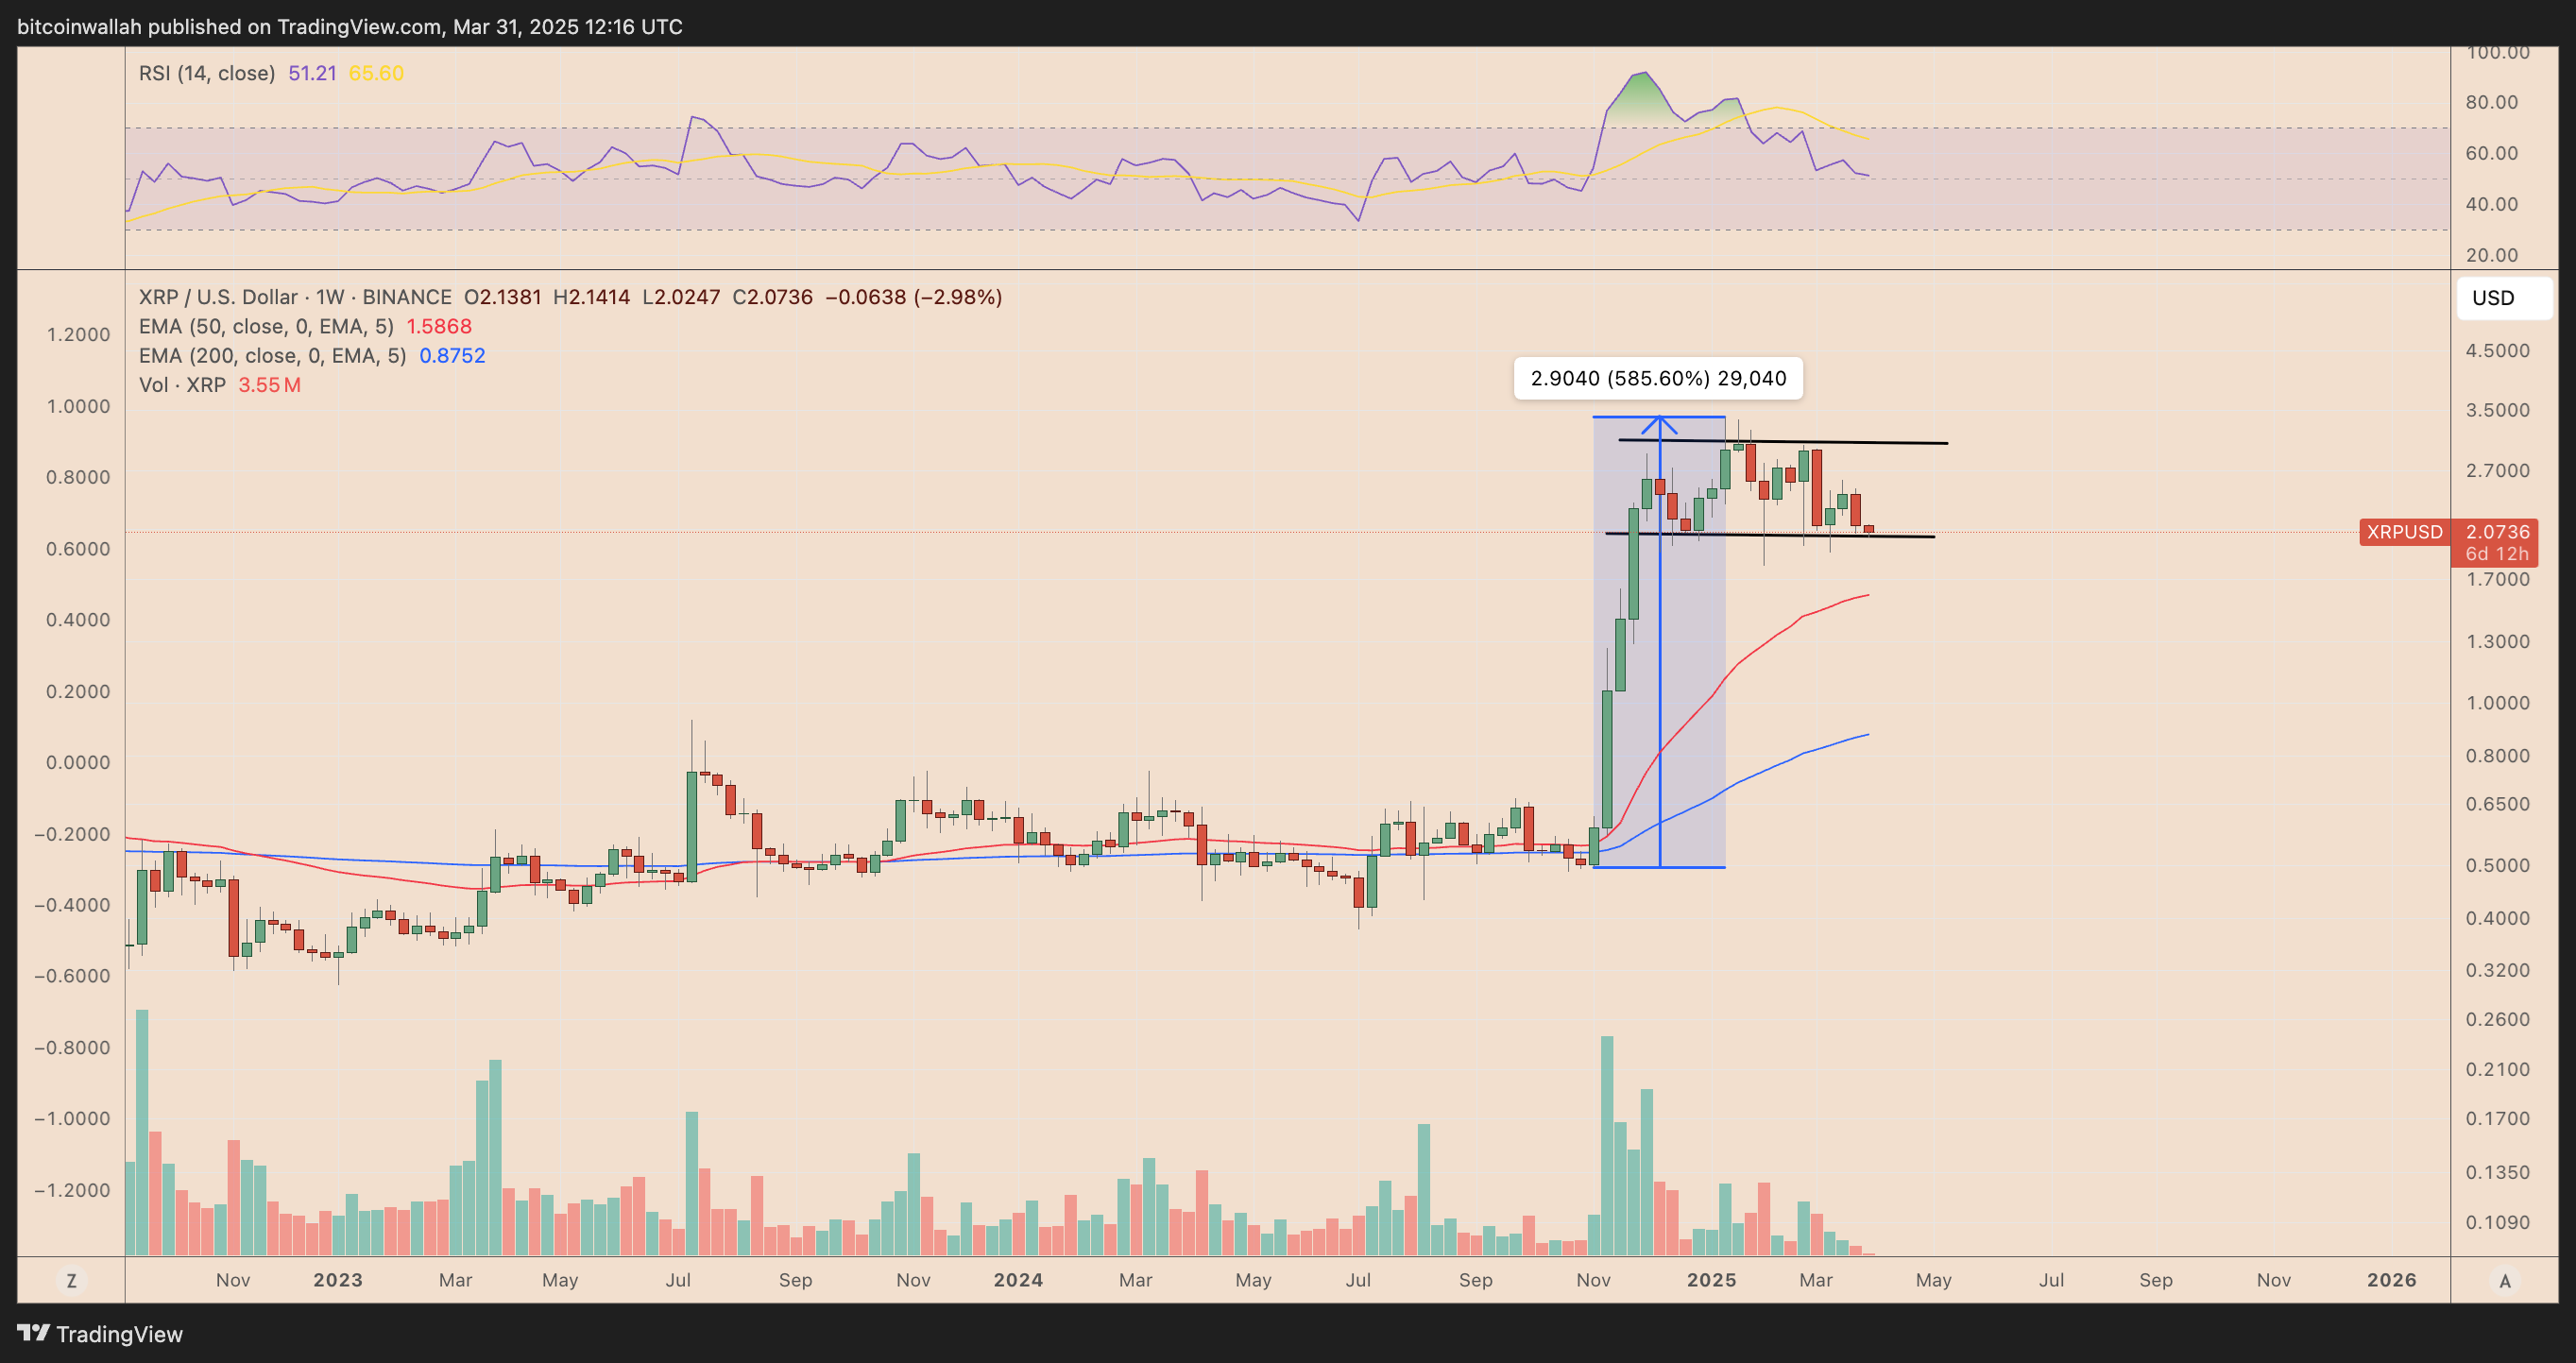
XRP/USD weekly price chart.
XRP currently faces substantial risks, trading in a range between $1.80 and $3.40 after a remarkable 585% rally over a mere two months.
This surge was fueled by pro-crypto candidate Donald Trump winning the U.S. presidential election, as well as growing speculation regarding Ripple’s potential win in its SEC lawsuit and the expected approval of a spot XRP ETF in 2025.
Related: SEC case resolution for XRP was ‘priced in’ since the election: Analysts
Technical fractal indicates XRP may be peaking
Analysis of XRP’s weekly chart suggests a bearish fractal reminiscent of 2021 might be emerging once more.
In both 2021 and 2025, XRP prices formed a local high while the RSI indicated lower highs, which signals bearish divergence and a weakening upward trend.
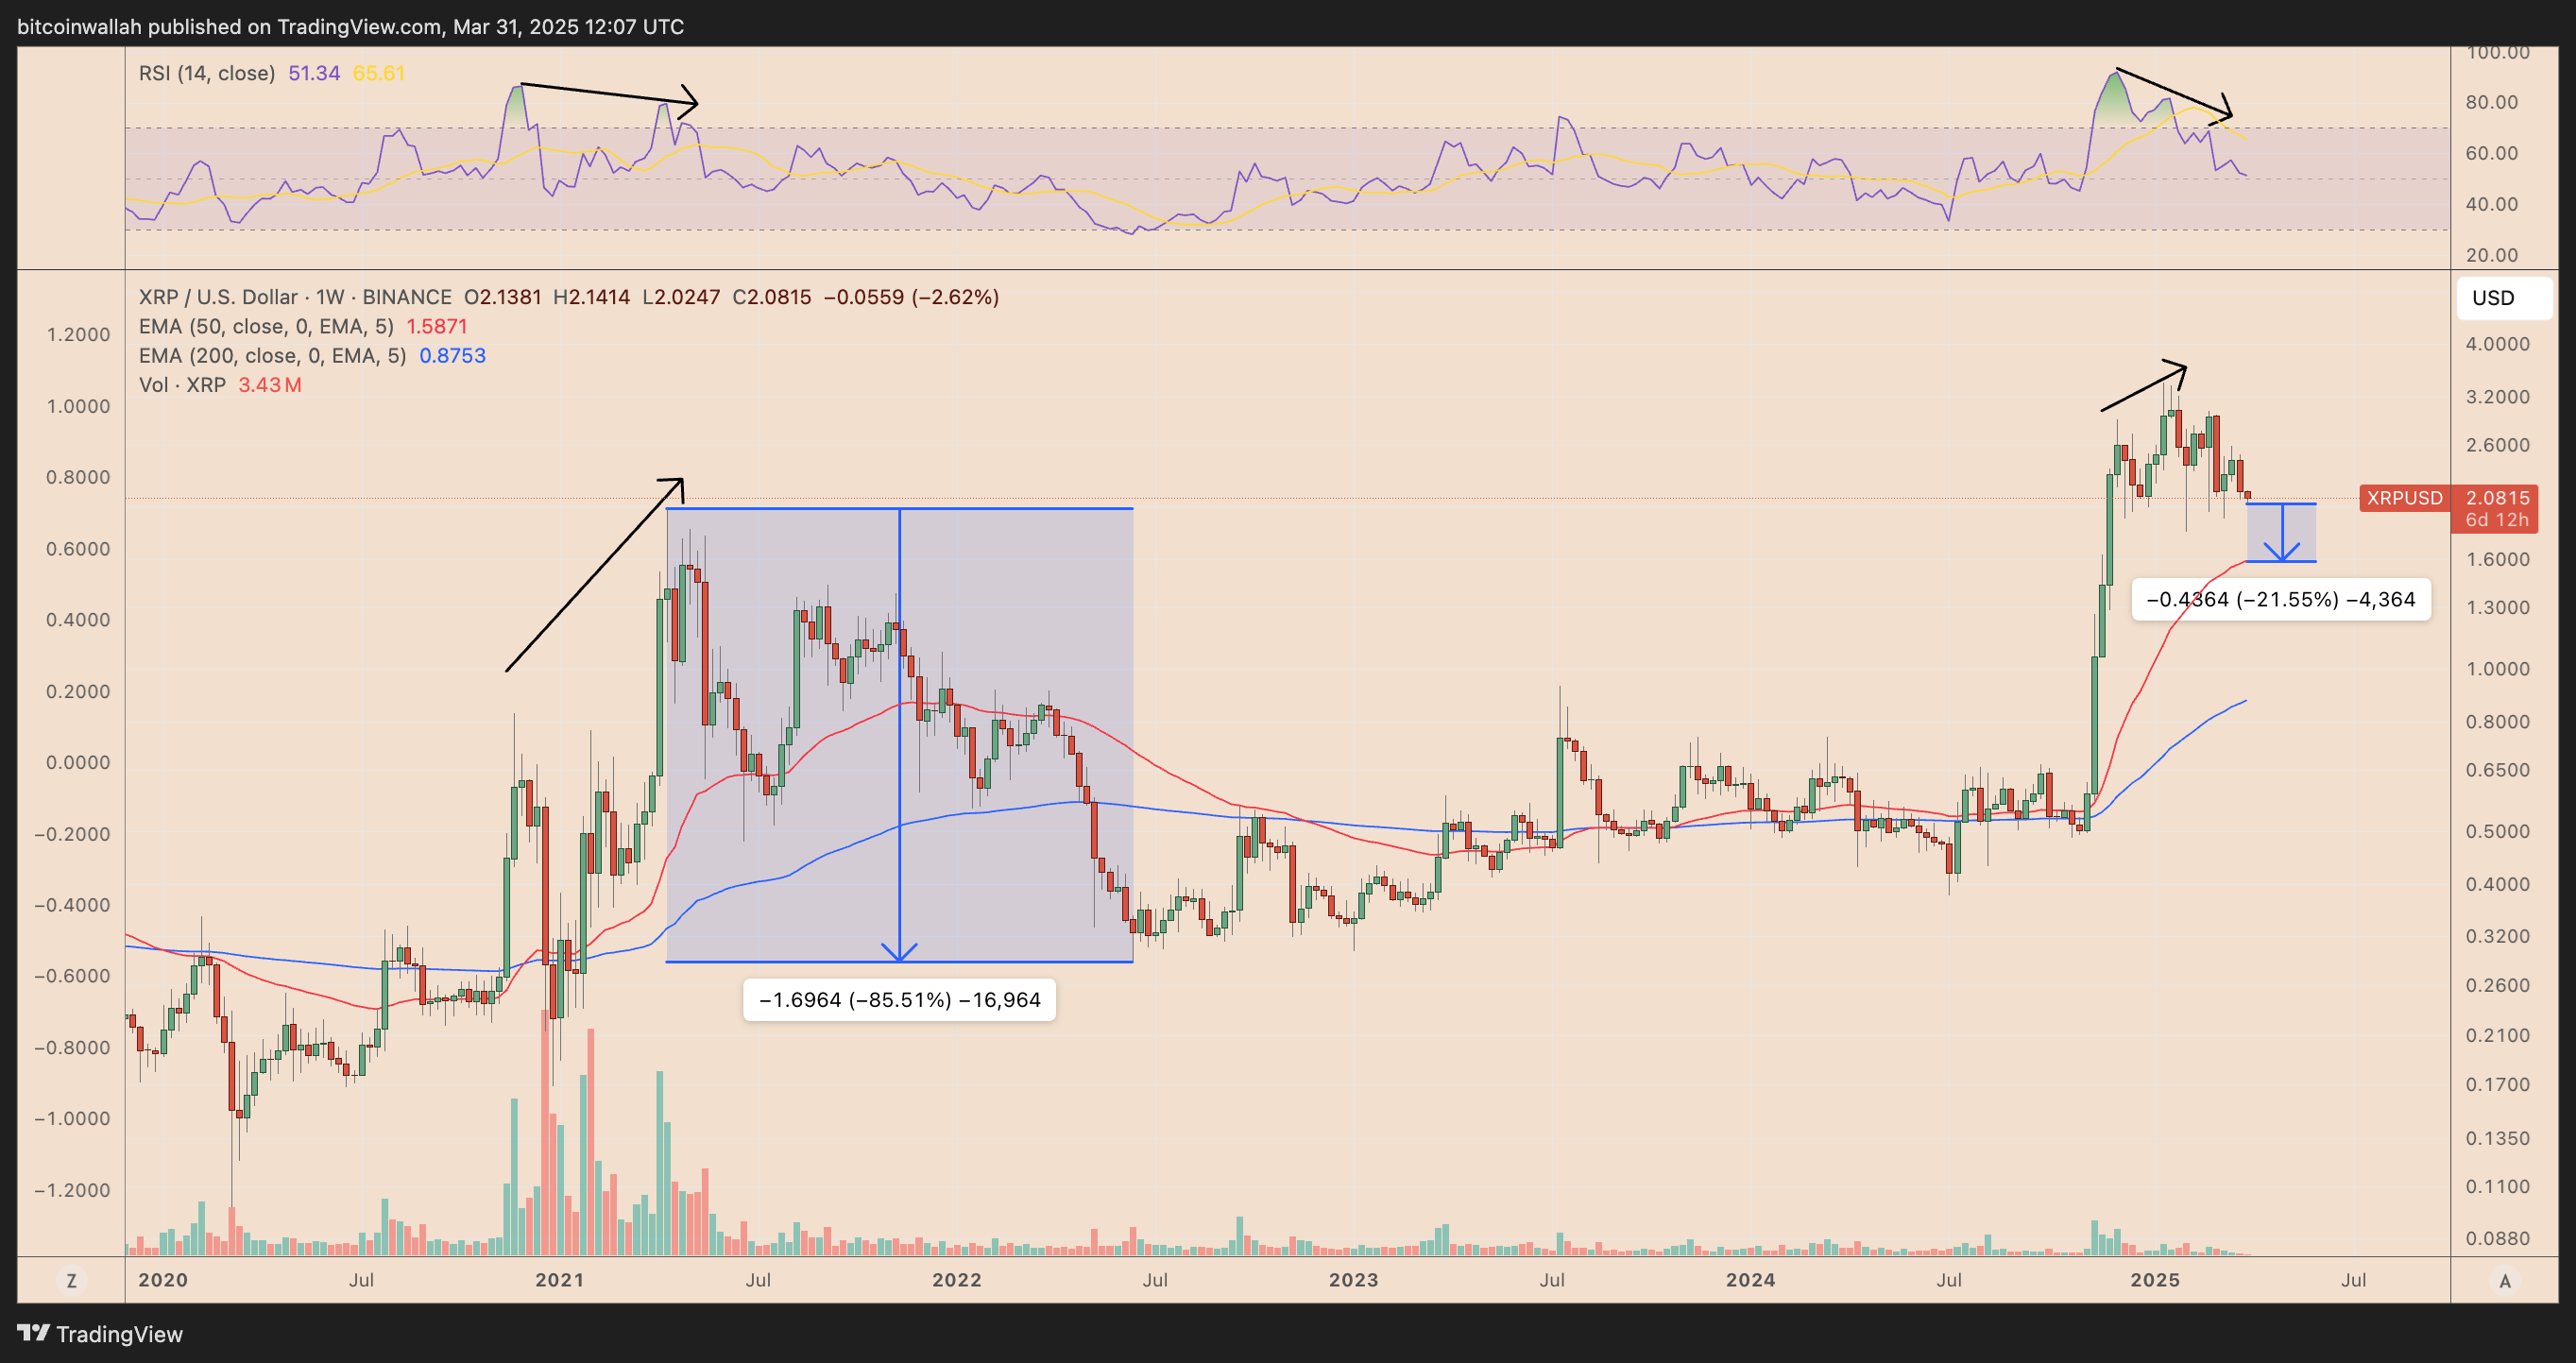
XRP/USD weekly price chart.
In 2021, this divergence preceded an 85.50% sell-off that breached critical support levels of the 50-week (the red wave) and 200-week (the blue wave) exponential moving averages (EMA).
In 2025, XRP has shown a similar RSI divergence, followed by a more than 40% drop from its recent highs. The cryptocurrency now faces the risk of a deeper decline toward the 50-week EMA, which is around $1.58, representing a potential decrease of about 21.6% from current levels by June.
If this correction intensifies and dips below the 50-week EMA support, historical patterns suggest XRP could fall further toward the 200-week EMA at approximately $0.87, a drop of around 60% from current price points.
This article does not provide financial advice or recommendations. All investments and trading activities carry risks, and individuals should perform their own due diligence before making decisions.