Does Ethereum still hold its position as the leading Layer 1 blockchain amidst Solana’s rise and with the ETH/BTC ratio dipping below 0.022?
ETH/BTC reaches a multi-year low
Ethereum (ETH), the second-largest cryptocurrency by market capitalization, is currently grappling with a challenging situation. The ETH/BTC ratio, which assesses Ethereum’s performance against Bitcoin (BTC), has plummeted to 0.022, marking its lowest point since December 2020 and indicating a significant decline in Ethereum’s relative standing.
Since hovering around 0.085 in September 2022, Ethereum’s value compared to Bitcoin has decreased by over 73%. Currently, ETH is priced around $1,880, which is a 9% decline over the past week and a staggering 62% drop from its peak of $4,890 in November 2021.
In comparison, Bitcoin, which is down approximately 10% this year and trading around $84,300, has shown a relatively mild decline, while Ethereum’s 46% drop in the same timeframe is more than four times heavier.
This declining ratio mirrors Ethereum’s waning influence in the smart contract and Layer 1 ecosystem, a domain it previously dominated without significant challenge.
With other Layer 1 networks like Solana (SOL), Binance Chain (BNB), and Avalanche (AVAX) gaining momentum while Bitcoin solidifies its lead, Ethereum appears to be struggling to maintain its footing.
Let’s delve deeper into the factors contributing to this shift, exploring whether Ethereum is genuinely losing relevance, and what implications this may have for the Layer 1 blockchain landscape.
Ethereum’s metrics show signs of decline
As of April 1, Ethereum’s total value locked is approximately $50.5 billion, accounting for 52.5% of the overall market. This reflects a notable decrease from 61.64% in February 2024, indicating a steady loss of market share in decentralized finance.
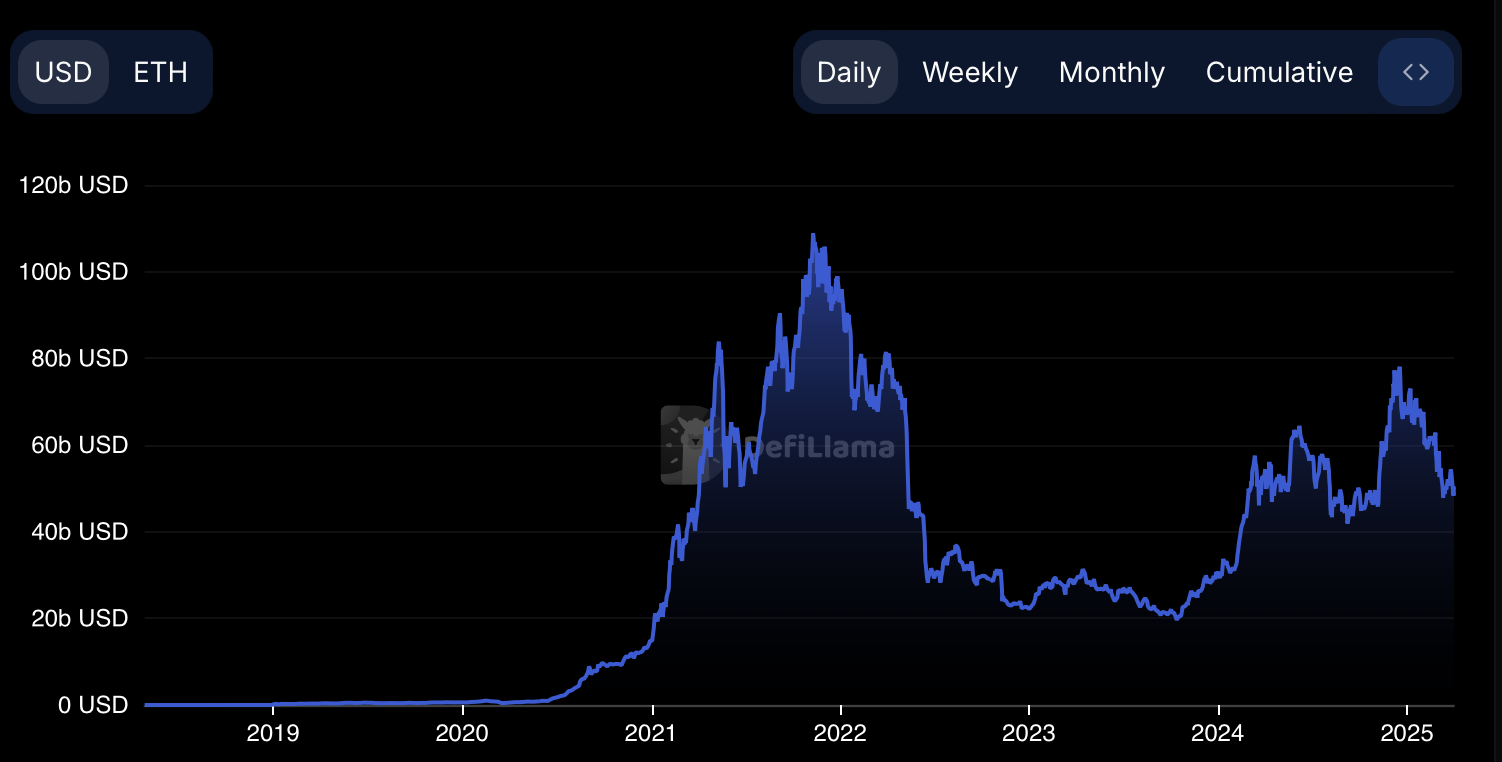
This decline can be partly attributed to the rise of competitors like Solana, whose total value locked has surged from 2.84% to 7.24%, bringing their total TVL to $6.69 billion, marking over a 2.5x increase in just over a year.
User behavior across platforms is also evolving. Ethereum continues to draw users engaging in passive DeFi strategies such as yield farming and staking.
Conversely, Solana is attracting more active traders, particularly in speculative meme tokens and high-frequency DeFi products, suggesting Ethereum’s existing use cases, while strong, may not align with current retail trends.
While Ethereum’s historically high gas fees have seen improvement, with average prices dropping to 1.12 GWEI in March 2025—significantly lower than previous years—the platform still remains less affordable and slower compared to newer networks, especially for smaller transactions.
In the meantime, while Bitcoin ETFs have garnered over $36 billion in net inflows, Ethereum ETFs are struggling to attract the same interest. In March 2025 alone, net inflows into ETH ETFs declined by 9.8%, falling to $2.43 billion.
Market sentiment regarding Ethereum appears to be weakening as well. Reports indicate that short positions on Ethereum climbed 40% in early February and have surged over 500% since November 2024, reaching unprecedented bearish levels.
Furthermore, Ethereum’s market dominance has dropped below 8.4%, its lowest point in over four years. Analysts have suggested that this indicates a trend of capital flowing out of ETH into alternative options including Bitcoin, Solana, and newer Layer 1 platforms that are taking advantage of Ethereum’s stagnation.
Scalability challenges are becoming apparent
For years, Ethereum’s growth story has been tied to its potential for scaling. Yet, as of early 2025, this potential remains largely unmet at the base layer. Even after several protocol enhancements, Ethereum’s mainnet still manages only 10 to 62 transactions per second.
At present, its effective throughput hovers around 16 transactions per second—a stark contrast to Solana’s impressive 4,322 TPS. This disparity is a key reason why new users and applications are opting to develop on rival platforms.
The transition to proof-of-stake through the Merge in 2022 greatly enhanced Ethereum’s energy efficiency, reducing energy consumption by over 99%. However, it did little to alleviate the network’s core throughput constraints.
Consequently, Ethereum has increasingly turned to Layer 2 rollups, such as Arbitrum (ARB), Optimism (OP), and Base, to boost its functionality. These networks enhance Ethereum’s capabilities by conducting transactions off-chain and later validating them on the mainnet.
While L2 adoption has lowered user expenses, it has unintentionally led to a shift in activity away from Ethereum’s mainnet, pulling both users and transaction fees toward L2 ecosystems.
A user on X remarked, “Arbitrum and Optimism are garnering fees while Ethereum’s base layer is feeling like a ghost town.”
Data supports this trend. Analysts like Geoff Kendrick from Standard Chartered assert that Layer 2 solutions, particularly high-traffic ones like Coinbase’s Base, are draining billions in transaction fees that would generally benefit Ethereum’s mainnet.
Kendrick estimates that Base alone has removed roughly $50 billion in value from Ethereum’s market capitalization by redirecting economic activity. This diversion results in fewer ETH being burned through transaction fees, undermining its deflationary mechanics and the previously touted narrative of ETH as “ultrasound money.”
Post EIP-1559, Ethereum’s fee-burning mechanism was expected to help offset issuance. However, with activity now dispersed across numerous rollups and sidechains, overall fee burns have significantly decreased.
ETH has once again reverted to being net inflationary, now at an annualized rate of 0.5%. Meanwhile, staking yields have declined to below 2.5%, making ETH less appealing compared to stablecoin strategies that offer returns over 4.5% on DeFi platforms.
The upcoming upgrade, Pectra, aimed at enhancing Layer 2 efficiency by boosting blob capacity from three to six for data availability, isn’t likely to make a substantial difference either.
Kendrick has expressed skepticism regarding Pectra’s ability to reverse the overarching decline of the ETH/BTC ratio, deeming the update insufficient to address Ethereum’s fundamental structural challenges.
Simultaneously, Ethereum’s mainnet activity seems to be diminishing. Bots, including address poisoning bots, are increasingly consuming gas on leading contracts, with fewer genuine applications deploying directly to the mainnet.
As one user succinctly put it, “ETH mainnet is becoming a graveyard.” While this may be an exaggeration, it underscores a growing perception that Ethereum’s core layer is losing its standing as the premier site for on-chain innovation.
Ethereum price prediction: Are we nearing the bottom?
Market analysts have presented a wide range of potential outcomes, but the risks seem to be accumulating more rapidly for ETH compared to possible positive catalysts.
From a macro perspective, Ethereum remains heavily linked to the broader landscape of risk assets. Bloomberg strategist Mike McGlone pointed out that “ETH remains closely correlated with risk assets,” suggesting its performance is likely to mirror that of U.S. equities and sectors with high volatility.
Should stock markets continue to decline in 2025, particularly amid high interest rates, ongoing inflation, or slowing global growth, Ethereum could experience intensified downward pressure.
McGlone cautioned that in a deteriorating macro environment, ETH may “potentially revisit the $1,000 level,” representing a nearly 50% drop from current prices.
From a technical perspective, the price structure is also reflecting challenges. Analyst Mags noted that Ethereum has “one of the worst charts of all time,” highlighting repeated failures to break above the $4,000 resistance level during this current cycle.
Following three attempts, ETH not only failed to reclaim its highs but also lost support at its mid-range level and fell below a previously upward-trending support line.
This breakdown, in conjunction with the absence of robust support at present levels, opens the door for a potential retest around the $1,060 mark—a price level last observed during the 2022 bear market. Mags observed, “technically speaking, the bearish scenario appears more probable.”
On a more optimistic note, trader Michaël van de Poppe pointed out that Ethereum may be beginning to show signs of a “deviation.”
He believes that if ETH can convincingly break above the $2,100 to $2,150 range, it could trigger a rapid advance to $2,800, indicating renewed momentum in the market.
Additionally, he noted a recent decline in the U.S. Dollar Index as a positive macroeconomic signal, suggesting that a weaker dollar might support a crypto rebound in Q2.
Nevertheless, these bullish scenarios hinge on Ethereum reclaiming crucial technical levels and a favorable shift in overall market sentiment. Until then, downside risks remain more pronounced.
In the short term, Ethereum’s trajectory closely mirrors macroeconomic trends and Bitcoin’s performance. A decisive breakthrough above $2,150 could signal the beginning of a recovery phase. Without such movement, however, ongoing technical and structural pressures are likely to persist.
Exercise caution and only invest what you can afford to lose.
Disclaimer: This article is not intended as investment advice. The information and materials presented here are for educational purposes only.