The price of XRP (XRP) declined by 22% from March 19 to March 31, possibly establishing a local bottom at $2.02. Subsequently, it rose by 9% to $2.20 before retreating to the current levels.
Could the widely followed altcoin have finally hit its bottom, or is a further pullback on the horizon?
XRP shows bullish divergence across multiple timeframes
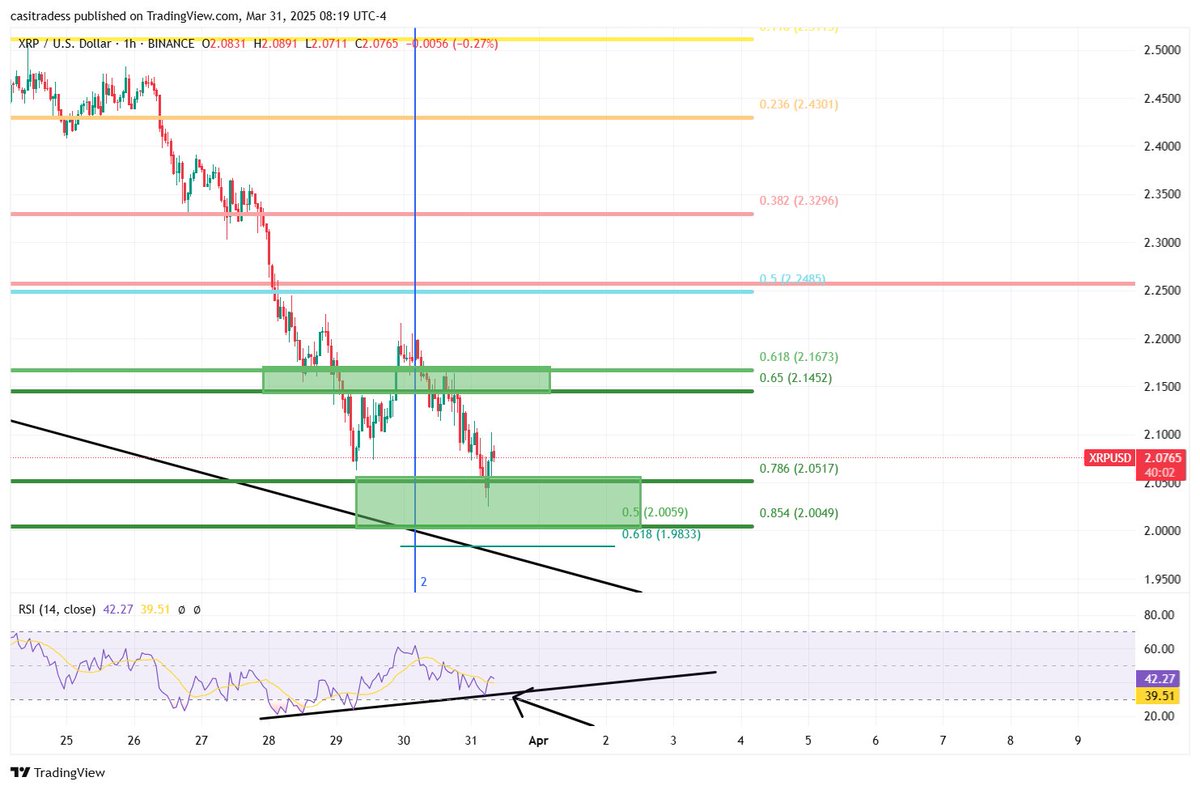
According to notable analyst CasiTrades, the relative strength index (RSI) for XRP indicates bullish divergence on shorter timeframes.
This bullish divergence occurs when the price of the asset makes lower lows, while the RSI forms higher lows, suggesting that the selling pressure is diminishing.
“After hitting the 0.786 retracement at $2.05, XRP is demonstrating bullish divergences from the 15-minute up to the 4-hour charts,” the analyst noted in a March 31 post.
CasiTrades highlights that these indicators signal potential for both short-term rebounds and a possible macro recovery.
“That’s the type of signal we want for identifying both a short-term bottom and macro conditions! The rebound is holding strong so far!”

XRP/USD hourly chart. Image source: CasiTrades
She also mentioned that $2.25 is a crucial resistance level to monitor, as a strong breakout above this price would suggest a significant bullish shift.
“If we manage to rise above $2.25 with robust momentum, it would negate the need for another support retest—a very bullish sign,” she stated, adding that the demand zone between $2.00 and $2.01 would act as support if $2.05 fails to hold.
The analyst is optimistic about XRP’s prospects for April, setting short-term targets of $2.70 and $3.70.
“Once the price reaches these targets, I anticipate a substantial upward movement! Key resistance levels align at $2.70 and $3.80.”
Related: XRP funding rate turns negative — Will savvy traders go long or short?
Is XRP’s local bottom confirmed?
Even with XRP’s recent recovery from local lows, the possibility of a deeper correction still exists, according to seasoned trader Peter Brandt.
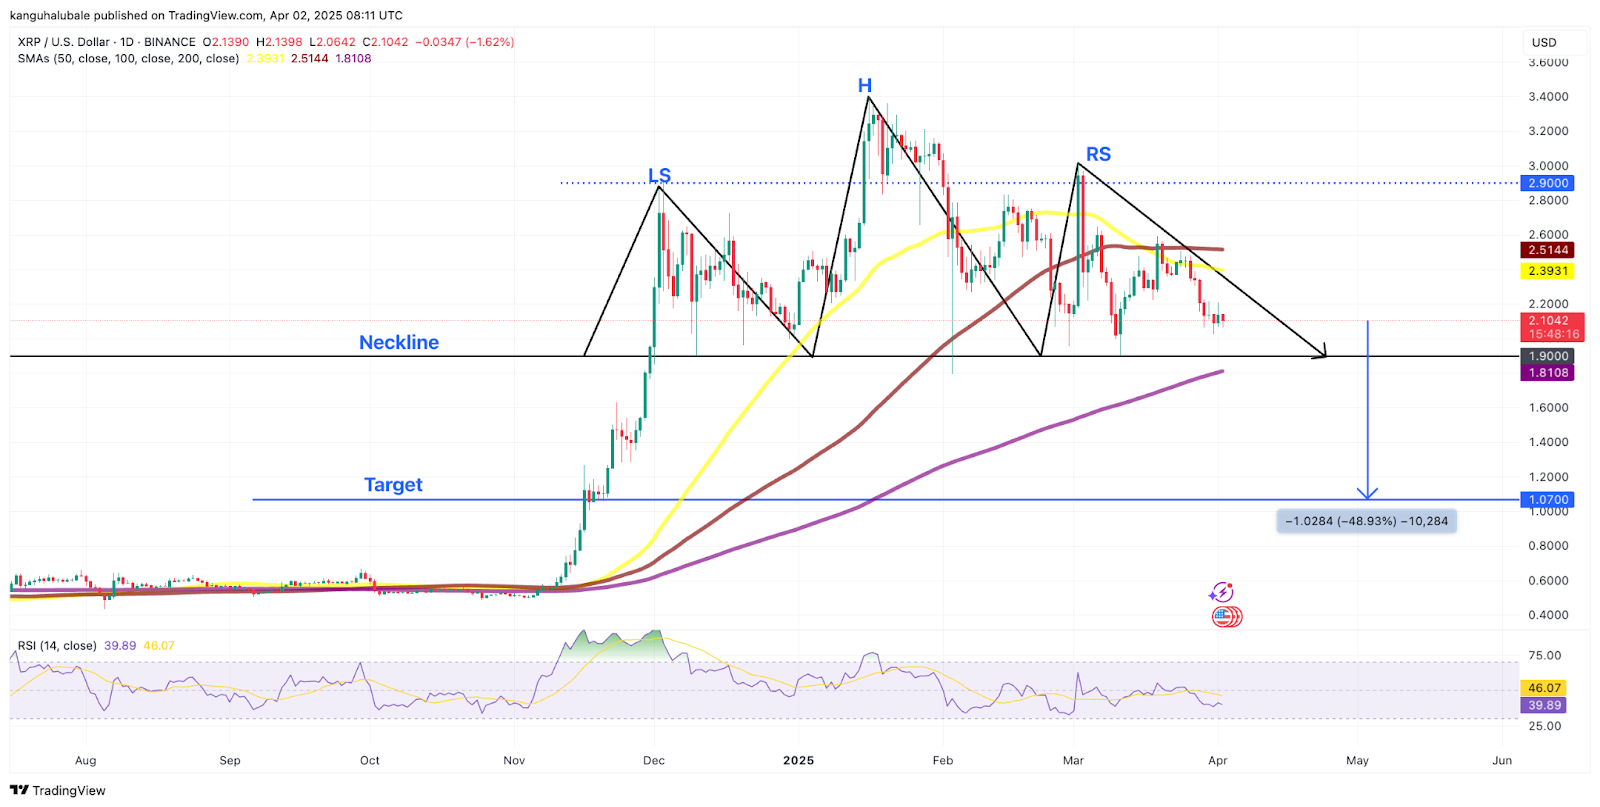
Last week, Brandt pointed out the formation of a “textbook” head-and-shoulders pattern (H&S), which could see the XRP price drop to $1.07.
This potential H&S pattern remains active on the daily chart and would be completed with a break and a close below the neckline at $1.90.
If the price remains below this neckline, the cryptocurrency could tumble to $1.50, and further to the pattern’s target of $1.07.
Brandt commented:
“I wouldn’t want to hold it below $1.90. The H&S pattern projects to $1.07. Don’t shoot the messenger.”

XRP/USD daily chart featuring the H&S pattern. Image source: TradingView
Brandt states that this bearish chart formation would be invalidated if buyers push the price above $3.00.
Additionally, macroeconomic challenges stemming from US tariffs effective April 2 might unsettle traders, potentially dragging the XRP price down to $1.31.
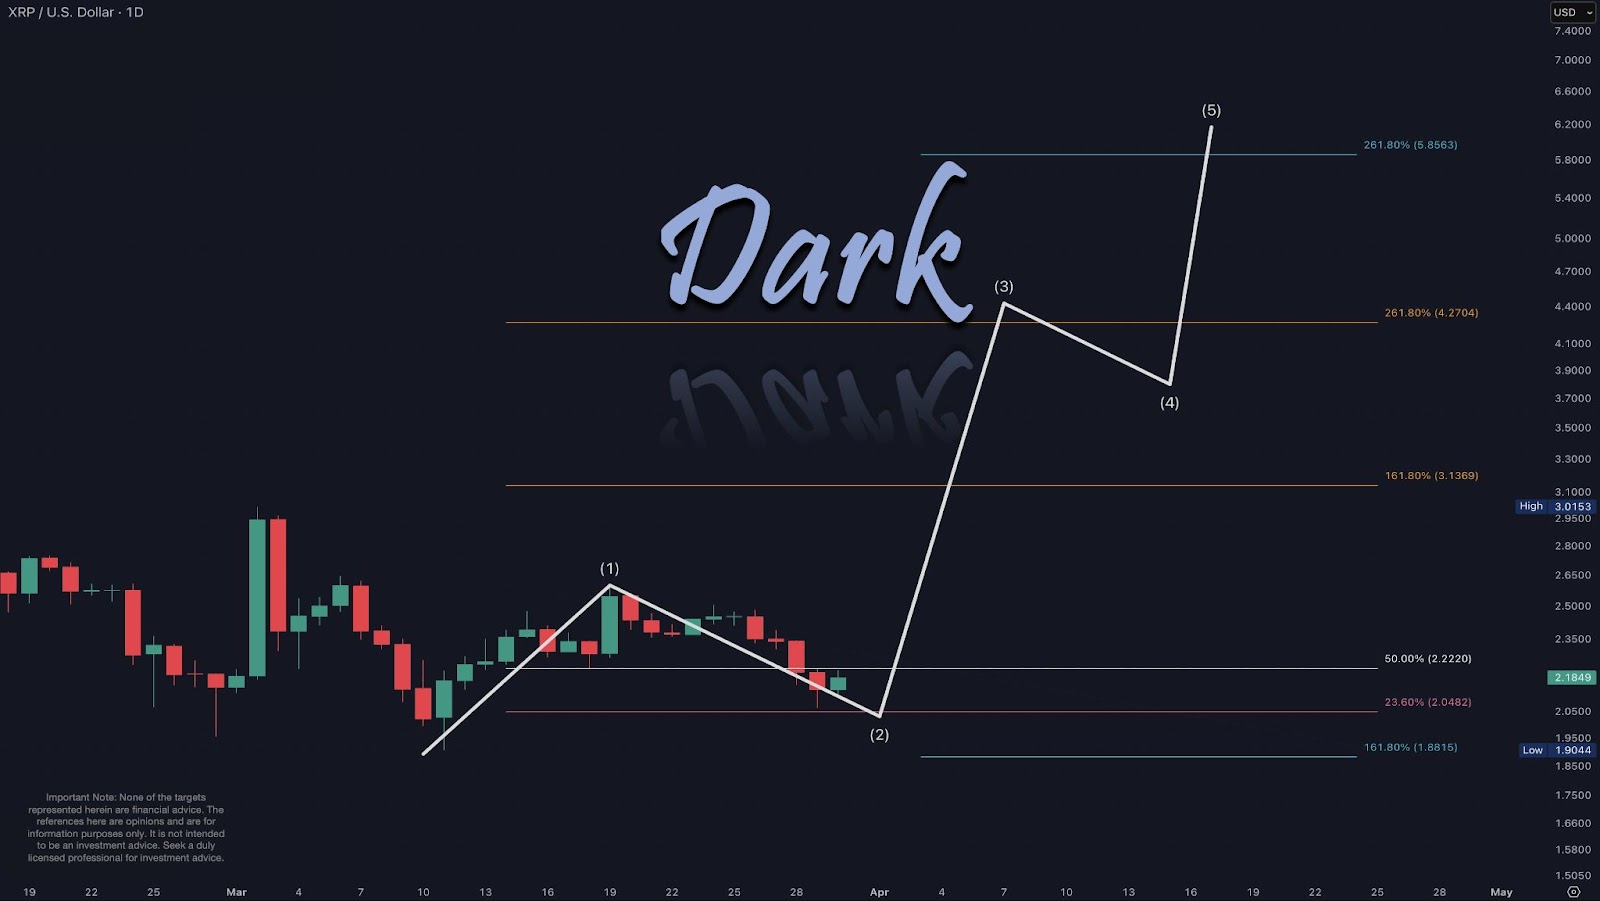
However, not everyone shares this bearish outlook. Analyst Dark Defender expressed a more positive perspective, suggesting that XRP’s price is likely to revisit the last Fibonacci level at $2.04 before bouncing back upward.
This analyst pointed out that a significant resistance level for XRP is at $2.22, which “must be broken” to facilitate a sustained recovery toward the Wave 5 target at $8.
“April and May are looking bright, and our Wave 5 targets are expected to be between $5 and $8.”

XRP/USD daily chart. Image source: Dark Defender
This article is not intended as investment advice or recommendations. Every investment and trading decision carries risk, and individuals should conduct their own research before making any financial commitments.
