- XRP is encountering a growing bearish sentiment driven by macroeconomic, microeconomic, and fundamental factors this April.
- Weak on-chain metrics, including network growth, total supply, and active addresses, suggest an impending downturn.
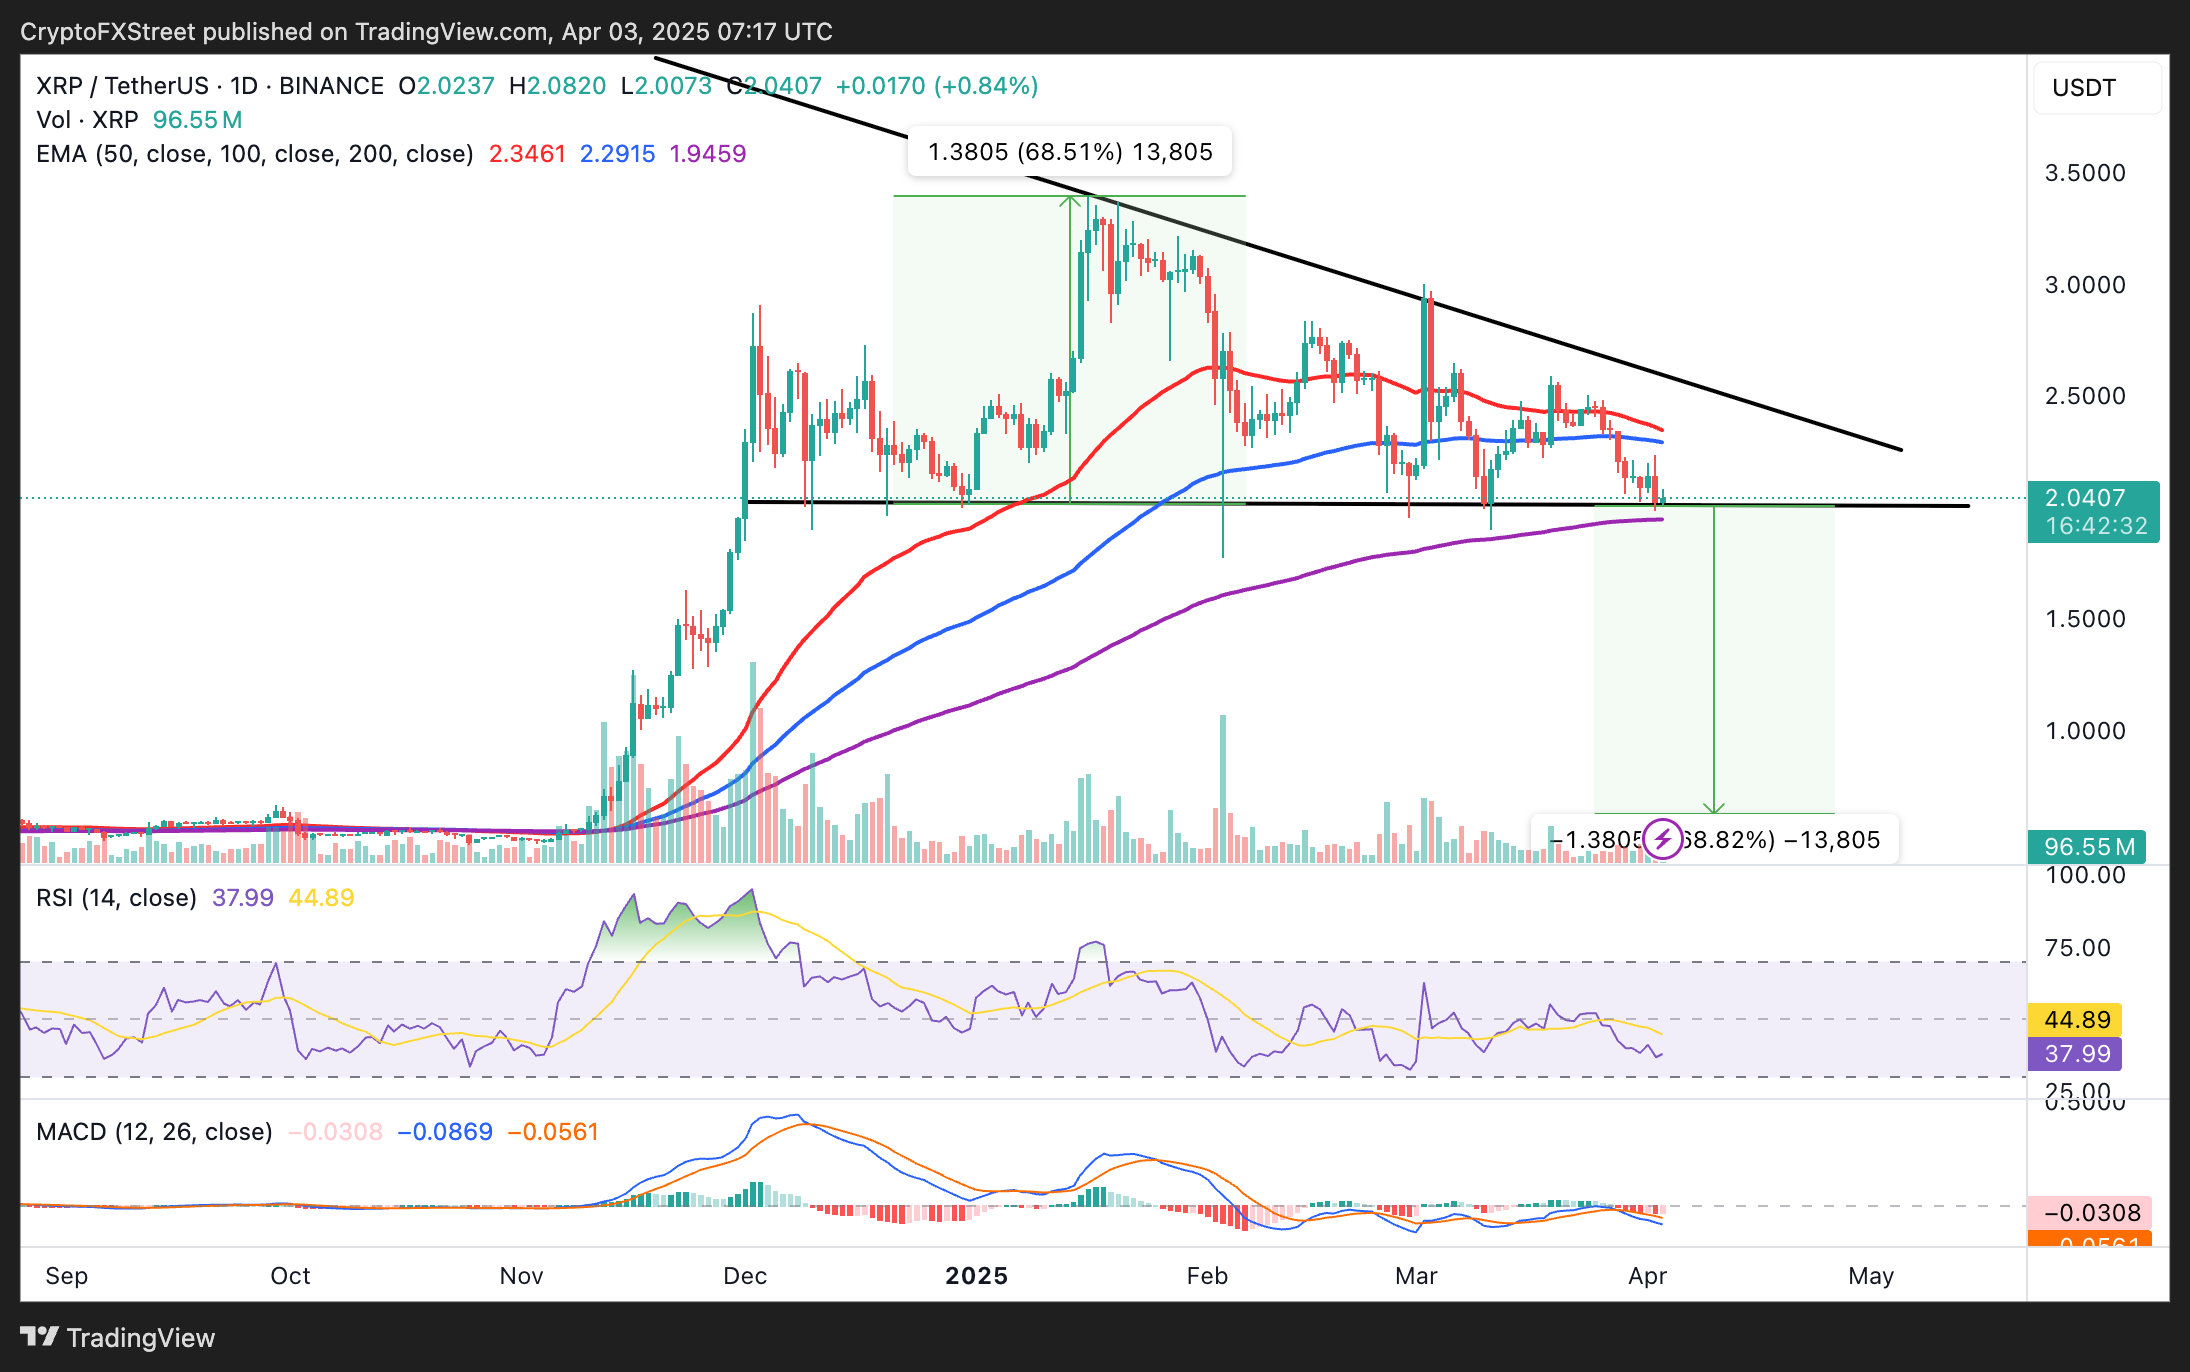
- A descending triangle formation highlights the $2 support level as global markets grapple with uncertainty from Donald Trump’s tariffs.
- XRP could potentially bounce back from the 200-day EMA, increasing the likelihood of achieving the mid-term target of $2.5.
XRP’s price has shown a slight recovery, trading close to $2.04 on Thursday after a 5.38% drop the day before, as market participants react to US President Donald Trump’s expansive tariffs. While the ‘Liberation Day’ tariffs seem mostly factored into current pricing, significant digital assets like Bitcoin (BTC), Ethereum (ETH), and XRP are struggling to maintain crucial support levels. Weak on-chain indicators coupled with rising global uncertainties could push XRP lower, potentially breaching the $2 support and even leading to a notable 68% decline to around $0.62.
Trump’s ‘Liberation Day’ tariffs lead to $19M in liquidations
On Thursday, XRP extended its correction by testing the $2 support level, resulting in $3.94 million in long and short liquidations within the last 24 hours, according to data from Coinglass. This total includes $2.94 million in liquidated long positions along with $993,000 in shorts.
XRP derivatives liquidation
Trump’s tariffs start at a baseline rate of 10% on all goods exported to the US, although specific countries such as China, India, and the European Union will pay a reduced rate.
“We will charge them about half of what they have been charging us, so the tariffs will not be fully reciprocal,” Trump stated on Wednesday. “I could have done that, but it would have been tough on many countries, and we opted not to take that route.”
In response, the cryptocurrency market saw a decline of 3%, dropping to a valuation of $2.77 trillion, with widespread declines across nearly all major assets. All of the top ten cryptocurrencies, apart from stablecoins USDT and USDC, are in the red.
XRP struggles with weak on-chain indicators
XRP’s rally in the fourth quarter of 2024 and the first quarter of 2025 exceeded 500%, reaching $3.4. This surge was fueled by various factors, including the lead-up to the US elections in November 2024 and the ensuing inauguration on January 20, 2025, which was expected to foster a more cryptocurrency-friendly environment. Additionally, the Securities and Exchange Commission (SEC) concluded its four-year lawsuit against Ripple in March.
Despite Trump’s efforts to restore confidence in regulatory bodies that have plagued the industry with prolonged legal disputes, the ongoing trade war initiated by the US continues to undermine these positive developments.
According to Santiment’s Network Growth metric, there is a notable downward trend, with figures dropping to 42 on Thursday from 514 addresses in February, as depicted in the accompanying chart. This trend indicates a growing negative sentiment surrounding the cross-border payments token. The Network Growth metric serves as an indicator of user adoption, measuring the number of new blockchain addresses joining the network.
 [10.31.49, 03 Apr, 2025]-638792743206611783.png)
Network growth metric
Furthermore, the count of active addresses has dropped from a high of 10,200 in January to the current 4,388 over the past 30 days. The sustained reduction in the number of addresses actively engaging in transactions on the network suggests a risk-averse market sentiment, contributing to the decline in XRP’s price.
 [10.31.33, 03 Apr, 2025]-638792743794705894.png)
Active addresses chart
The notable increase in the total XRP supply, according to on-chain data from Santiment, poses a significant concern, diminishing the likelihood of recovery. Ripple’s regular release of new tokens from its escrow account has raised eyebrows, with some labeling it as a form of dumping. As indicated in the chart, the rise in supply correlates with a decline in XRP’s value.
 [10.31.38, 03 Apr, 2025]-638792744280185044.png)
Total supply metric
XRP teeters on the edge of a 68% drop
As XRP tests the $2 support level amid ongoing sell-offs from traders looking to minimize their exposure to cryptocurrencies in light of the rising global trade uncertainties due to Trump’s tariffs, a descending triangle visible on the daily chart indicates a potential 68% decrease to $0.62 should the immediate support level fail.
Technical indicators like the Moving Average Convergence Divergence (MACD) and the Relative Strength Index (RSI) further showcase a solid bearish outlook for XRP. With the RSI sitting at 38, it is close to entering the oversold territory, while the bearish divergence in the MACD suggests traders may favor short positions over long ones.

XRP/USDT daily chart
Traders will need to monitor the 200-day support at $1.93, which could potentially counteract the downtrend and set XRP on a recovery trajectory. Key indicators for recovery include holding the $2 support, the RSI moving above 50, and the MACD producing a buy signal as histograms transition to green. XRP’s mid-term and long-term upside targets are set at $2.50 and $3.00, respectively.
