Bitcoin (BTC) is currently facing conditions reminiscent of the 2022 bear market bottom as businesses in the US confront significant risks ahead.
In a recent analysis, an expert in quantitative Bitcoin and digital asset investments pondered when the US might begin to print more money.
“Unanticipated” US tariffs weigh on Bitcoin
Bitcoin’s response was notably more negative compared to US stocks following the announcement of worldwide reciprocal trade tariffs on April 2.
On that day, BTC/USD dropped by as much as 8.5%, whereas the S&P 500 closed the trading session on Wall Street up by 0.7%.
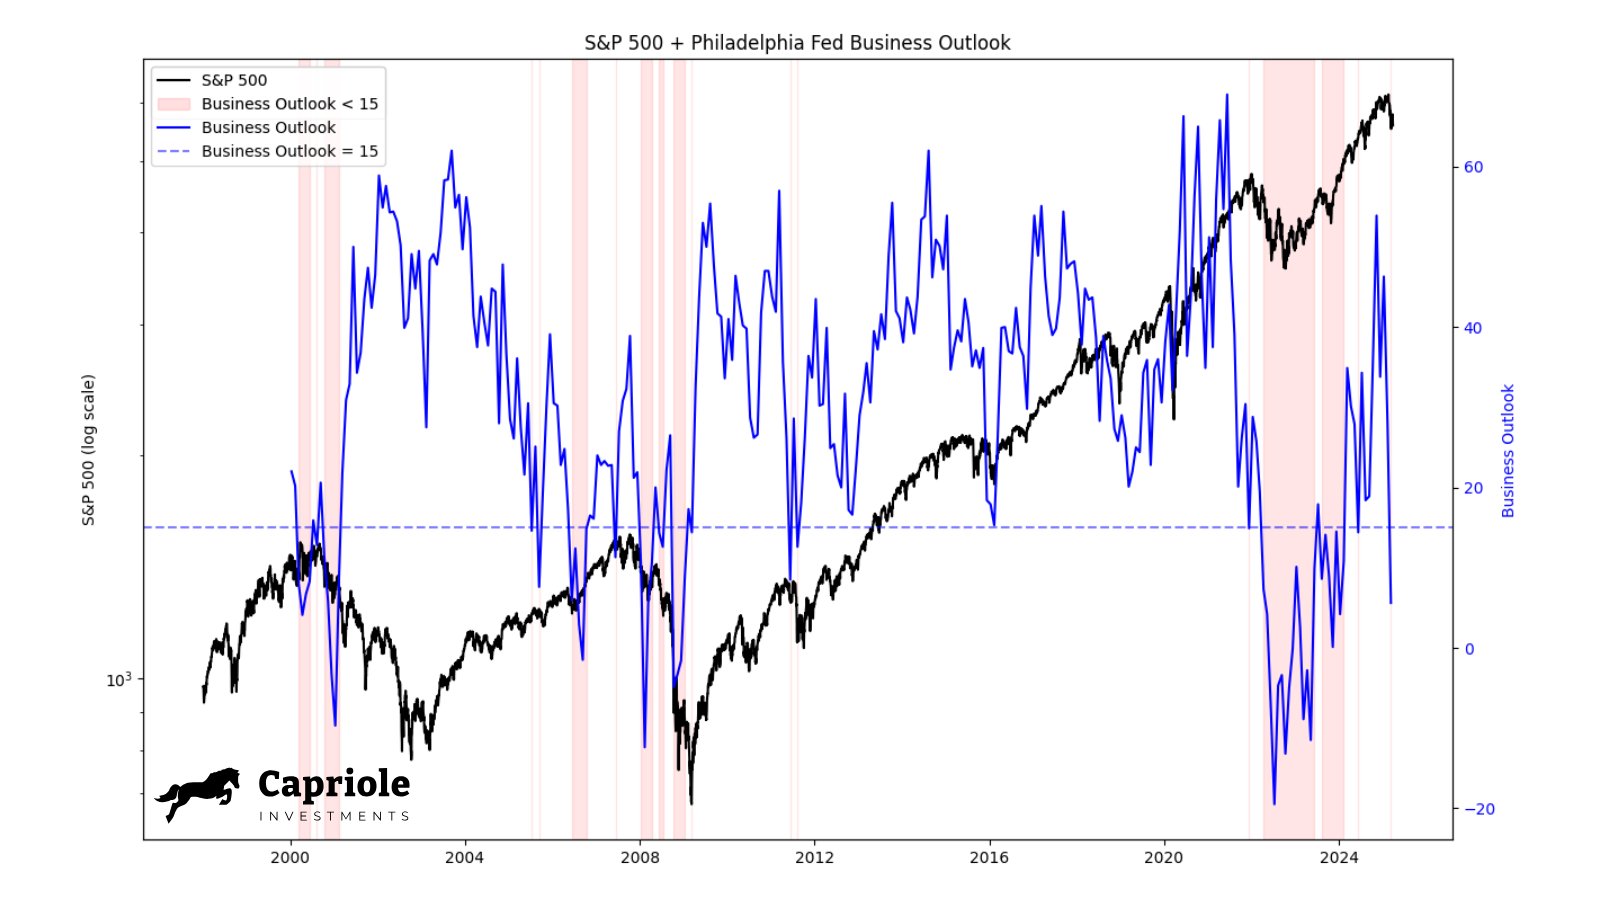
Despite this disparity, the analyst pointed out that the expectations among US businesses reflect a level of uncertainty that has only been matched three times since the year 2000.
“Take note as tariffs exceed expectations. The Philadelphia Fed Business Outlook survey is indicating levels today akin to 2000, 2008, and 2022,” he shared with followers.
An accompanying graph illustrated that the Philadelphia Fed’s Business Outlook Survey had fallen below 15 for the first time since early 2024. In late 2022, Bitcoin hit a low of $15,600 during its most recent bear market.

Philadelphia Fed Business Outlook Survey vs. S&P 500.
In a recent market update, the analyst acknowledged that while the Business Outlook Survey data may not always provide reliable indicators of market sentiment, it should not be dismissed.
“While this measure isn’t a sure indicator of future trends (it can give false signals), it is a reading we’ve seen before in very high-risk scenarios (2000, 2008, and 2022), prompting us to remain very vigilant,” he remarked.
“Especially if the tariff conflict escalates significantly beyond current expectations or if corporate margins begin to decline.”
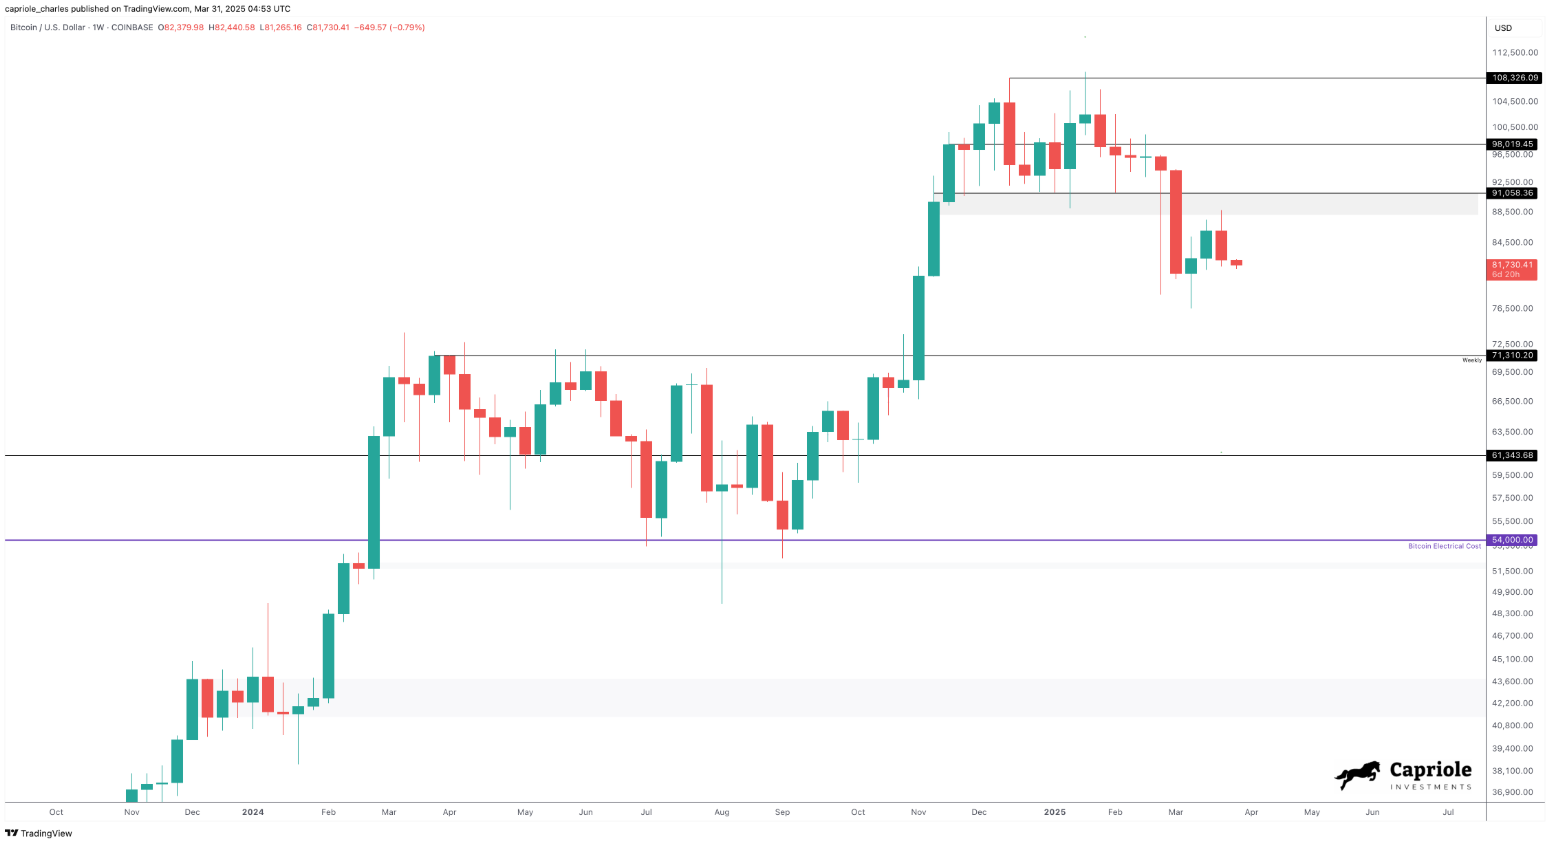
For Bitcoin, a crucial level to monitor in the aftermath of the tariffs is $91,000, with the suggestion that US macroeconomic developments will ultimately determine the technical trend going forward.
“All else being equal, a daily close above $91K would indicate a strong bullish reversal signal,” the update clarified alongside the weekly BTC/USD chart.
“If that doesn’t happen, a drop to the $71K range would likely see a significant rebound.”

BTC/USD 1-day chart (screenshot).
BTC price outlook centered on US liquidity trends
As noted elsewhere, a potential positive for crypto and risk assets could arise from an increase in global liquidity.
Related: Bitcoin sales at $109K all-time high ‘significantly below’ cycle peaks — Source
In the US, the Federal Reserve has started to loosen tight financial policies, with speculation about a return to quantitative easing (QE) varying among experts.
“How long will it be until monetary policy begins to ease?” the analyst inquired.
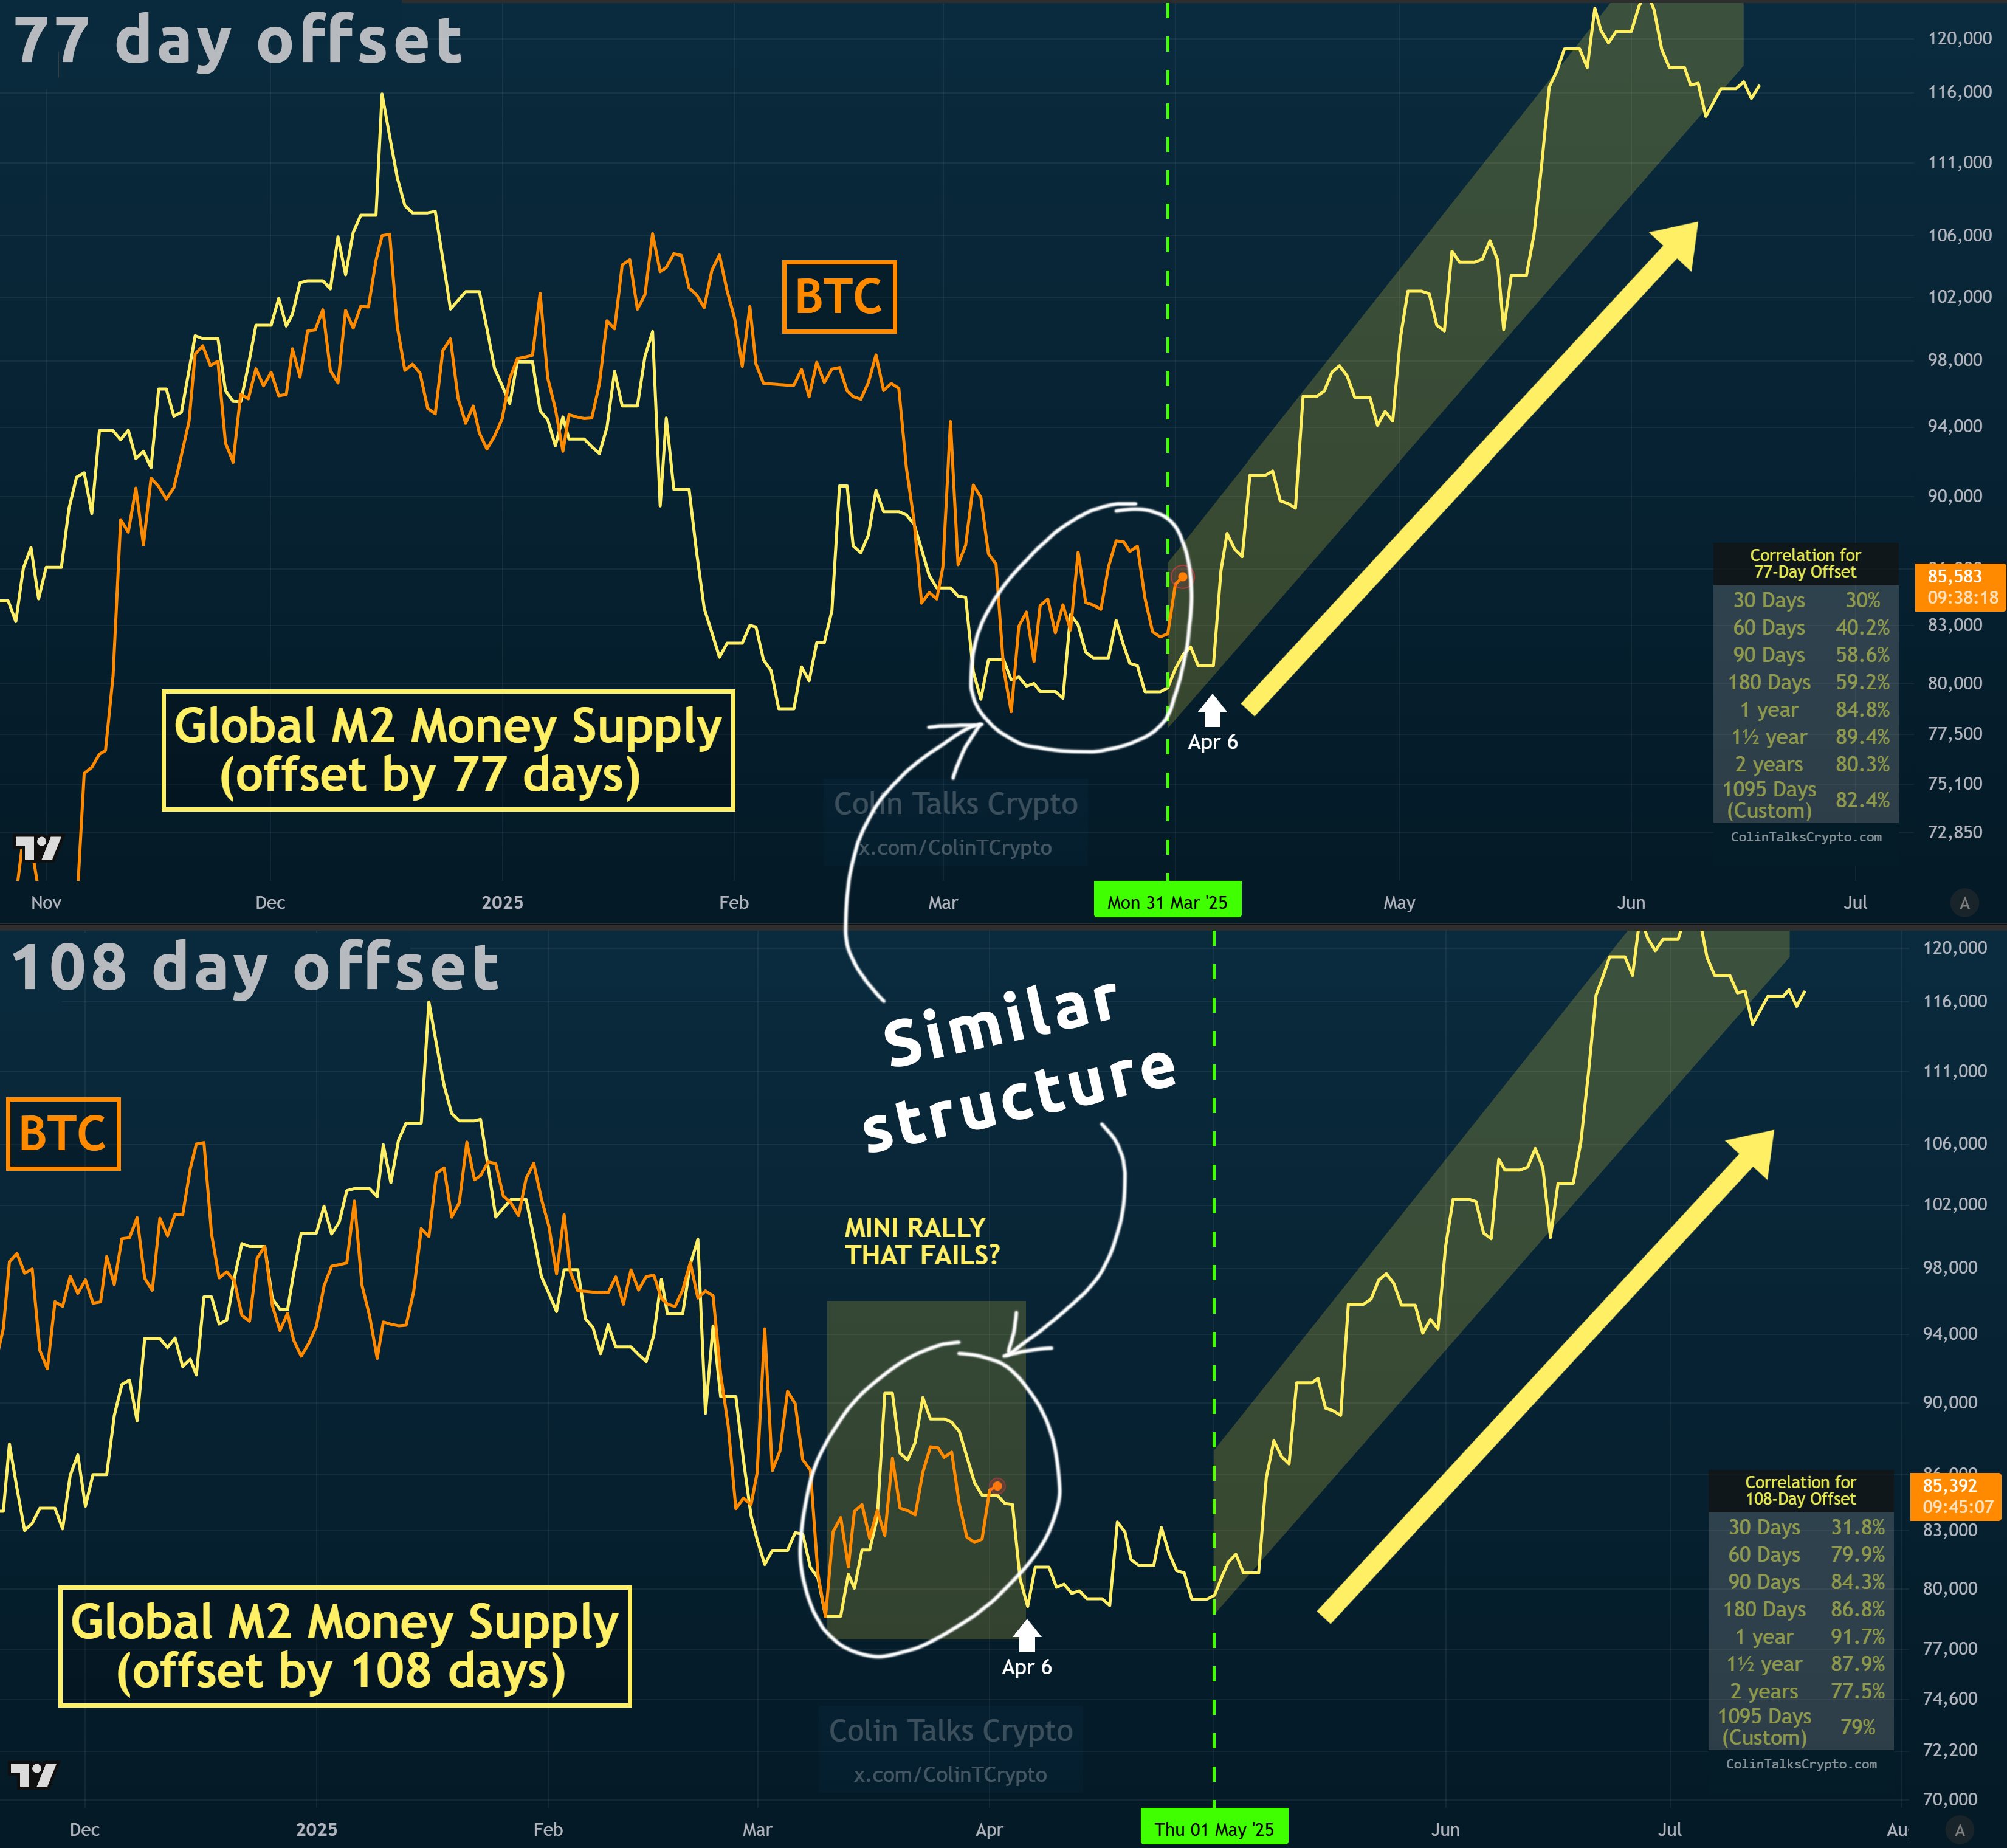
The M2 money supply is anticipated to experience an “influx” — a scenario that historically has led to significant upward movement in Bitcoin prices.
“The key takeaway (the most critical observation) is that a substantial M2 influx is on its way. The specific timing is less crucial,” another popular analyst speculated in a recent discussion.
A comparative chart hinted at a potential rebound for Bitcoin prices by early May.

US M2 money supply vs BTC/USD chart.
This content does not constitute investment advice or recommendations. Investing and trading involve risks, and individuals are encouraged to conduct their own research before making decisions.
