- On Thursday, Bitcoin’s price sits at approximately $83,000 after it couldn’t surpass the $85,000 resistance level the day prior.
- Market volatility, sparked by Trump’s tariffs, resulted in a $200 billion decrease in overall market capitalization, leading to the liquidation of over $178 million in BTC.
- Nonetheless, institutional investors capitalized on the price dips, as the US spot Bitcoin ETF witnessed $218 million in inflows.
As of Thursday, Bitcoin (BTC) is trading around $83,000 after failing to break through a significant resistance mark the previous day. The recent volatility in the cryptocurrency market has been exacerbated by US President Trump’s tariff announcement on Wednesday, which caused a substantial drop of $200 billion in total market capitalization and liquidated more than $178 million in BTC. Despite the fluctuations, institutional investors have seized the opportunity to purchase on dips, leading to a reported inflow of $218 million into US spot Bitcoin Exchange Traded Funds (ETFs).
Tariff announcement triggers BTC volatility
The tariffs were announced by President Trump on Wednesday, affecting 185 nations in one go during what he termed ‘Liberation Day’, marking the most severe tariffs in over a century.
The announcement originated from a report that detailed a 10% baseline tariff; however, markets interpreted it as an ‘ALL’ reciprocal tariff rate of 10%. This misinformation initially led to a surge in US equities, followed closely by a spike in the crypto market, with Bitcoin reaching highs of $88,500. However, everything reversed sharply at 4:26 PM ET when President Trump presented the tariff poster at his announcement event.
“Prior to him showcasing the poster, futures were up by 2%. By 4:42 PM ET, they had plummeted by 4% from their peak as Trump began to list specific tariffs,” states a report.
S&P 500 E-mini futures chart
The tariffs were based on half of what other countries are currently charging the US. For context, China currently imposes a 67% tariff, suggesting a forthcoming 34% tariff for China and 20% for the European Union, which clearly exceeds the proposed 10%.
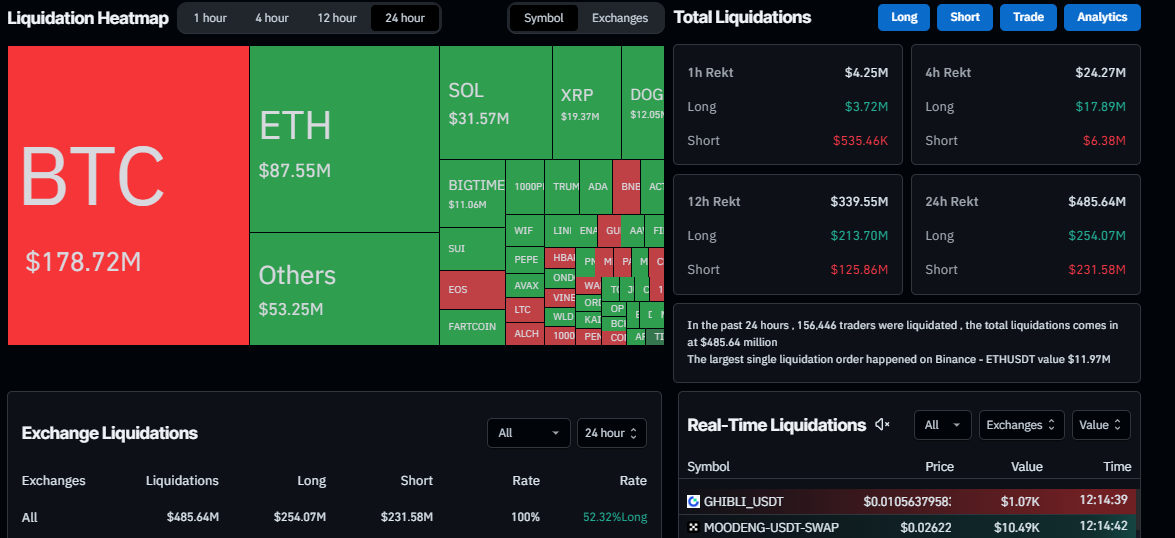
This announcement triggered volatility within the crypto market, causing BTC to drop from its peak of $88,500 to a low of $82,320 on Wednesday, wiping out $200 billion from the entire crypto market cap and leading to a liquidation of $178.72 million in BTC, as illustrated in the graph below.

Liquidation chart
Institutional investors capitalize on Bitcoin dips
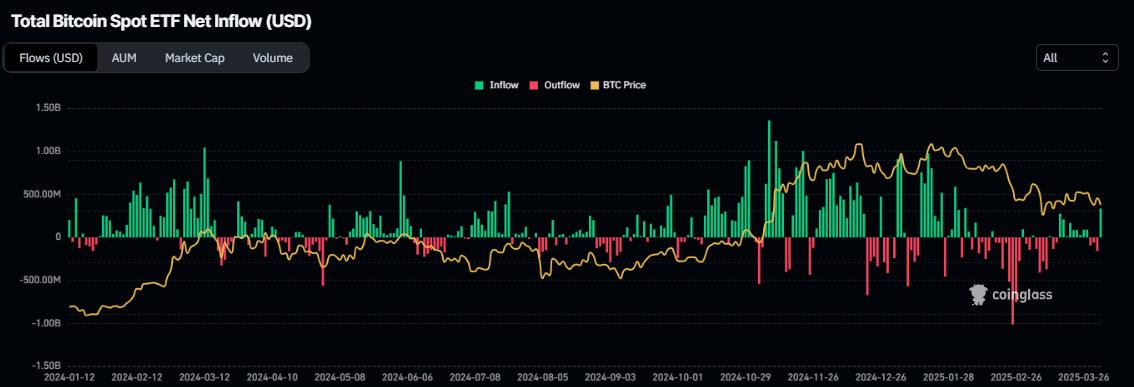
Data from Coinglass indicates that Bitcoin spot ETF inflows reached $218.10 million on Wednesday, ending a prolonged trend of outflows since the previous Friday. This influx indicates institutional investors have taken advantage of the recent price dip. If this trend of inflow persists and intensifies, Bitcoin’s price may experience a recovery in the near future.


Total Bitcoin Spot ETF net inflow chart
Bitcoin Price Forecast: BTC shows signs of weakness as it struggles to surpass $85,000
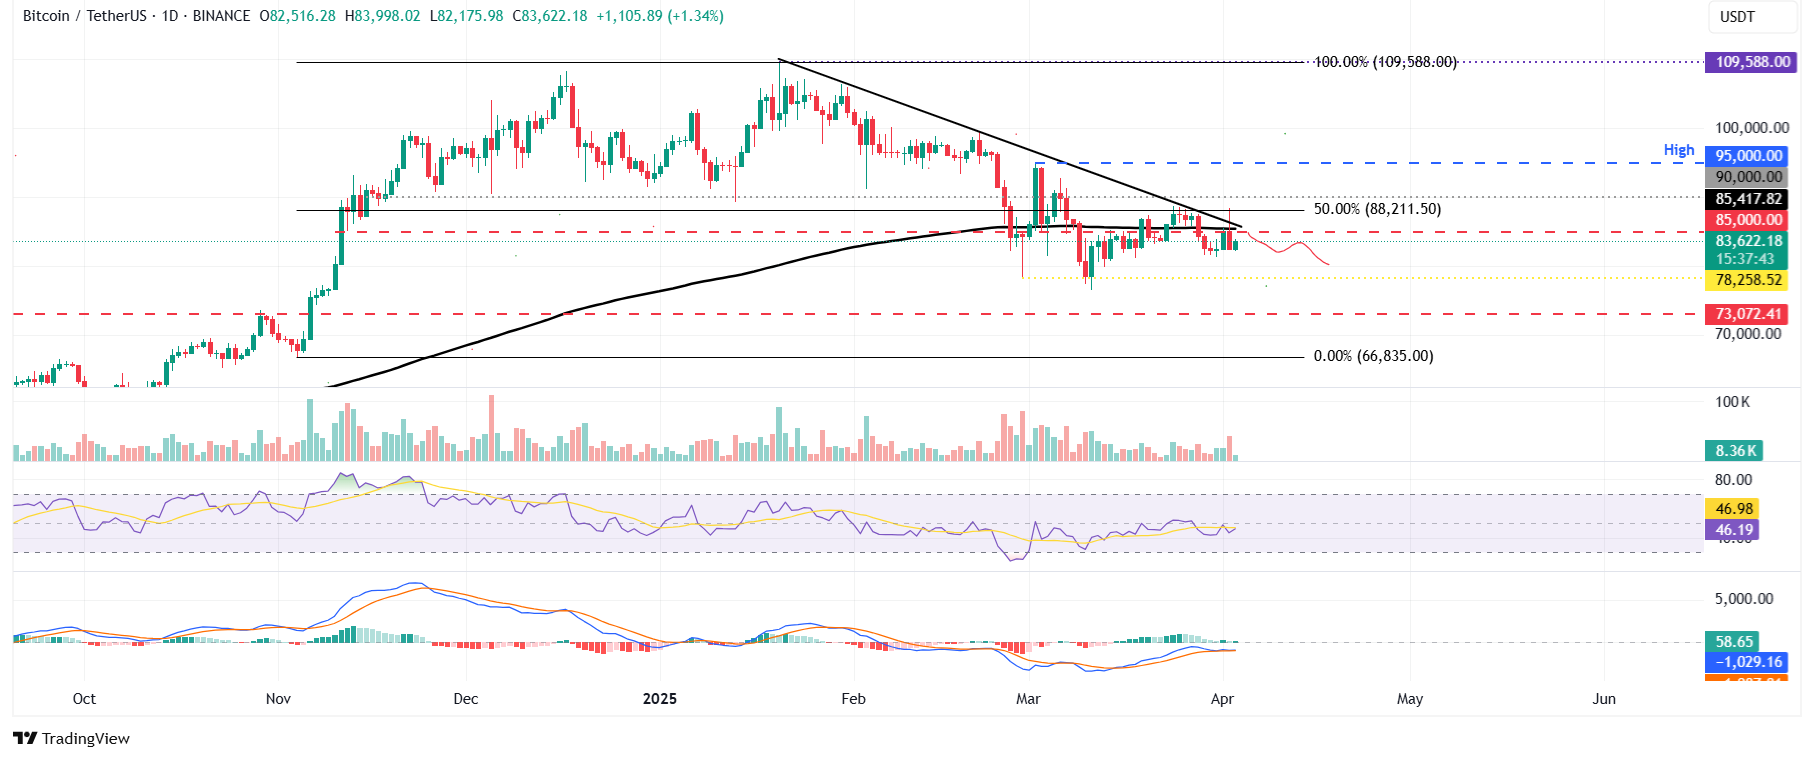
Bitcoin faced rejection at the 50% Fibonacci retracement level (drawn from its November low of $66,835 to its all-time high of $109,588 in January) at $88,211, recording a 3.10% decline on Wednesday. Furthermore, BTC was unable to close above its daily resistance of $85,000. This key level aligns closely with the 200-day Exponential Moving Average (EMA) and a descending trendline, marking it as a critical resistance area. As of Thursday, BTC is showing slight recovery, lingering around $83,000.
The Relative Strength Index (RSI) on the daily chart currently sits at 46 after a rejection from its neutral mark of 50 on Tuesday, suggesting a slight bearish momentum. Should the RSI continue to decline, it may exacerbate the bearish pressure, leading to a more significant drop in BTC prices.
The Moving Average Convergence Divergence (MACD) lines are showing a convergence, reflecting uncertainty among traders.
If BTC continues to experience resistance at the daily $85,000 level, it could further decline and test the next support level at $78,258.

BTC/USDT daily chart
Conversely, if BTC manages to recover and close above the daily resistance of $85,000, it may see the continuation of its recovery rally towards the crucial psychological level of $90,000.
Bitcoin, altcoins, stablecoins FAQs
Bitcoin is the leading cryptocurrency by market capitalization, designed to function as a form of money. This digital currency is not controlled by any single individual, group, or organization, which eliminates the necessity for third-party involvement in financial transactions.
Altcoins refer to any cryptocurrency besides Bitcoin; however, some consider Ethereum not to be an altcoin since forking typically occurs between these two currencies. If this holds true, Litecoin would be the first altcoin, originating from the Bitcoin protocol and being seen as an “enhanced” version of it.
Stablecoins are cryptocurrencies aimed at maintaining a stable value, with their worth backed by a reserve of the asset they represent. To achieve this, the value of a stablecoin is pegged to a commodity or financial instrument, like the US Dollar (USD), with its supply regulated by algorithms or market demand. The primary intent of stablecoins is to offer a smooth entry and exit for investors involved with cryptocurrencies, enabling value storage amidst the general volatility of digital assets.
Bitcoin dominance indicates the proportion of Bitcoin’s market capitalization in relation to the total cryptocurrency market. It provides insight into Bitcoin’s attractiveness to investors. High dominance generally precedes and occurs during bull runs, where investors gravitate toward stable and high-cap assets like Bitcoin. Conversely, a decline in dominance often signifies a shift of investor capital and profits into altcoins, leading to explosive rallies in those assets.
