XRP (XRP) has found stability around the $2 support level following a widespread market sell-off that brought this altcoin, along with various other cryptocurrencies, close to their recent lows.
Current data indicates that the XRP/USD pair is showing initial signs of a potential bullish breakout.
Ripple’s RLUSD Integration May Enhance XRP’s Value
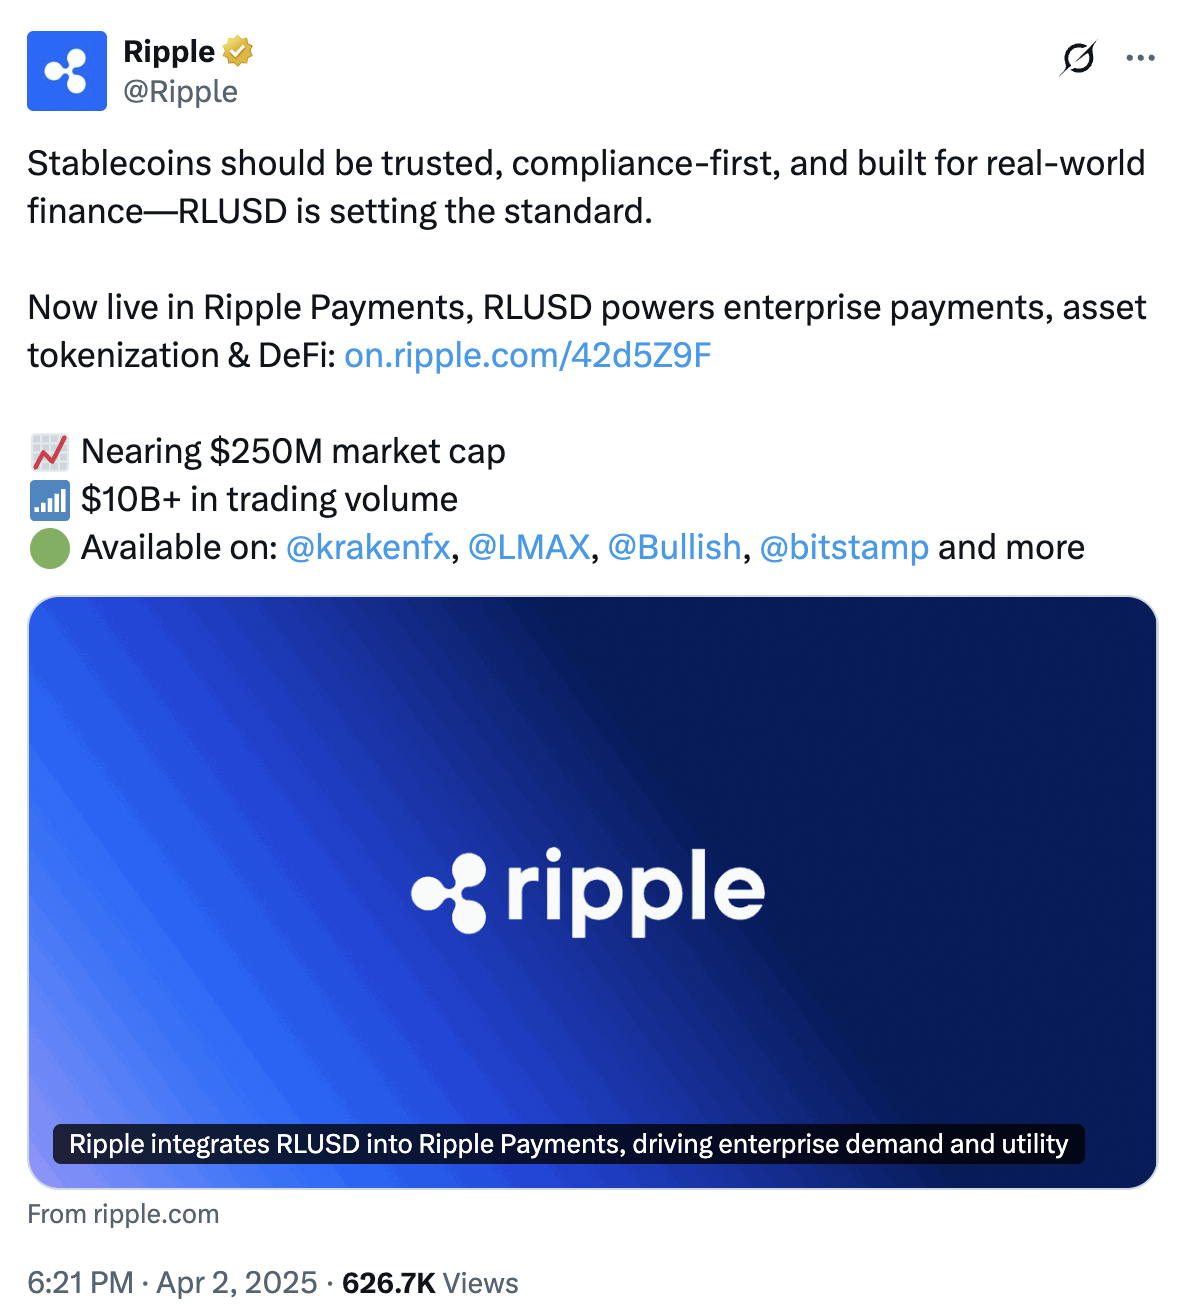
The integration of Ripple’s RLUSD stablecoin into its cross-border payments platform, Ripple Payments, may provide a significant boost to XRP’s value by improving its utility and liquidity.
On April 2, the company behind XRP announced that it had incorporated its stablecoin into the cross-border payments system to increase adoption for Ripple USD (RLUSD).
RLUSD, which is pegged to the US dollar and launched in December 2024, works in tandem with XRP to offer transactional stability, while XRP acts as a rapid, liquid bridge currency. This combined strategy is aimed at capturing the $230 billion cross-border payments market, thereby enhancing demand for both digital assets.

Image Source: X / Ripple
Currently, RLUSD boasts a market cap of $244 million, experiencing a remarkable 87% increase in March alone, according to available data. As adoption accelerates, financial institutions utilizing Ripple Payments may increasingly turn to XRP for liquidity, particularly in volatile trading environments.
By pairing RLUSD with XRP on the XRP Ledger (XRPL) and various exchanges, trading volume and activity on XRPL’s decentralized exchange could increase, tightening the supply of XRP.
The positive sentiment stemming from RLUSD’s success could also elevate XRP’s price, with analysts suggesting that greater adoption could see XRP rise to $3.50 or more.
“Ripple’s RLUSD integration is a groundbreaking step for cross-border payments,” stated a crypto market insights provider in a recent post.
This has led to “optimism surrounding RLUSD growing, with implications for XRP,” the provider remarked, adding:
“Overall: A strategic move for enhancing Ripple’s ecosystem and advancing stablecoin adoption. Prepare for possible changes!”
Related: How many US dollars does XRP transfer per day?
XRP Pattern Indicates $3.51 Target
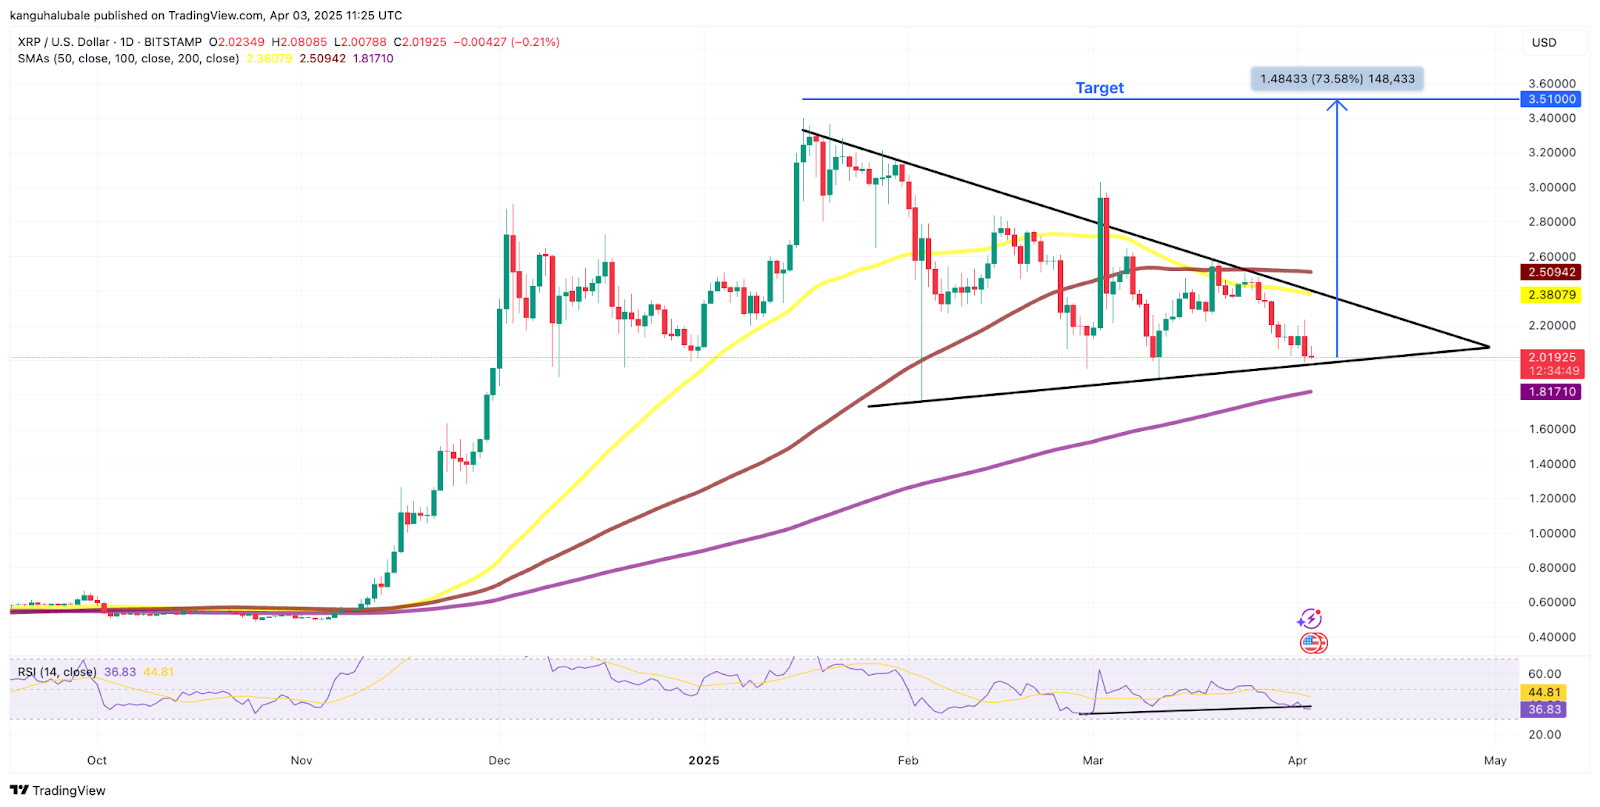
The price movements of XRP from January 16 to April 3 have formed a symmetrical triangle on the daily chart, with the price currently retesting the lower trendline of the triangle at $1.98, suggesting a potential rebound.
It’s worth noting that the price has previously rebounded from this trendline two to three times, with each retest resulting in substantial price recovery.
If history repeats itself, XRP could recover from its current position, and if trading volumes are favorable, it might break above the triangle’s descending trendline at $2.40, which aligns with the 50-day SMA.
This target is defined by the distance between the triangle’s highest and lowest points, suggesting a potential XRP price of $3.51, representing a roughly 73% increase from current levels.

XRP/USD daily chart. Source: TradingView
Several analysts share a similar optimistic view on the altcoin, citing XRP’s increasing adoption, favorable chart patterns, and the recent resolution of Ripple’s lengthy legal dispute with the SEC as contributing factors.
Referring to a chart similar to the one above, an XRP investor suggested that the price is “heavily compressing,” indicating an imminent breakout.
“This breakout will create numerous new millionaires!”
Utilizing Elliott Wave theory, a crypto analyst has expressed a positive price forecast for XRP, stating that the token’s recent correction phase will conclude within weeks, with targets ranging between $5 and $18 in the medium to long term.
When XRP reached $3.3999, we established a 5 Elliott Wave structure, concluding that XRP had finalized the Monthly 3rd Wave and initiated correction, Wave 4.
We accurately set the Wave 4 dip at $2.02.
B is currently in action; we also have precise levels for B Wave.
While everyone… link
— Crypto Analyst (@DefendDark) April 2, 2025
According to market analysis, XRP’s relative strength index suggests a bullish divergence across multiple timeframes, indicating a potential price bottom, with an upside target of $3.80.
This article does not consist of investment advice or recommendations. Every investment and trading action carries risks, and readers should perform their own research prior to making financial decisions.
