- Bitcoin remains under pressure, trading around $82,000 on Friday after missing out on a crucial resistance breakout earlier this week.
- Donald Trump’s announcement regarding tariffs on Wednesday led to a loss of $200 billion in total cryptocurrency market capitalization and ignited a series of liquidations.
- US Bitcoin spot ETFs experienced a total net outflow of $107.81 million as of Thursday.
The price of Bitcoin (BTC) continues to face selling pressure, hovering around $84,000 at the moment, following a rejection at a significant resistance level earlier this week. Market volatility increased after President Donald Trump’s tariff announcement on Wednesday, which resulted in a $200 billion decrease in overall market capitalization and triggered a wave of liquidations. The US Bitcoin Spot Exchange Traded Funds (ETFs) recorded an outflow of $107.81 million until Thursday, reflecting a dip in institutional interest.
Tariff announcement causes market instability, wiping $200 billion from cryptocurrency
Bitcoin endured a tumultuous trading period as President Trump declared tariffs on 185 nations on what he termed “Liberation Day” on Wednesday.
The announcement originated from a report indicating that the US would implement a 10% baseline tariff. While this was accurate, the market misinterpreted it to mean that all reciprocal tariffs would also be 10%. Consequently, the US stock market surged, followed by the crypto market where BTC peaked at $88,500 on Wednesday. However, a sharp decline took place at 4:26 PM ET when Trump showcased the tariff poster during his announcement.
“Prior to him revealing that poster, futures had increased by +2%. By 4:42 PM ET, they had plummeted -4% from their earlier peak as Trump enumerated new tariffs,” states an analyst.
The tariffs were calculated to be half of what foreign nations currently charge the US, with China, for example, imposing a 67% tariff. This implies a forthcoming 34% tariff for China and 20% for the European Union, which notably exceeds the suggested 10%.
This development contributed to volatility in the cryptocurrency market, causing Bitcoin to drop from its high of $88,500 to a low of $82,320 on Wednesday, erasing $200 billion from the overall crypto market and resulting in liquidations of $178.72 million on BTC, as depicted in the accompanying graph.
Total Liquidation chart.
According to a weekly analysis, anticipated turbulence in the market was evident due to Trump’s tariff declaration. Investors rushed to move Bitcoin to exchanges, with a single transaction reflecting as much as 2,500 BTC. Notably, Coinbase reported a significant increase in Bitcoin deposits from large holders in the US, shown in the subsequent graph.
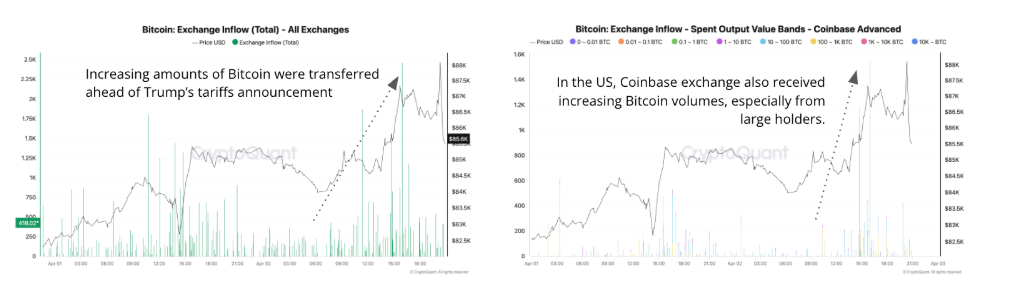
Bitcoin Exchange Inflow all exchanges (Left chart). Bitcoin Exchange Inflow coinbase advance (Right chart).
The analysis further suggests that the total open interest in Bitcoin decreased from 334,000 to 304,000 BTC, indicating the closure of long positions as tariffs were announced. A decline in open interest alongside a price drop generally indicates that traders are exiting long positions, possibly anticipating further declines or due to liquidations.
The current Bull Score Index stands at 20, the lowest level recorded in some time, suggesting a lack of confidence in the investment environment and reducing the chances of a sustained upward trend in the near future. Should the score remain below 40 for an extended duration, it could indicate continued bearish conditions reminiscent of prior downturn phases.
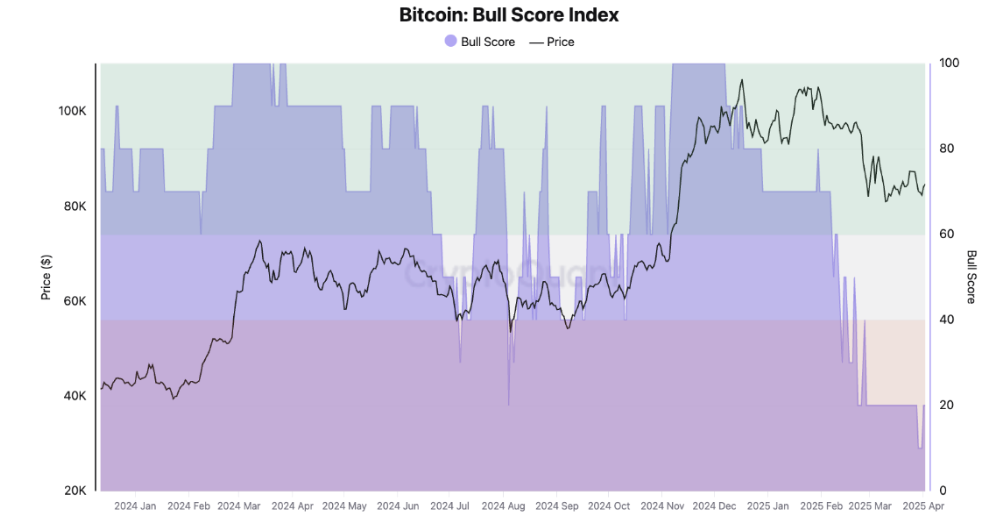
Bitcoin Bull score index.
Weakness in institutional demand
Recent uncertainties in the market have led to a decline in institutional demand this week. Data indicates that the US spot Bitcoin ETF experienced a net outflow of $107.81 million by Thursday. Moreover, figures reveal that the weekly netflow has been diminishing since mid-February, one month following Trump’s inauguration. Should this trend of outflow persist and escalate, Bitcoin’s price may face further corrections.
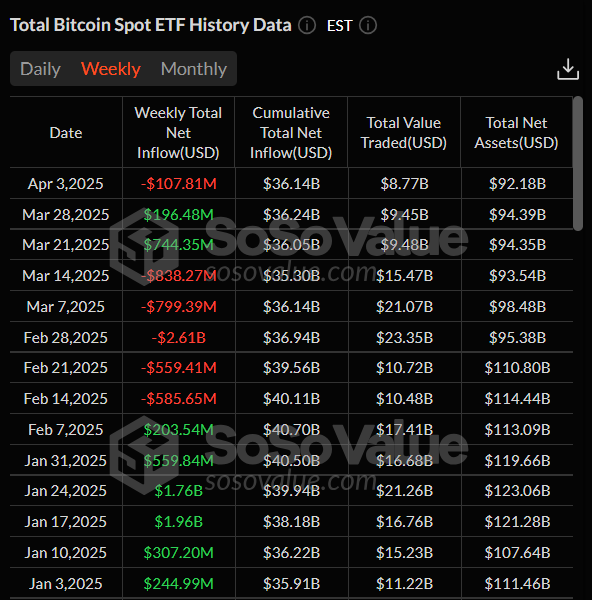
Total Bitcoin Sport ETF weekly chart.
Despite the downturn in institutional demand, public companies are increasingly transforming their balance sheets to include Bitcoin reserves.
As highlighted previously, Gamestop (GME) has raised $1.5 billion in capital and may allocate a portion of these funds towards enhancing its Bitcoin treasury. Metaplanet (MTPLF) added 160 BTC to its holdings on Tuesday, raising their total to 4,206 BTC. Meanwhile, Bitcoin mining firm MARA Holdings (MARA) is planning a $2 billion stock offering to acquire more Bitcoin, indicating a rising institutional interest in crypto assets.
This trend is generally seen as positive for Bitcoin’s price due to increased demand and diminished circulating supply, fostering positive market sentiment. If this momentum continues, Bitcoin could experience more consistent growth over the long term, although short-term fluctuations are expected as the market adjusts to this new institutional engagement.
Market anticipates US agencies’ Strategic Bitcoin Reserve report
A recent analysis titled ‘The Forgotten Reserve’ notes that amid the focus on tariffs, federal agencies are due to release reports by Saturday concerning their authority to transfer digital assets to the Strategic Bitcoin Reserve (SBR). This will provide clearer insight into the initial composition and value of the reserve.
“We anticipate that the Bitfinex funds (94,636 BTC) will be moved to the exchange after this deadline,” states an analyst.
The analyst adds, “Following such a transfer, volatility may arise, particularly since discussion continues around the total US Government BTC holdings of approximately 200,000 BTC in connection to the SBR.” It’s expected thatBTC will remain in a consolidation phase, oscillating between the $75,000 to $88,000 range.
Is BTC facing a recovery?
Bitcoin faced resistance at the 50% Fibonacci retracement level (drawn from its November low of $66,835 to its January high of $109,588) at $88,211 and saw a 3.10% decrease on Wednesday. Additionally, BTC was unable to close above the daily resistance level of $85,000, which aligns with the 200-day Exponential Moving Average (EMA) and a declining trendline, rendering it a crucial resistance area. The price stabilized around $83,000 the following day and remains slightly below $82,000 as of Friday.
The Relative Strength Index (RSI) on the daily chart is currently at 44, having been rejected from its neutral level of 50 on Tuesday, indicating a mild bearish momentum. If the RSI continues to decline, stronger bearish momentum could lead to a significant decrease in Bitcoin’s price.
The Moving Average Convergence Divergence (MACD) lines are converging, reflecting uncertainty among traders.
If Bitcoin continues to encounter resistance at the daily level of $85,000, it may decline further, retesting its next support zone at $78,258.
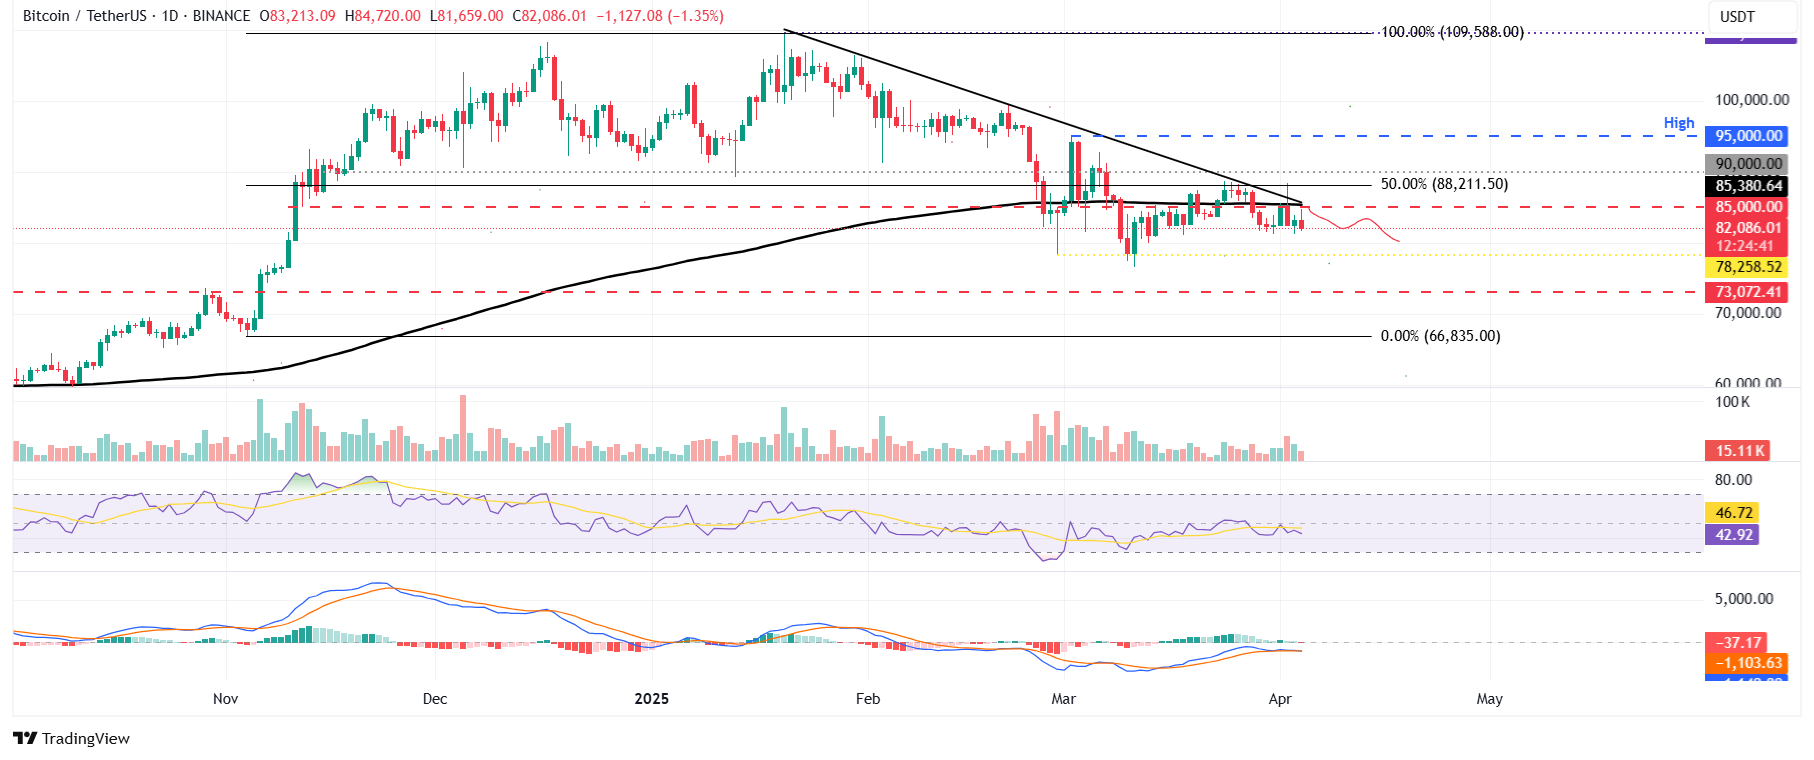
BTC/USDT daily chart
On the other hand, if Bitcoin rebounds and manages to close above its daily resistance at $85,000, it could pave the way for a recovery rally towards the pivotal psychological level of $90,000.