The price of XRP has dropped over 35% from its multi-year peak of $3.40 in January, and as new bearish indicators emerge, this downward trend could intensify in April.
Let’s take a closer look at the factors driving this shift.
XRP Approaching a Traditional Technical Breakdown
Recently, XRP’s price movements have indicated a classic bearish reversal pattern known as the “inverse cup and handle formation.”
This inverse cup and handle is a bearish chart formation suggesting diminishing buyer momentum following an upward trend. Visually, it resembles an upside-down teacup, with the “cup” representing a rounded descent and the “handle” appearing after a short period of consolidation.
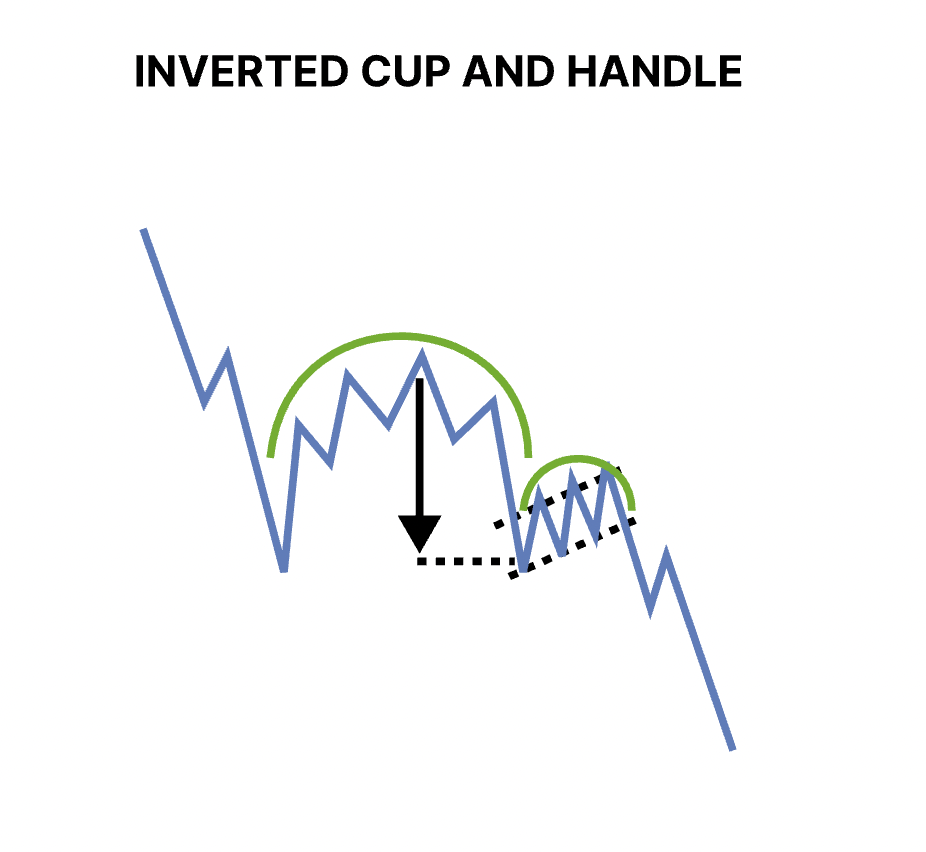
Illustration of an inverse cup-and-handle pattern.
A dip below the support level of the handle typically confirms this pattern, potentially leading to a drop equivalent to the height of the cup.
In the case of XRP, the rounded “cup” reached its peak around March 19 and completed its decline by the end of the month. The current sideways movement between $2.05 and $2.20 constitutes the “handle.”
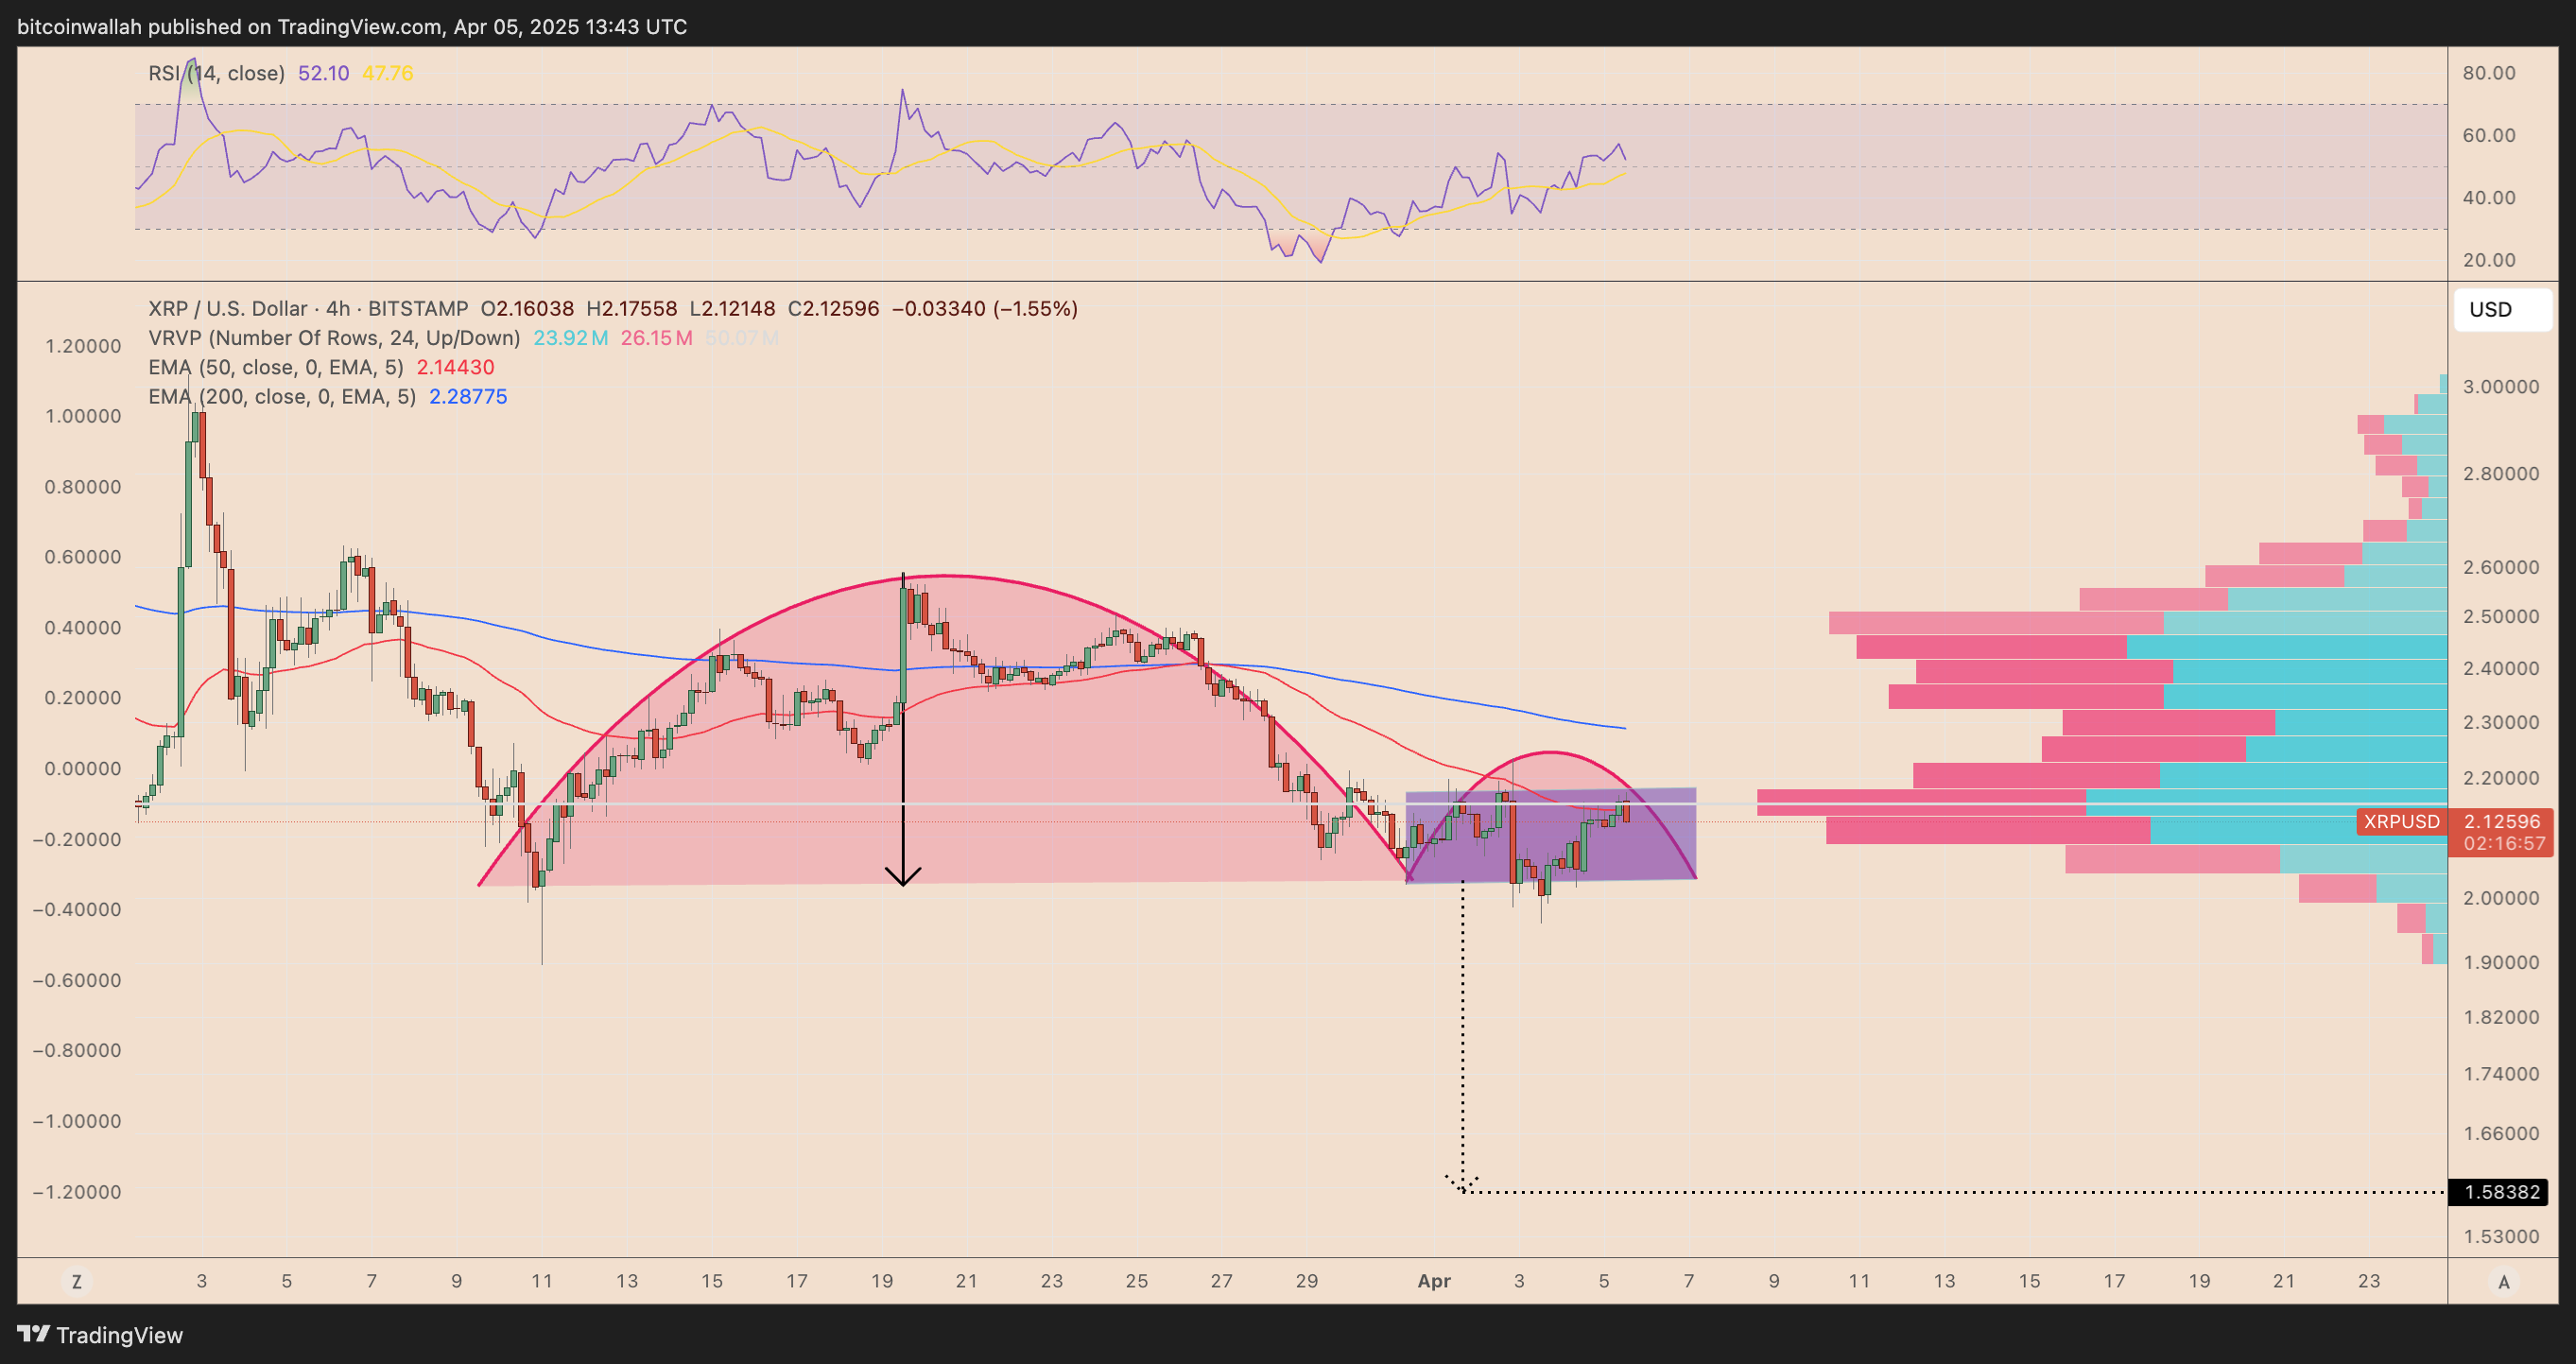
XRP/USD four-hour price chart.
A breach of this horizontal range could validate the bearish setup, potentially leading to a move toward the support level at $1.58, as indicated by the chart’s projection.
In other words, XRP could experience a decline of more than 25% in April if the inverse cup and handle unfolds as anticipated.
Chart illustrating potential price movement.
Compounding the risk of further selling is data from the volume profile visible range indicator, which highlights a point of control around $2.10–$2.20, a critical support zone. A breakdown below this high-volume area could lead to a more significant price drop, as historical support has been limited at lower volume levels.
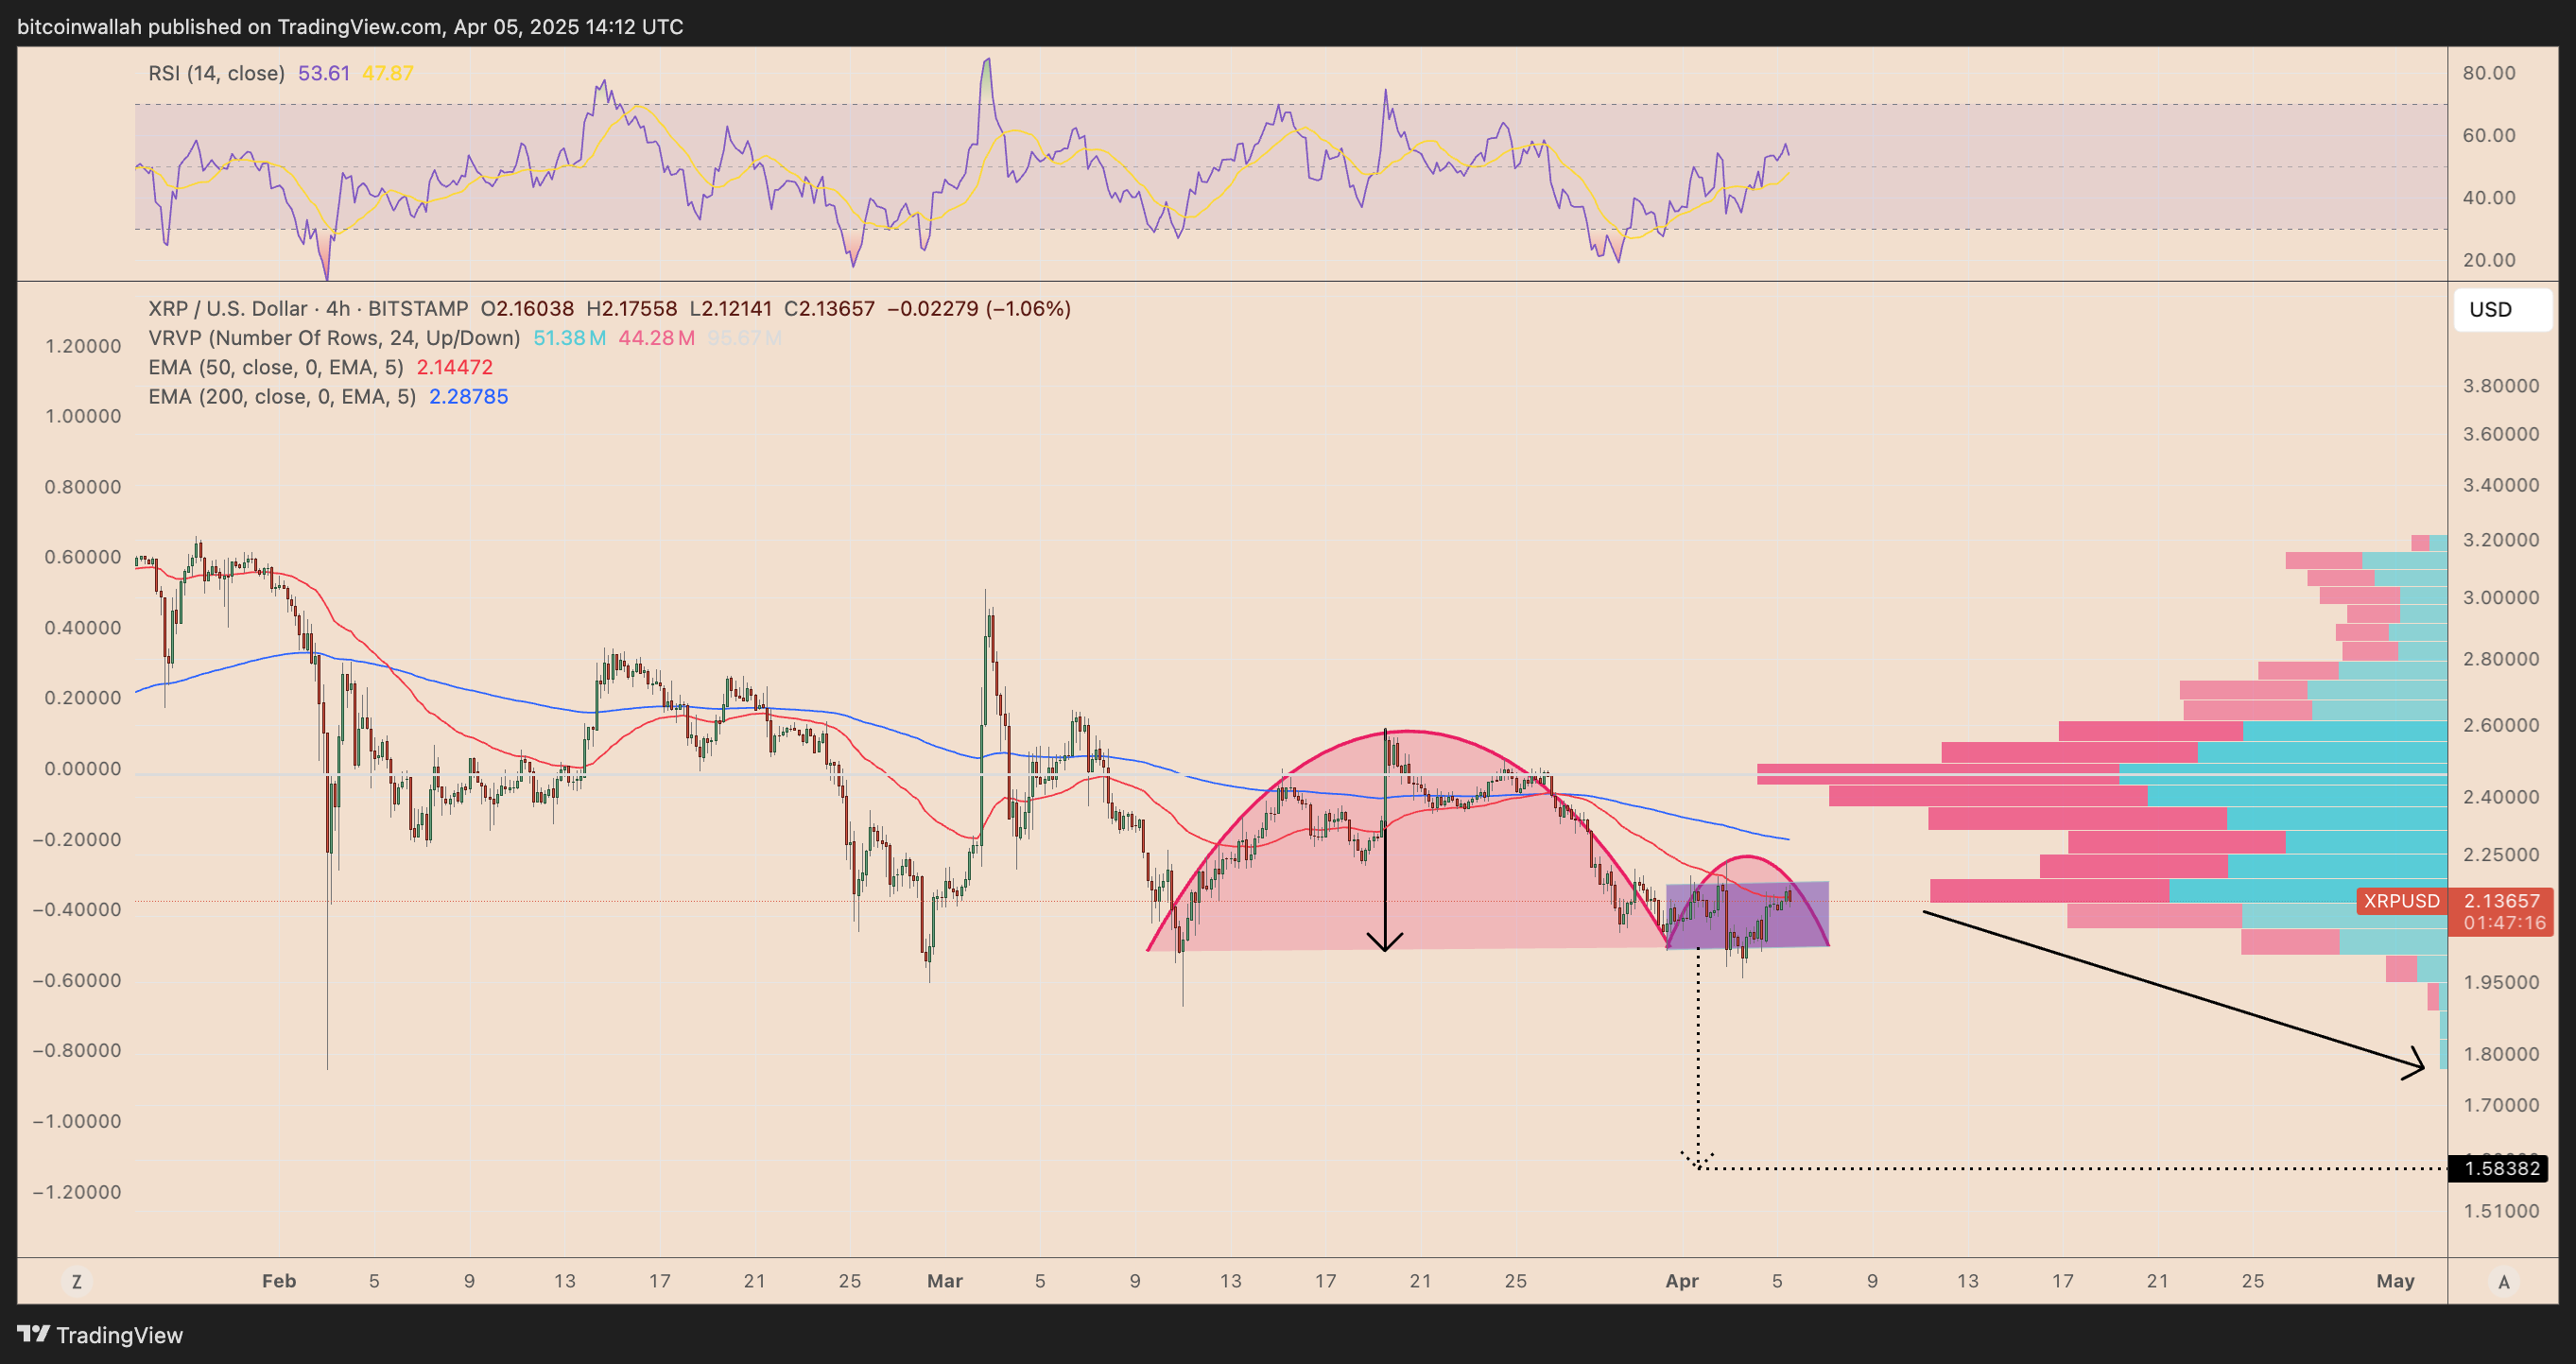
XRP/USD four-hour price chart.
On the other hand, a strong close above the 50-period four-hour EMA (red line) near $2.14 could nullify the inverse cup and handle pattern. Such a breakout might shift momentum in favor of buyers, paving the way for a potential rally towards the 200-period four-hour EMA (blue line) around $2.28.
XRP Whale Activity Indicates Increased Sell Pressure
As of April 5, the 90-day moving average whale flow chart has shown persistent net outflows from XRP’s largest holders since late 2024.
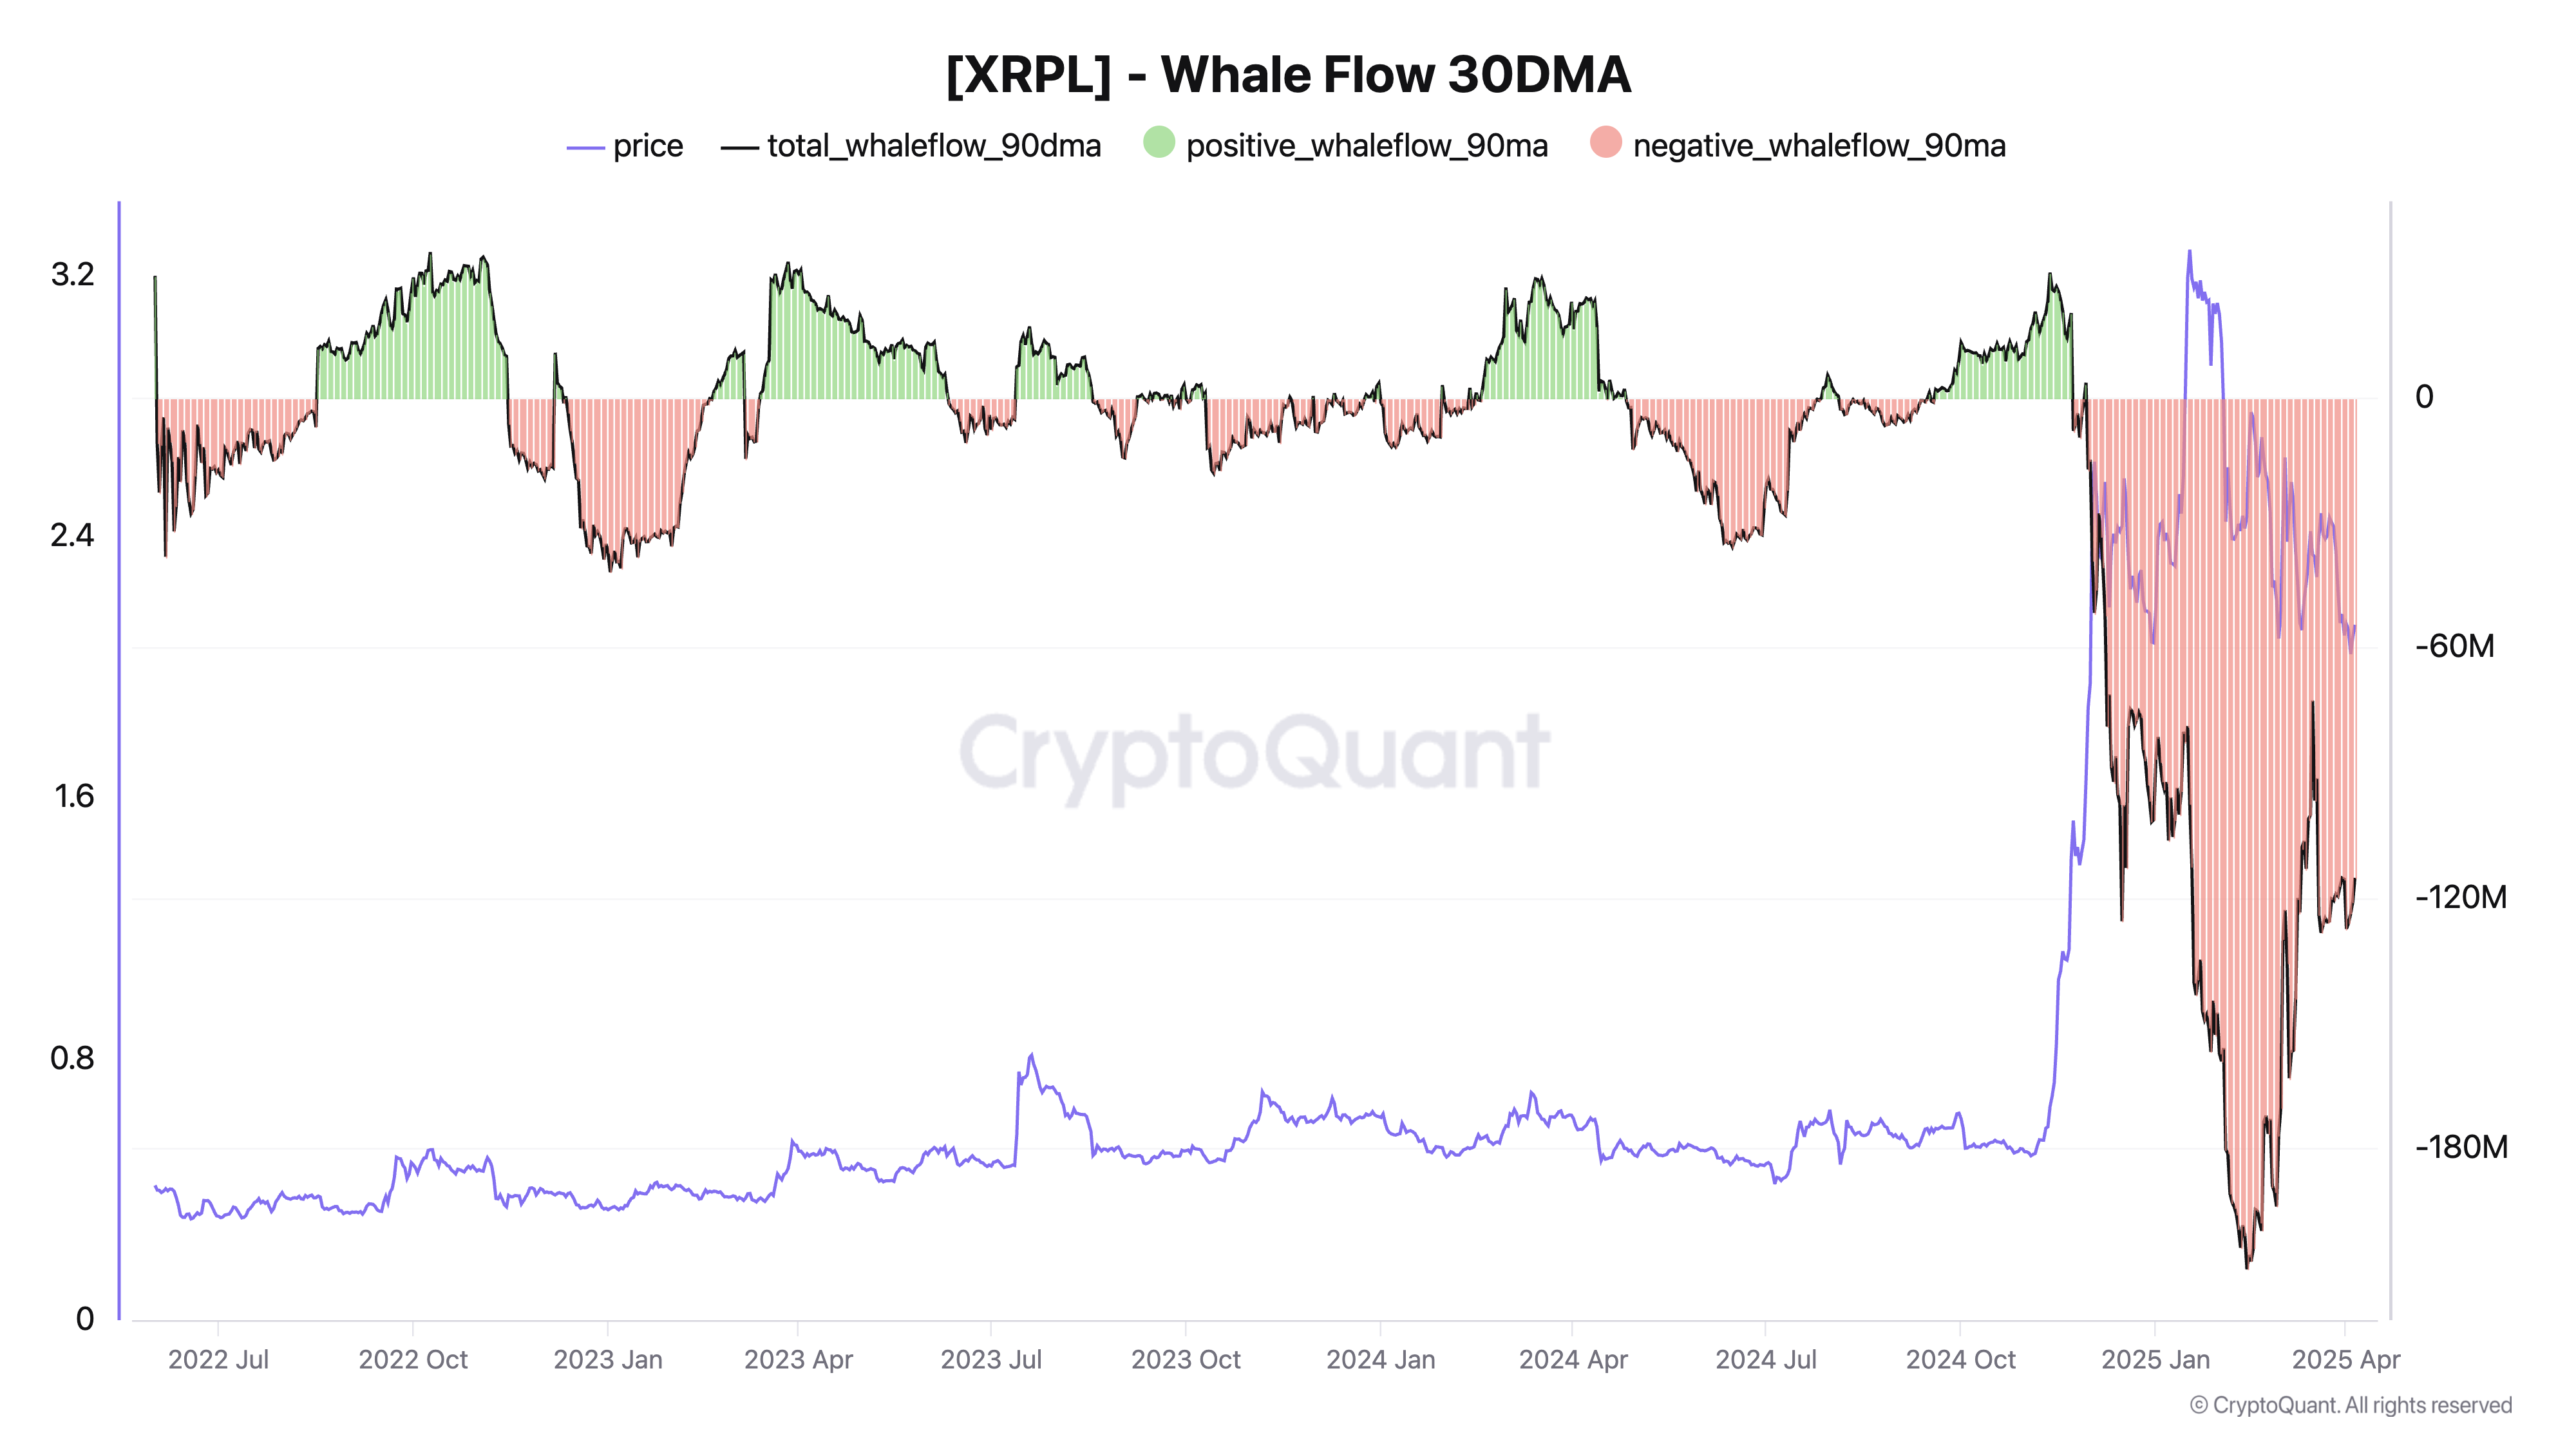
XRP whale flow 90-day moving average.
During the significant price surge of XRP in Q4 2024, whale activity turned sharply negative, indicating that large entities were distributing their holdings into the rising market and selling near local peaks. This trend has persisted into 2025, with total whale flow remaining decidedly in the negative.
This disconnect between rising prices and diminishing whale interest suggests a weakening conviction among institutional investors and raises concerns regarding XRP’s price stability in the short term unless accumulation resumes.
Moreover, developments such as global tariffs and the Federal Reserve’s somewhat hawkish stance have dampened risk appetite, potentially impacting XRP and the wider cryptocurrency market in the upcoming quarters.
This content does not constitute investment advice or recommendations. All investment and trading decisions carry risks, and readers are encouraged to conduct their own research before making any decisions.