Bitcoin’s (BTC) 26.62% drop from its peak of $109,500 is on track to become the most significant decline in the ongoing bull market cycle, as noted by the head of research at CryptoQuant, Julio Moreno.
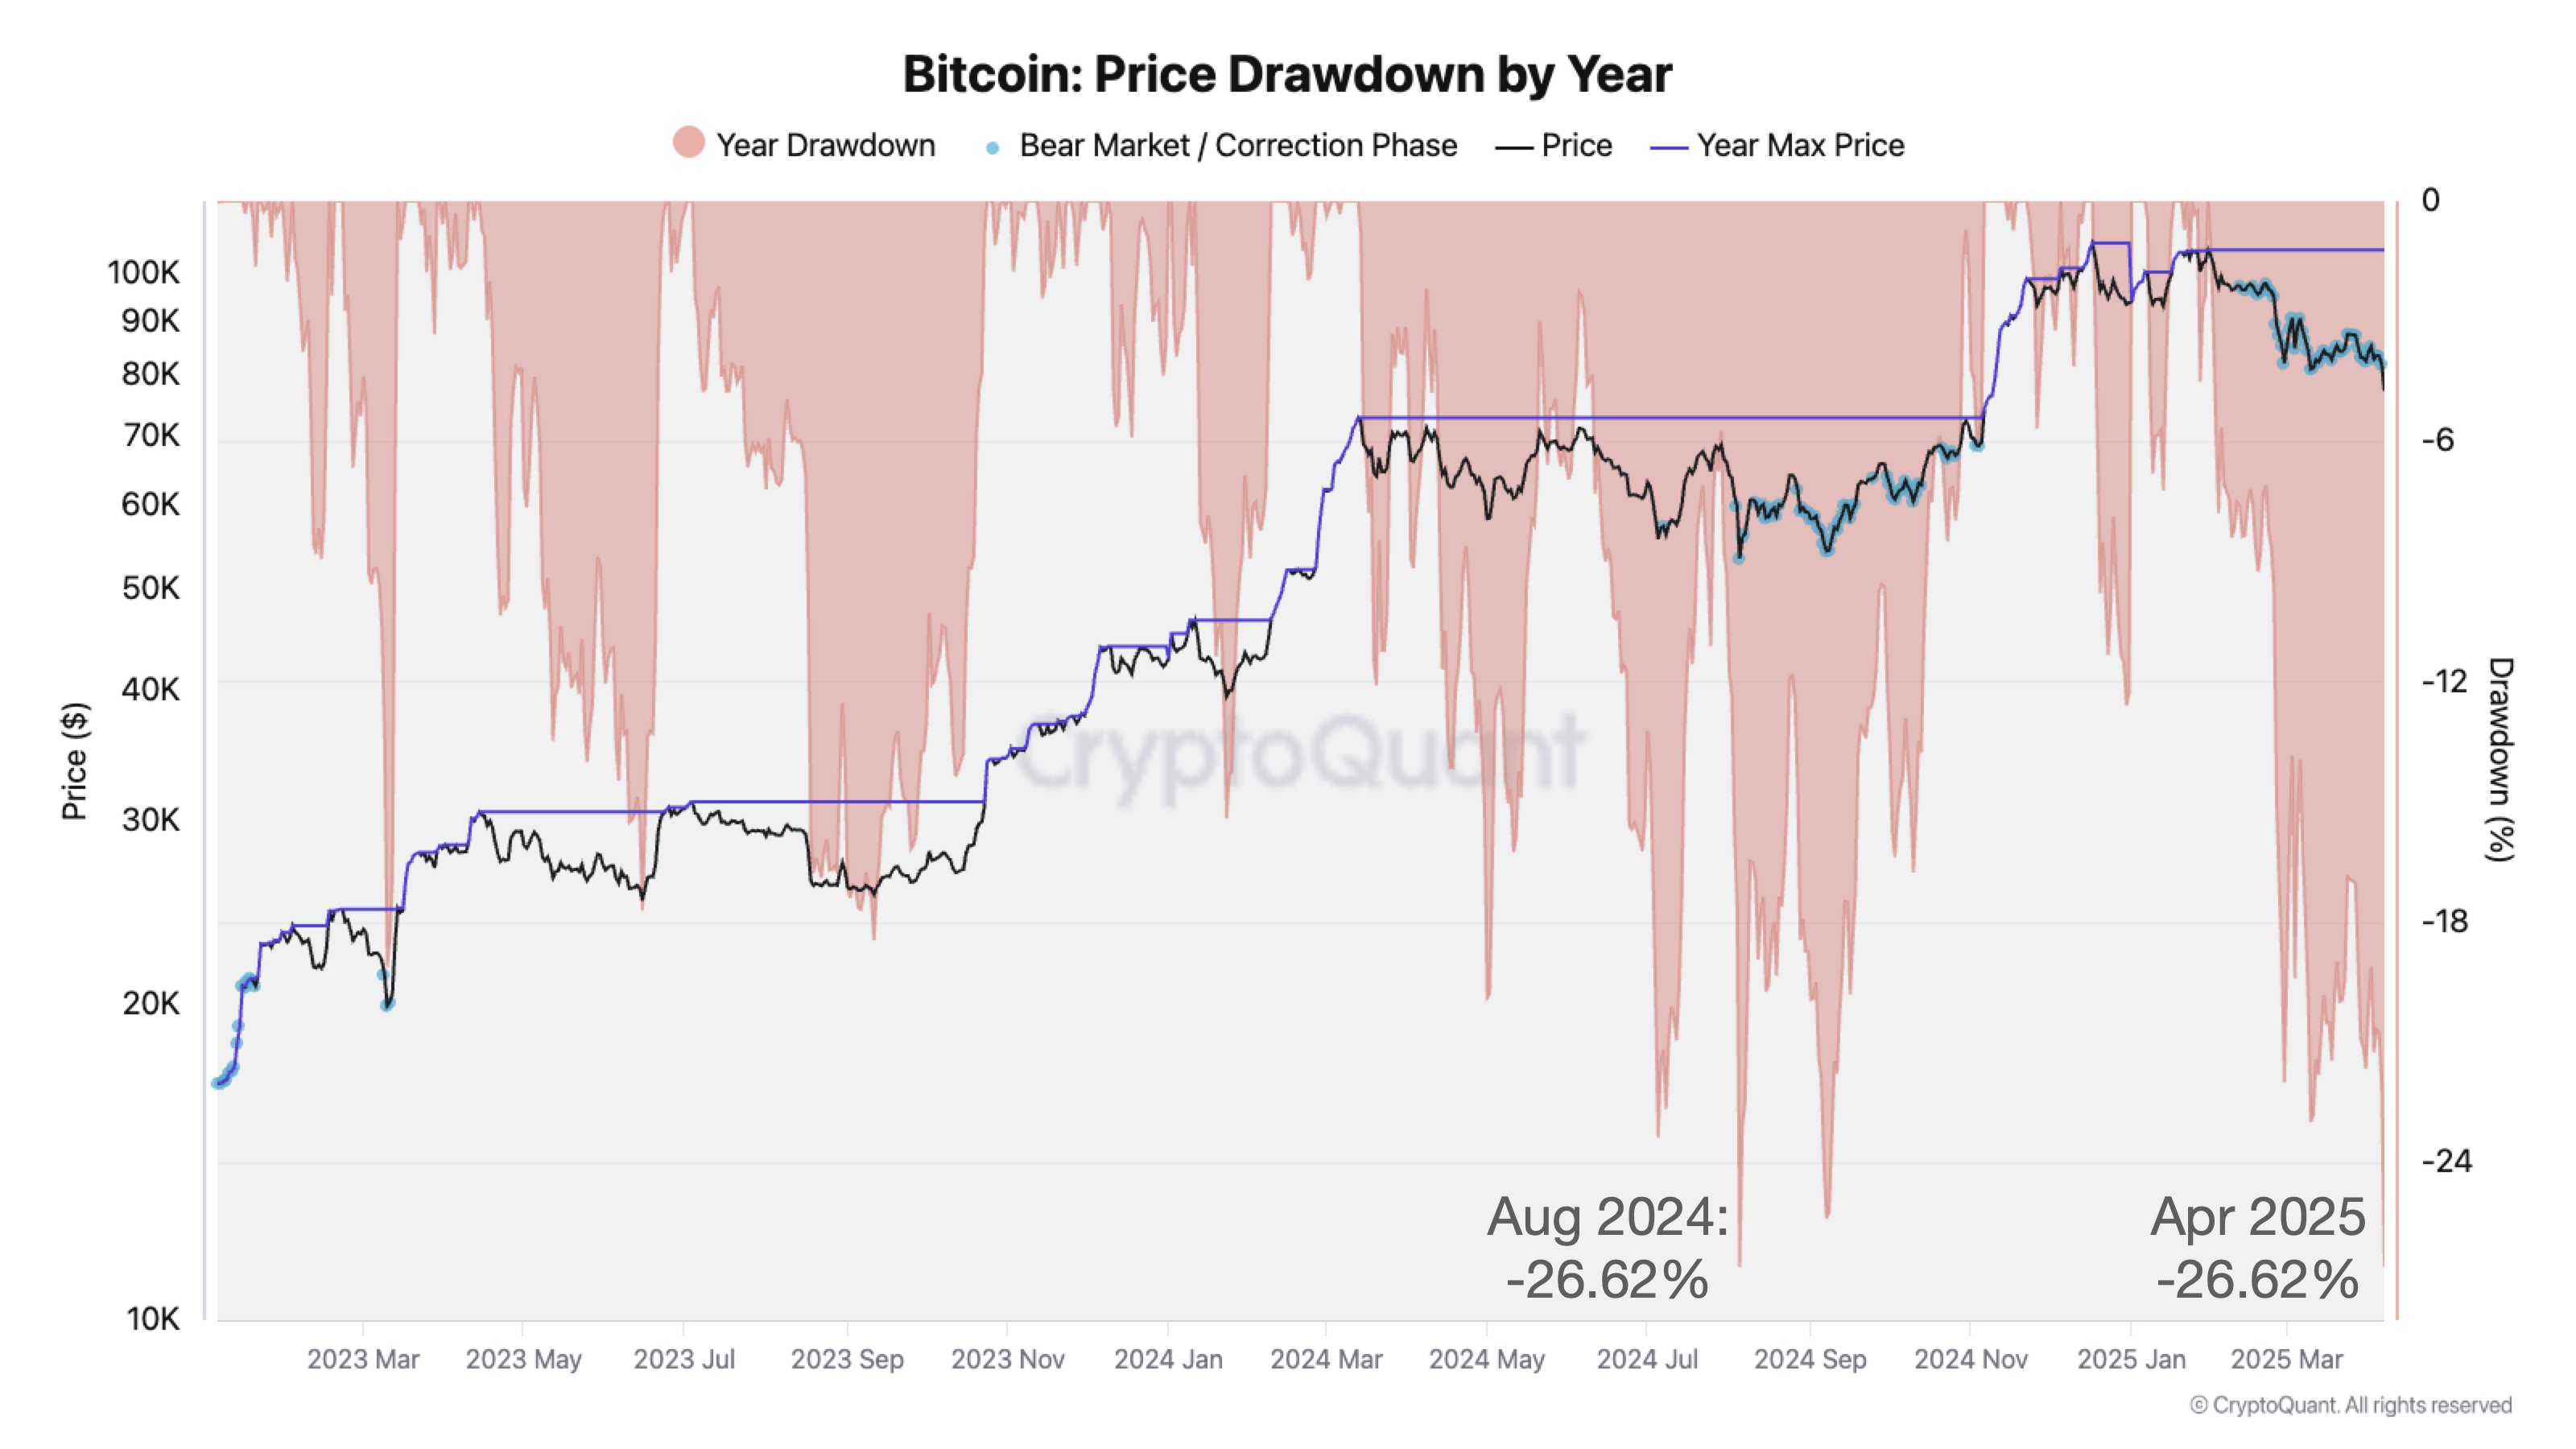
Bitcoin price drawdown analysis.
In previous market cycles, Bitcoin has faced considerable downturns, including an 83% drop from its 2018 peak and a 73% correction from its all-time highs in 2022. The current 26.62% decline, while significant, does not match the severity of earlier bear markets.
This indicates that, while the current downturn is noteworthy, it has not yet reached the levels of intensity seen in past cycles. Nevertheless, the crypto and macro resource ecuminometrics indicated that Bitcoin may find it challenging to initiate a quick recovery. The analysts stated,
“Historically, when the NASDAQ 100 drops below its long-term year-on-year average return, Bitcoin tends to appreciate at a slower rate, and it faces an increased risk of entering a deeper correction.”
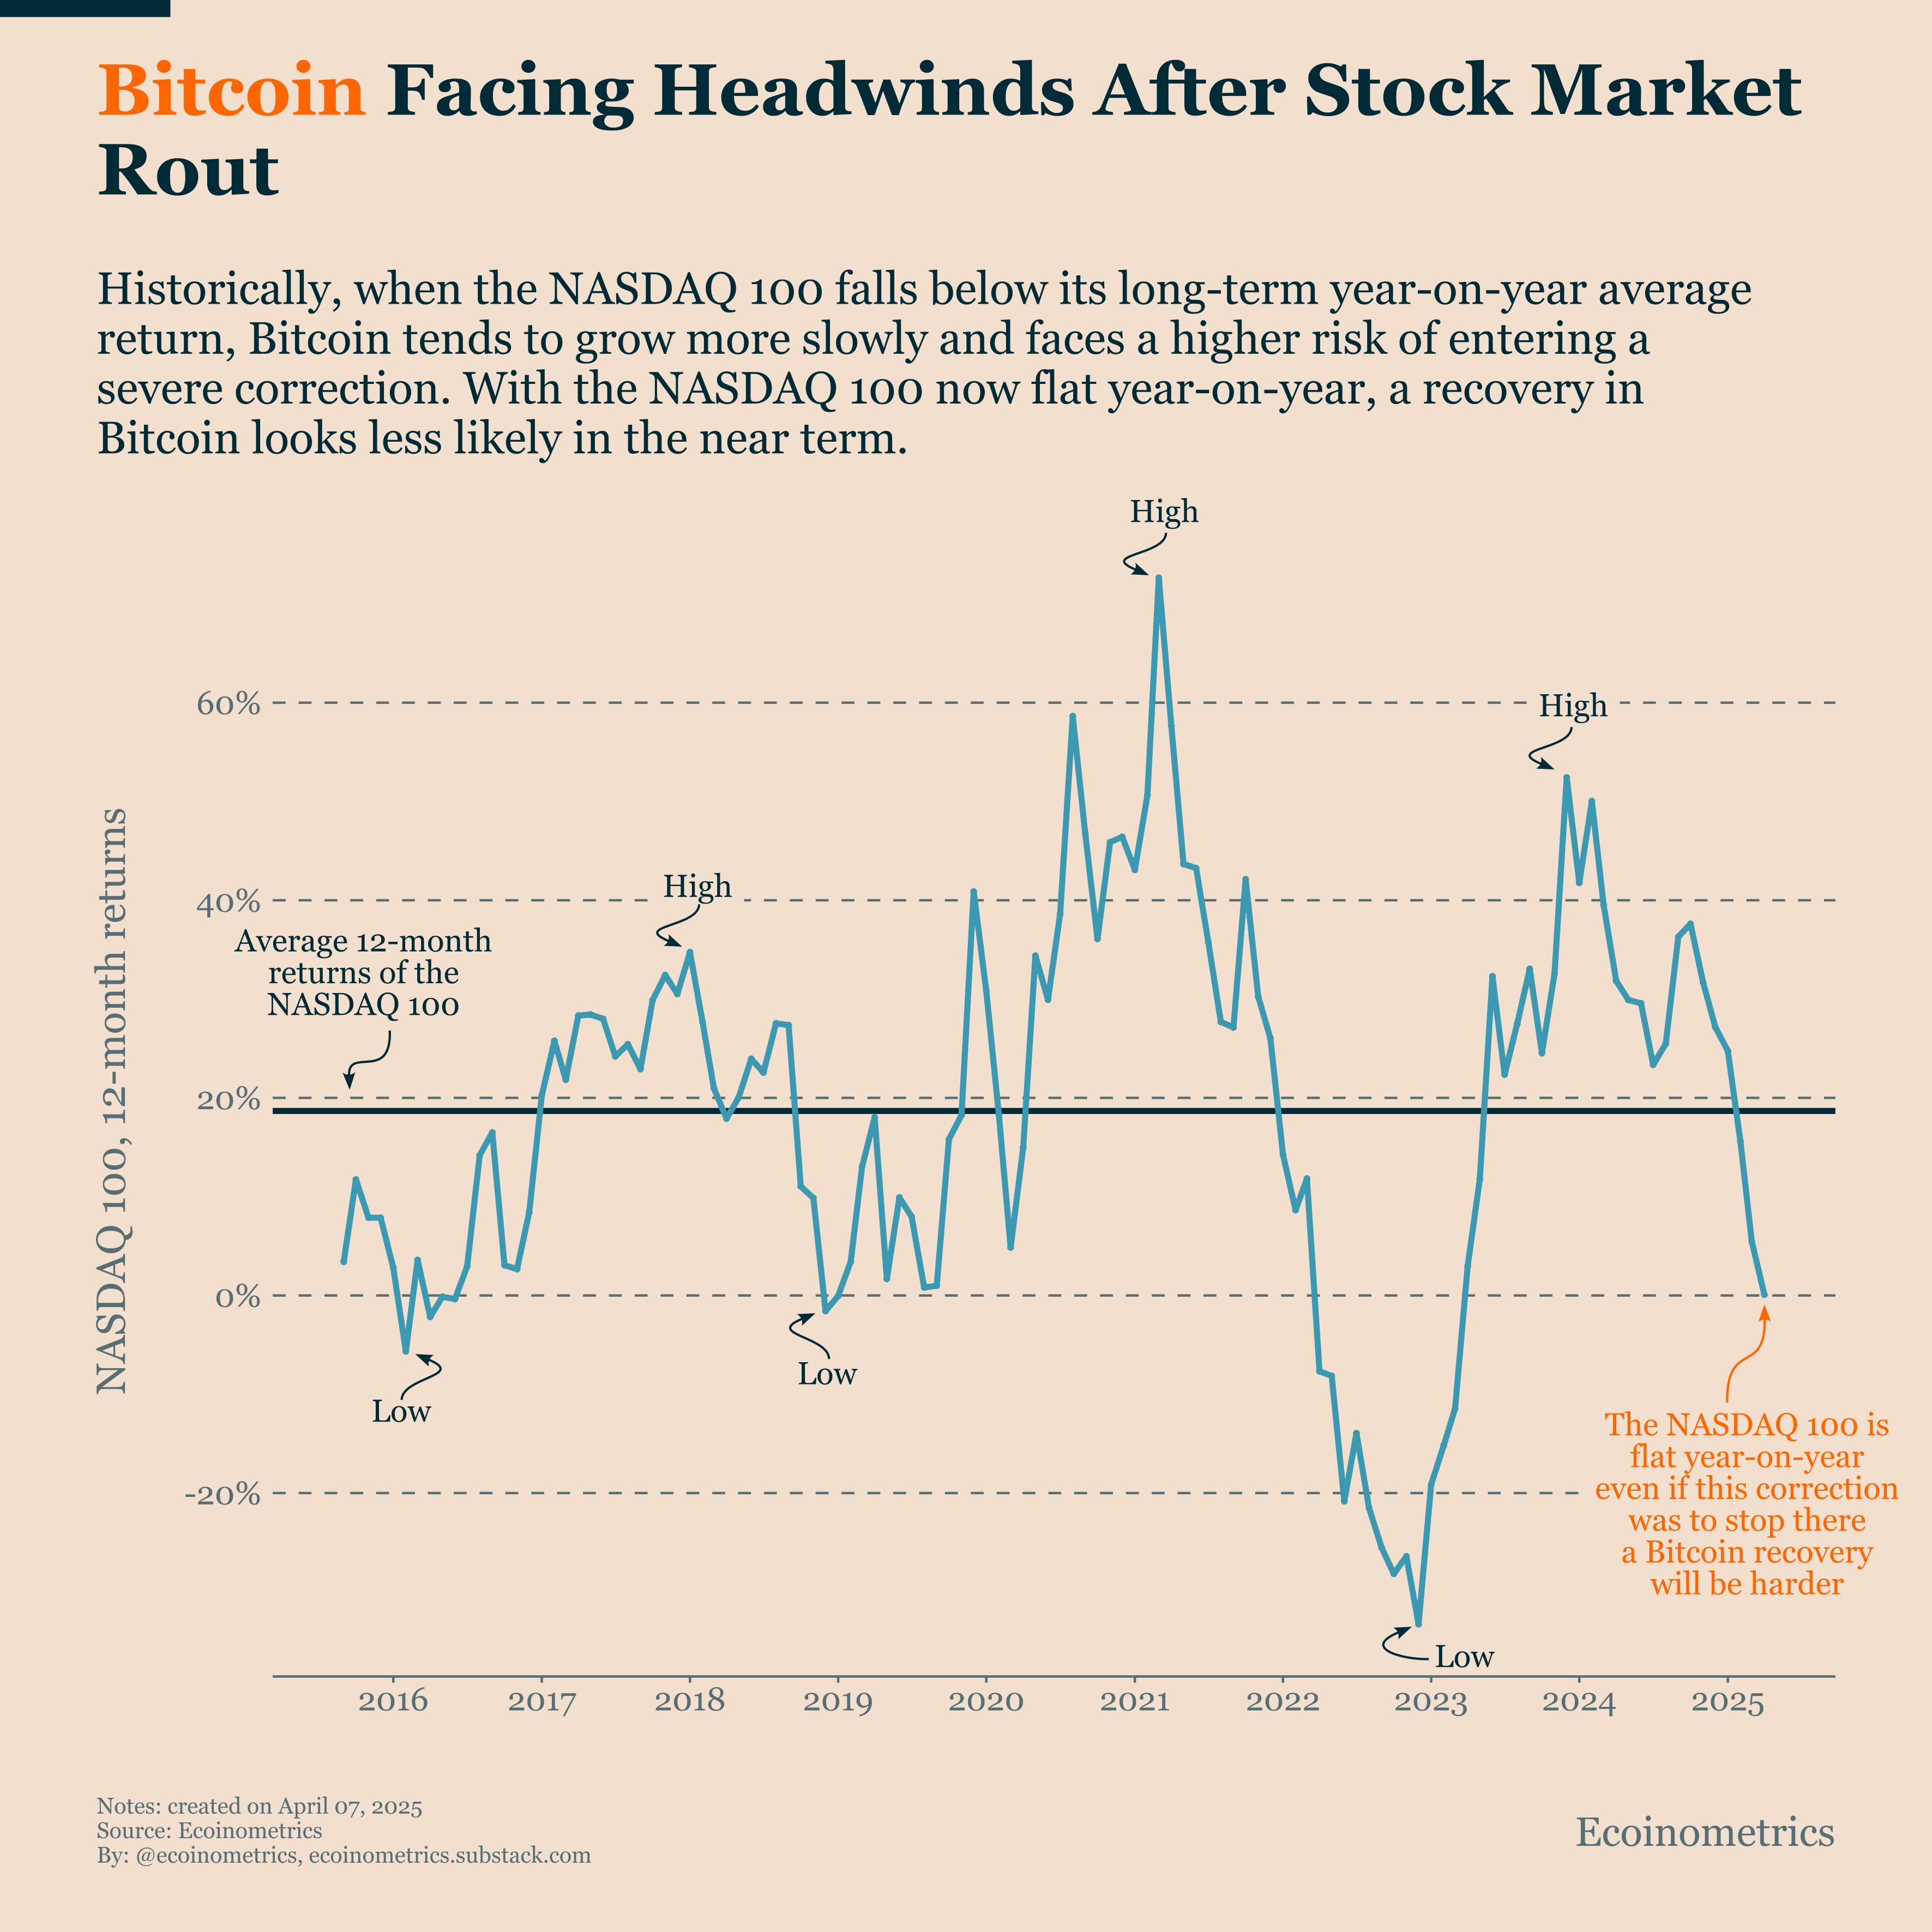
Bitcoin and Nasdaq correlation.
With the Nasdaq 100 remaining flat year-on-year, Bitcoin’s path to recovery might be arduous, even if its correction comes to a halt.
The recent decline in Bitcoin’s price has also put Michael Saylor’s strategy on the defensive, prompting the firm to refrain from acquiring any Bitcoin for its treasury from March 31 to April 6.
Moreover, data from a strategy tracker revealed that the company has invested $35.65 billion in its Bitcoin holdings, which currently reflects a modest 17% return over a five-year period.
Related: Michael Saylor’s strategy pauses Bitcoin acquisitions despite dropping below $87K
Can Bitcoin sustain a level above $70K?
On the weekly chart, Bitcoin has engaged with the 50-week exponential moving average (indicated in blue) for the first time since September 2024. A weekly close beneath this 50-W EMA has historically indicated the beginning of a bear market in previous market cycles.
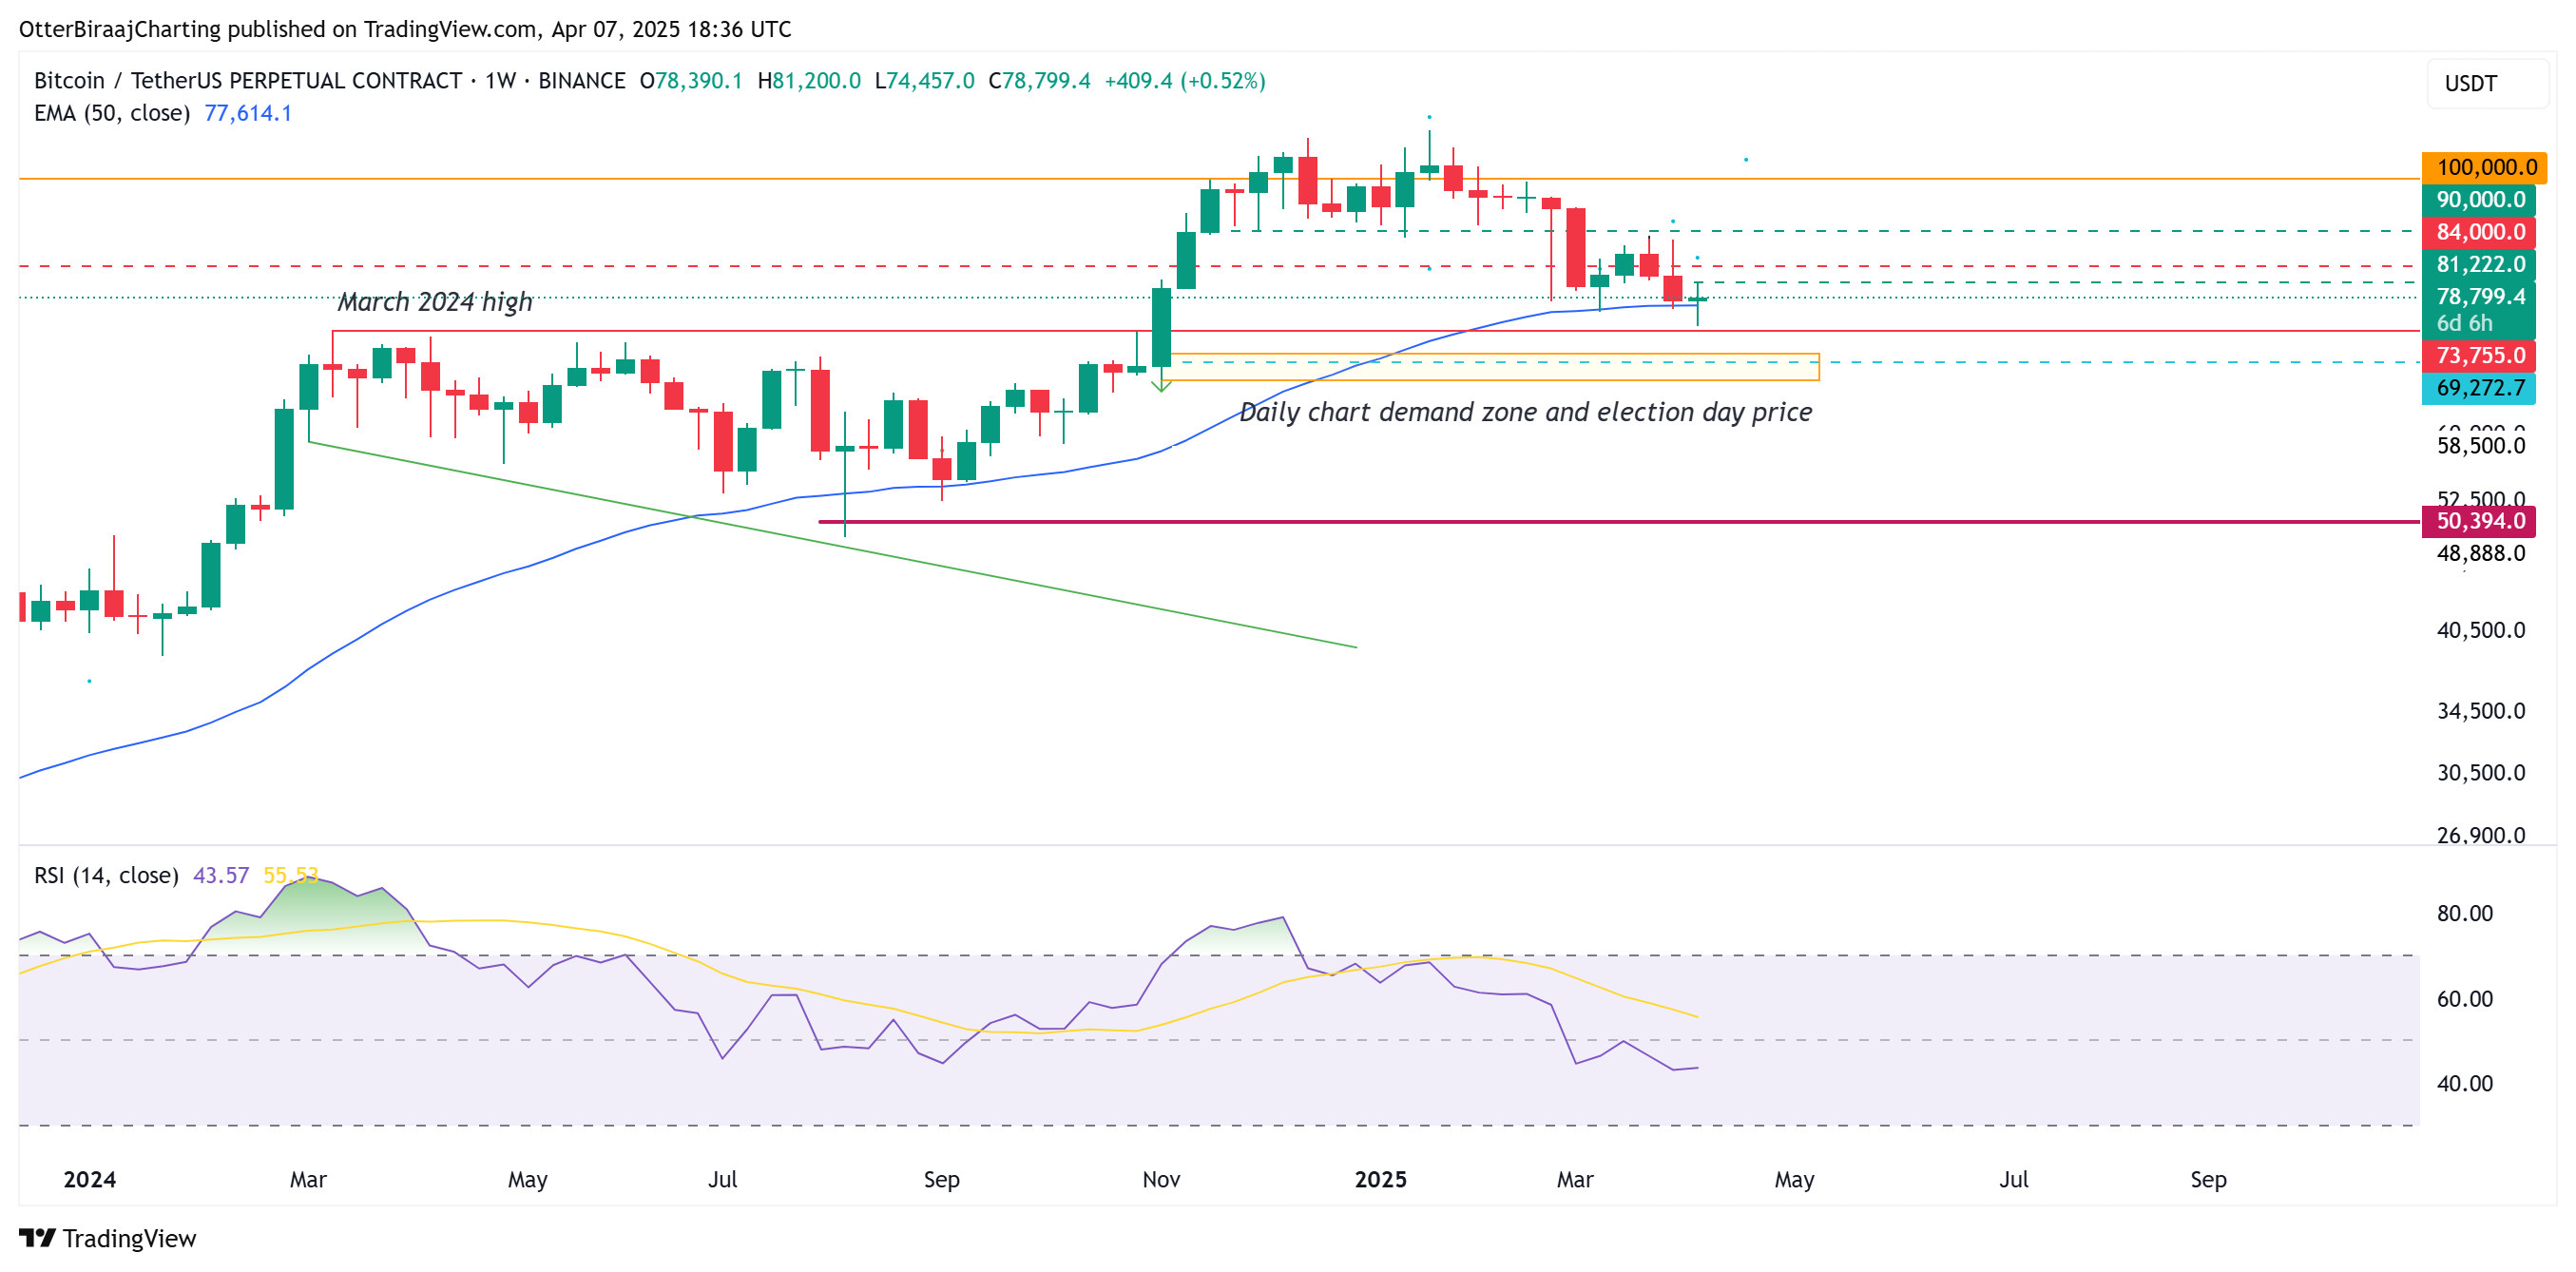
Bitcoin weekly chart.
The immediate area of interest below the current price extends to $74,000, which marked the early 2024 all-time high. However, the daily demand zone between $65,000 and $69,000 reflects a potentially stronger liquidity zone due to its importance, with $69,000 also being the 2021 all-time high.
Additionally, Bitcoin’s weekly relative strength index (RSI) fell to its lowest point of 43 at the end of Q1, a level not seen since January 2023. In August 2023 and September 2024, the RSI rebounded from a similar low, which sparked a price recovery for Bitcoin. Conversely, in 2022, when the RSI dipped below 40, bears seized complete control of the market.
An anonymous crypto trader, Rekt Capital, has predicted based on the daily RSI values and asserted,
“Historical daily RSI trends in this cycle suggest that anything from the current prices up to approximately $70,000 is likely to represent the bottom of this correction.”
Related: Bitcoin and stocks suffer after ‘90-day tariff pause’ is deemed fake news — BTC whales continue to accumulate
This article does not provide investment advice or recommendations. Every investment and trading decision carries risk, and readers should conduct their research before acting on any information.