- Bitcoin’s price remains around $78,600 on Monday after a nearly 5% drop last week.
- Ethereum struggles to hold support at critical levels, reaching price points not observed since 2023.
- XRP sinks below its support level of $1.96, eyeing its annual low.
The price of Bitcoin (BTC) fluctuates near $78,600 on Monday after experiencing a nearly 5% decline last week. In a similar trend, Ethereum (ETH) and Ripple (XRP) also dropped 13% and 10%, respectively, during the same period. The bearish sentiment lingers as ETH hits levels not seen since 2023, while BTC and XRP target their yearly lows.
Bitcoin bears set sights on an annual low of $76,606
Bitcoin’s price fell by almost 5% last week after facing resistance at the significant level of $85,000. On Sunday, it found support around $78,258. As of Monday, it continues to hover around that support level.
If BTC breaks and closes below $78,258, it may continue its decline to retest its annual low of $76,606 (low from March 11). A successful close below that could lead to further declines, targeting the next support level at $73,072.
The Relative Strength Index (RSI) on the daily chart shows a reading of 37, below the neutral level of 50, indicating strong bearish momentum. Moreover, the Moving Average Convergence Divergence (MACD) indicator also displayed a bearish crossover on Sunday, signaling sell prompts and hinting at a downward trajectory.
BTC/USDT daily chart
Nonetheless, if BTC manages to find support at the $78,258 level, it could lead to a recovery and retest its daily resistance at $85,000.
Ethereum hits price levels not recorded since October 2023
Ethereum’s price dropped nearly 13% last week after failing to close above the daily level of $1,861. Additionally, on Sunday, it retraced to test its important psychological level of $1,700, which it hasn’t approached since October 2023. As of Monday, it sits around $1,575.
If ETH continues its descent, it could fall further to retest its next daily support at $1,449.
The RSI has a reading of 27, below the oversold threshold of 30, indicating that Ethereum might be undervalued and could be poised for a potential recovery. However, the RSI may remain under the oversold level and continue its downward trend. The MACD indicator also shows a bearish crossover from Sunday, indicating sell signals and suggesting a downward trend.
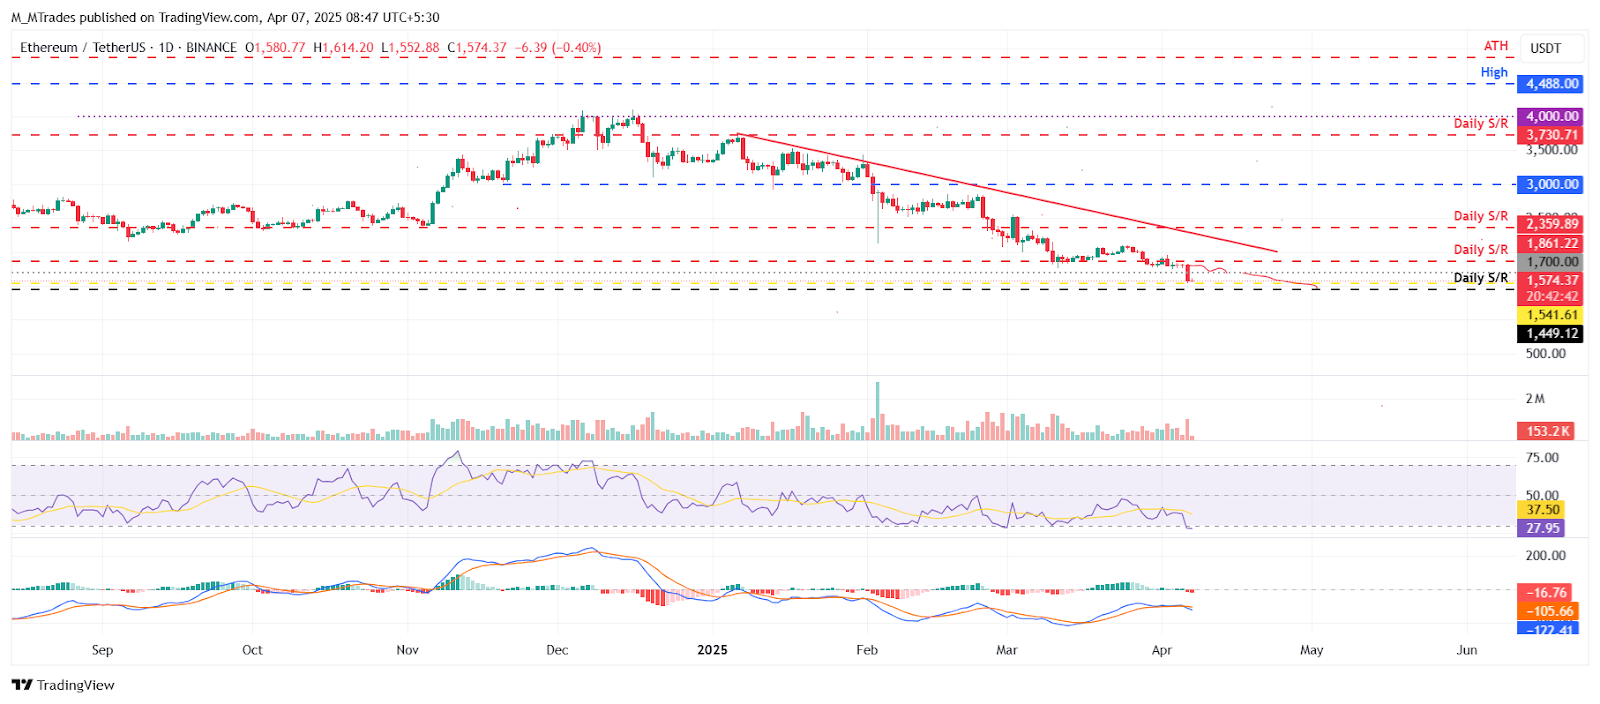
ETH/USDT daily chart
In contrast, should ETH experience a recovery, it could extend its rebound to retest the crucial psychological mark of $1,700.
XRP bears aiming for annual low as it slips below $1.96 support
XRP’s price fell 10% last week, closing below its 200-day Exponential Moving Average (EMA) at $1.94, with its daily support level sitting at $1.96 on Sunday. As of Monday, it trades around $1.86.
Should XRP continue its downward path, it may reach its February 3 daily low of $1.77, which is also the lowest price point observed this year.
The RSI on the daily chart reads 33, below the neutral level of 50, similar to Bitcoin, indicating strong bearish momentum.
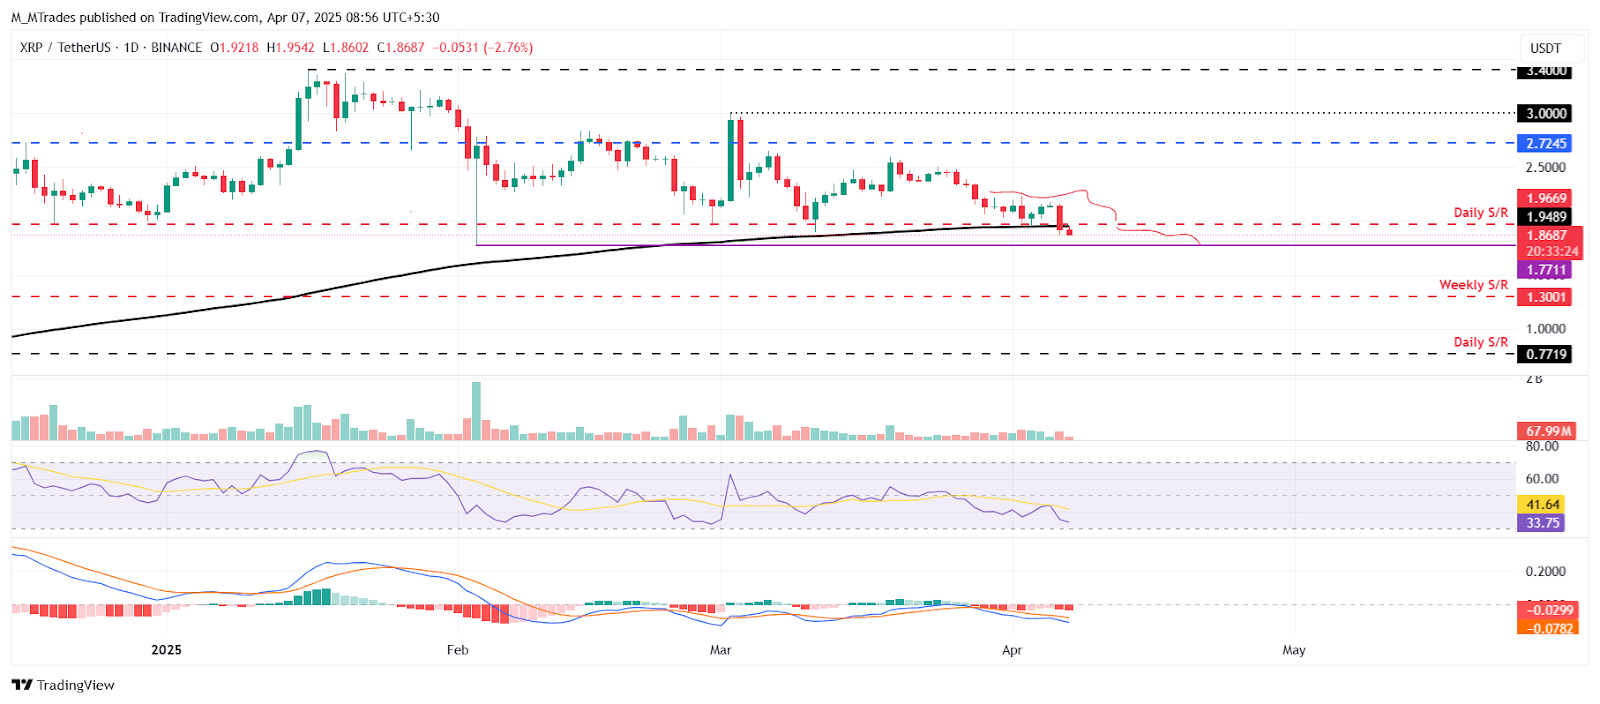
XRP/USDT daily chart
Bitcoin, Altcoins, and Stablecoins FAQs
Bitcoin is the largest cryptocurrency by market capitalization, designed to function as a medium of exchange. It operates independently of any single individual, group, or entity, eliminating reliance on third-party involvement in financial transactions.
Altcoins refer to any cryptocurrency other than Bitcoin, although some consider Ethereum a disqualifying factor. In this sense, Litecoin, created from the Bitcoin protocol, is often regarded as the first altcoin, viewed as an “improved” iteration.
Stablecoins are cryptocurrencies aimed at maintaining a stable value, usually backed by a reserve of the underlying asset. They achieve this by pegging their value to a commodity or a financial instrument, like the US Dollar (USD), with supply managed by algorithms or demand. The primary purpose of stablecoins is to facilitate trading and investment in cryptocurrencies while providing a means of value retention amidst general cryptocurrency volatility.
Bitcoin dominance is the ratio between Bitcoin’s market cap and the combined market cap of all cryptocurrencies. This metric is indicative of investor interest in Bitcoin. High BTC dominance tends to occur prior to and during bullish market phases, where investors prefer the stability of high-cap cryptocurrencies like Bitcoin. Conversely, a decline in BTC dominance typically indicates that investors are reallocating capital or profits toward altcoins in search of greater returns, often sparking significant altcoin rallies.