On April 6, Bitcoin (BTC) dipped below $75,000, influenced by traditional market movements as S&P 500 futures reached their lowest point since January 2024. This initial wave of anxiety also triggered a decline in WTI oil futures, which fell below $60 for the first time in four years. However, the markets managed to recover some losses later on, enabling Bitcoin to bounce back to the $78,000 mark.
Bitcoin’s tenuous ties to traditional markets
Some analysts suggest that Bitcoin may be entering a bear market after experiencing a 30% price drop from its peak; however, historical patterns showcase numerous instances of even more robust recoveries. Notably, the correlation between Bitcoin and traditional markets generally proves to be temporary. Several indicators point to traders biding their time for more favorable entry points.
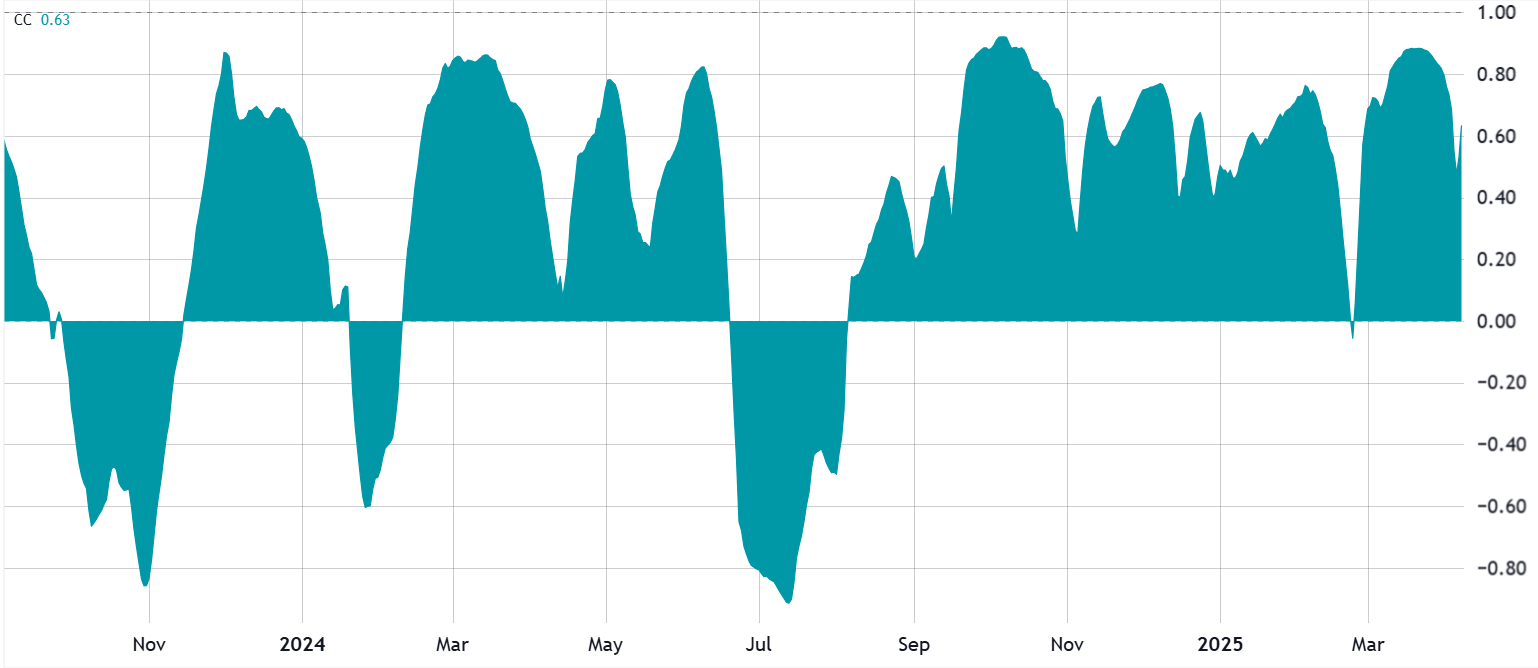
40-day correlation: S&P 500 futures vs. Bitcoin/USD. Data sourced from TradingView.
Recently, Bitcoin’s performance has been closely linked to the S&P 500, though this correlation has varied significantly over time. For instance, the correlation turned negative in June 2024, with the two asset classes moving in opposite directions for nearly 50 days. Moreover, while the correlation remained above 60% for 272 days over the past two years—approximately 38% of the observed period—this still lacks statistical significance.
The recent decline in Bitcoin to $74,440 illustrates rising uncertainty in traditional markets. Although there have been instances of intense correlation between Bitcoin and traditional assets, these periods tend to be fleeting. Additionally, most major tech stocks are currently trading down by 30% or more from their historical peaks.
The performance of gold as a “store of value” from 2022 to 2024
Despite a market capitalization of $1.5 trillion, Bitcoin ranks among the top 10 tradable assets worldwide. While gold is often considered the primary reliable “store of value,” this belief tends to overlook its volatility. For example, gold fell to $1,615 by September 2022 and took three years to regain its previous all-time high of $2,075.
Although gold’s market capitalization stands at $21 trillion—14 times greater than that of Bitcoin—the gap in spot exchange-traded fund (ETF) assets under management is much narrower: $330 billion for gold alongside $92 billion for Bitcoin. Furthermore, Bitcoin-related instruments like the Grayscale Bitcoin Trust (GBTC) were introduced on exchanges in 2015, meaning gold had a 12-year head start in terms of market presence.
Importance of Bitcoin ETFs and resilience in BTC derivatives
From a derivatives perspective, Bitcoin perpetual futures (inverse swaps) are currently in strong condition, with the funding rate staying close to zero. This reflects a balanced demand for leverage among both long (buyers) and short (sellers) positions. This is a stark contrast to the period from March 24 to March 26, when the funding rate turned negative, hitting 0.9% per month, indicating a stronger interest in bearish positions.
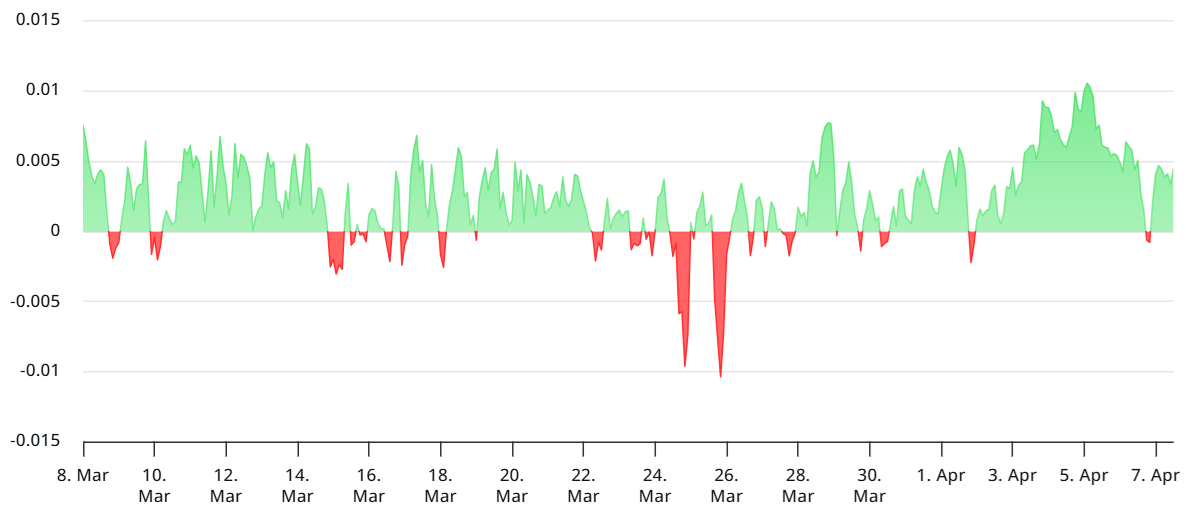
Bitcoin perpetual futures 8-hour funding rate. Data from Laevitas.ch.
Additionally, the $412 million liquidation of leveraged long positions between April 6 and April 7 was relatively minor. In comparison, during the 12.6% decline in Bitcoin’s price from February 25 to February 26, liquidations of leveraged bullish positions amounted to $948 million. This suggests traders were either better prepared this time around or opted to limit their leverage.
Finally, the demand for stablecoins in China provides further insight into market sentiment. Typically, strong retail demand for cryptocurrencies leads stablecoins to trade at a premium of 2% or more over the official US dollar rate. In contrast, a premium under 0.5% can indicate fear, as traders seek to exit crypto markets.
Related: A well-known strategy halts Bitcoin purchases even with a dip below $87K
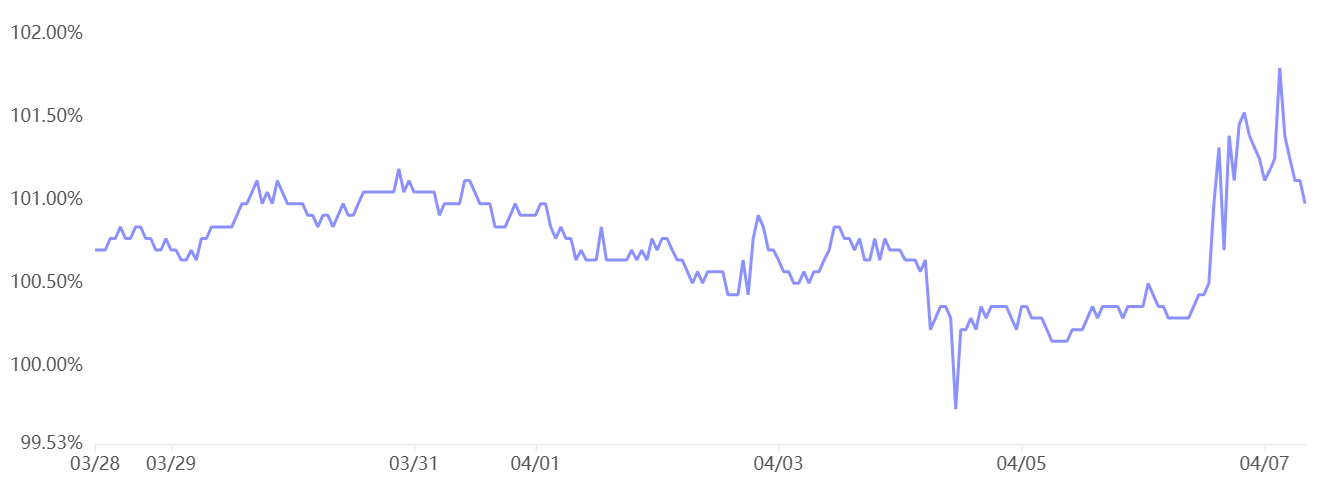
USDT Tether (USDT/CNY) compared to US dollar/CNY. Data from OKX.
The premium for USD Tether (USDT) stood at 1% on April 7, despite Bitcoin’s price dropping below $75,000. This implies that investors might be moving towards stablecoins, potentially awaiting confirmation that the US stock market has bottomed out before diving back into cryptocurrency investments.
Historically, Bitcoin has exhibited a weak correlation with the S&P 500. Furthermore, the nearly zero BTC futures funding rate, relatively modest futures liquidations totaling millions, and the 1% stablecoin premium in China all suggest a strong possibility that Bitcoin’s price may have found a bottom at around $75,000.
This article serves informational purposes only and should not be considered as legal or investment advice. The views expressed herein are those of the author alone and do not necessarily reflect the views or opinions of any particular organization.