- XRP has fallen below the critical $2.00 support level during the weekend sell-off, with technical indicators suggesting a bleak outlook.
- The increasing number of active addresses, now at 1.48 million, indicates solid fundamentals.
- Despite unfavorable micro factors, such as a declining RSI and a MACD sell signal, Ripple whales are capitalizing on the dip.
XRP is continuing to decline, breaking below last week’s significant support level at $2.00, as U.S. President Donald Trump reiterated his commitment to tariffs, emphasizing the need for the U.S. to address its trade deficit before reaching any agreements. The digital currency is currently trading at $1.82 during the late Asian trading session on Monday, having dropped 10.7% in the past 24 hours, bringing its total seven-day decline to 10%.
XRP whales accumulate tokens amidst cryptocurrency market turmoil
However, rather than succumbing to panic, XRP whales are seizing the opportunity to purchase the discounted tokens, increasing their holdings. Data indicates that the proportion of coins held by addresses with between 100,000 and 1 million tokens has risen from 5.189% to 5.267% of the total supply. Additionally, those holding between 10 million and 100 million XRP have also increased their share, which now constitutes 3.406% of the total from 3.046%.
XRP supply distribution | Data source available
XRP’s network activity has also seen a rise, with active addresses increasing from 78,811 on March 7 to 82,000 over the last 30 days. This surge in active addresses suggests greater user engagement with the network, pointing to expanding adoption, which may lead to higher transaction volumes or a rise in the utilization of decentralized applications (dApps).
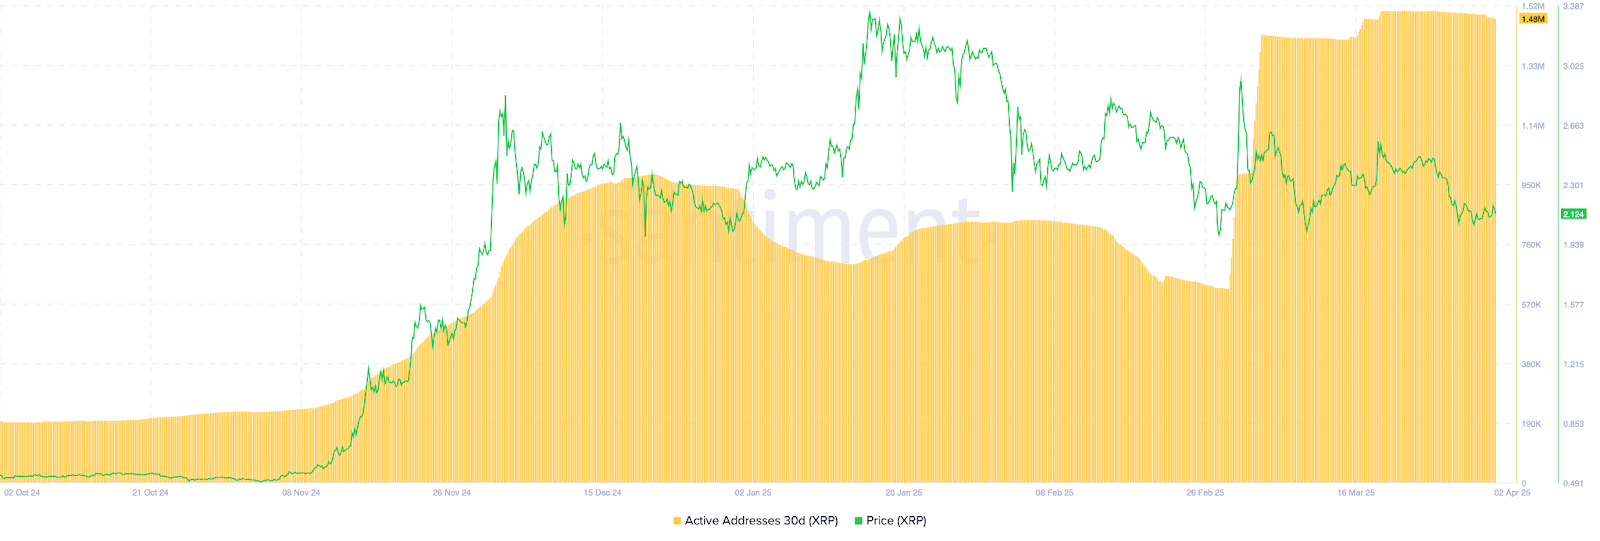
XRP Active Addresses | Data source available
What are the potential lows for XRP? Analyzing technical indicators
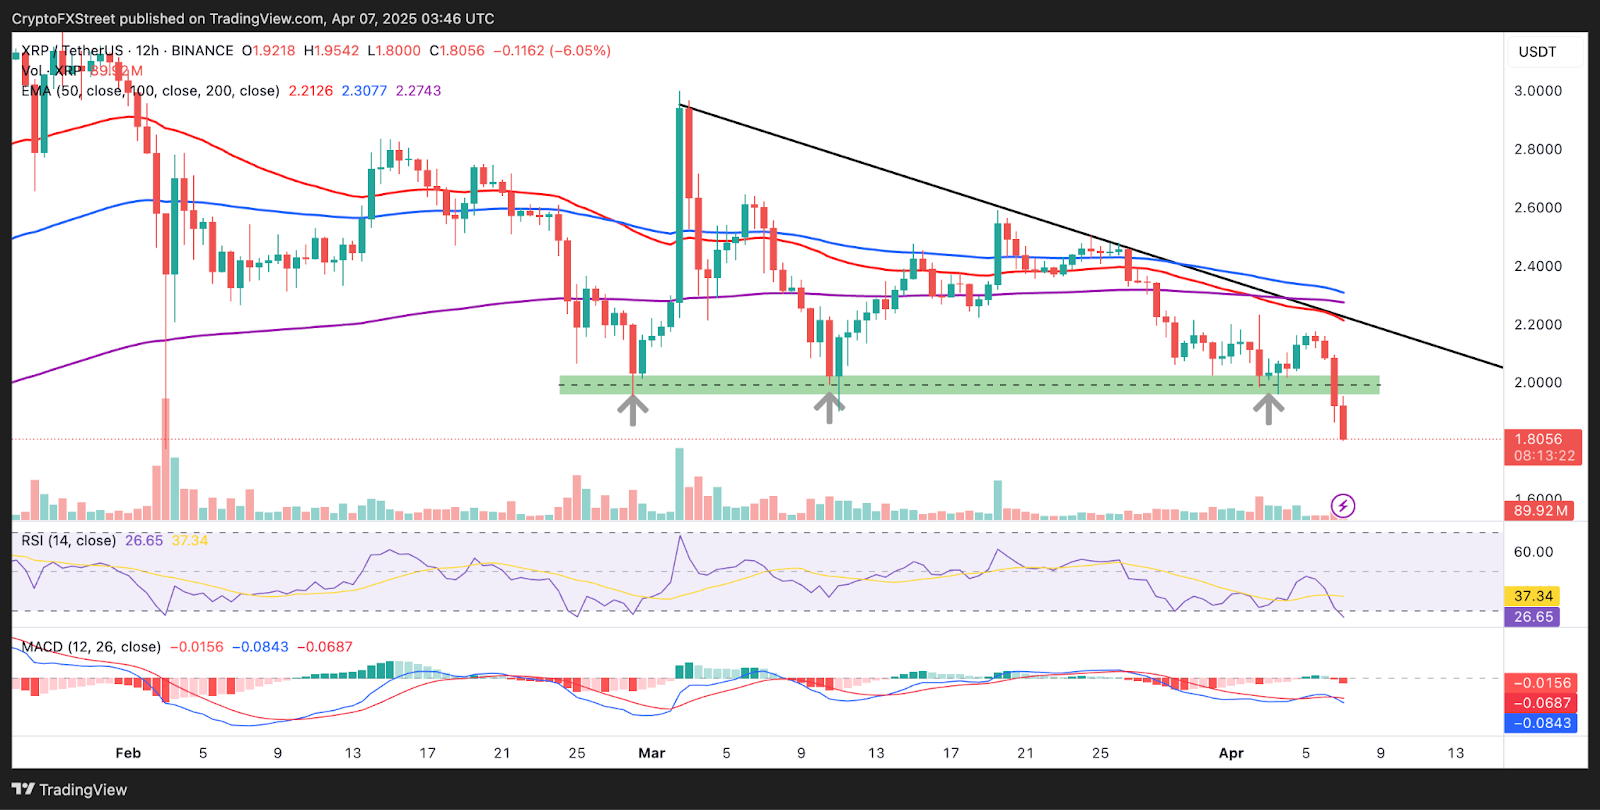
XRP has finally breached the descending triangle pattern, which indicated a potential 68% decline according to the previous analysis. With the $2.00 support now compromised, sellers are likely to intensify their efforts, causing further distress for holders.
Technical indicators, such as the Relative Strength Index (RSI), continue to decline and are approaching oversold conditions. Should this trend persist, XRP could potentially retest levels around $1.5 and $1, with the triangle projection suggesting a drop to $0.67.
The Moving Average Convergence Divergence (MACD) indicator remains in a sell position on the 12-hour chart, indicating that traders might want to short XRP, thereby adding further downward pressure.
XRP/USDT 12-hour chart
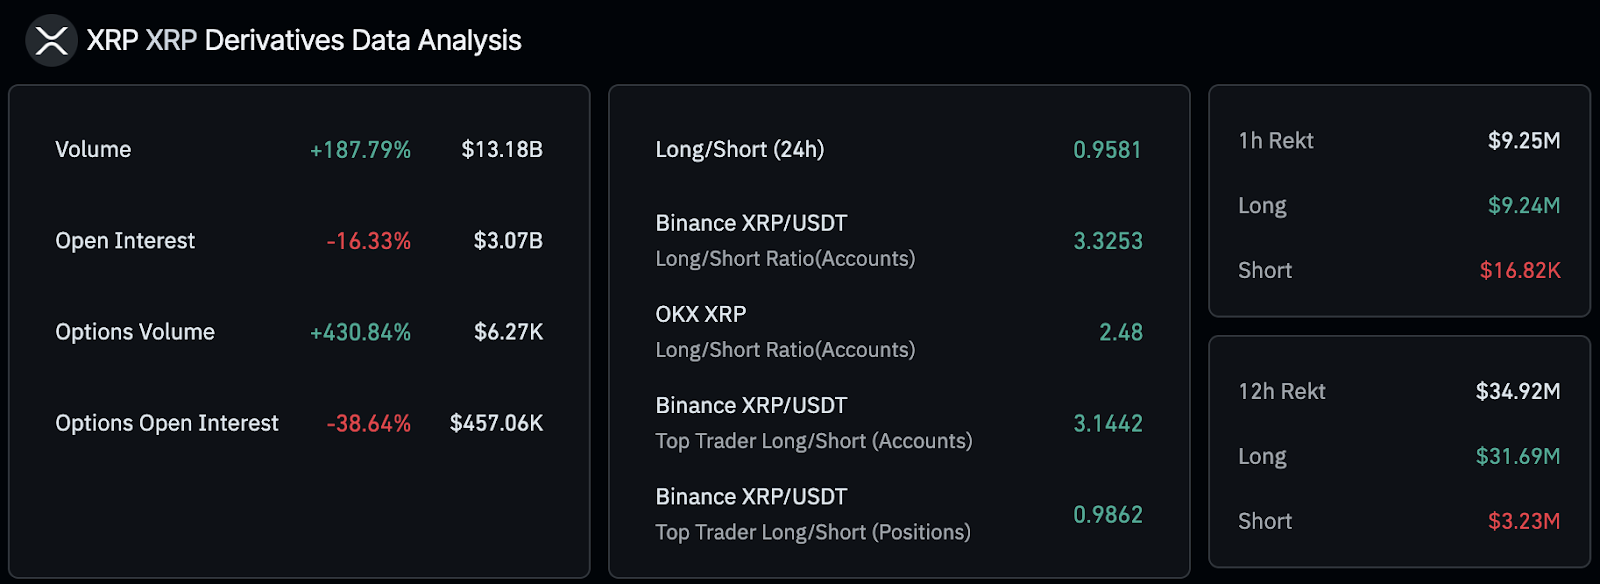
According to recent data, the open interest in XRP derivatives has further decreased to $3.07 billion over the last 24 hours, reflecting a 16% decline. Liquidations during this period reached $38.33 million, with $34.63 million attributed to long positions and $3.70 million to shorts.
XRP open interest | Data source available
The downward trend may persist this week as global markets react to the implications of Trump’s tariffs. However, increased activity from large holders could offset some of the selling pressure, supporting XRP at $1.8 and presenting opportunities for a significant rebound beyond the $2 mark.