The price of Ethereum has plummeted this year, placing it among the poorest performers in the cryptocurrency market.
Ethereum (ETH) has seen a drop for three weeks in a row, hitting its lowest point since March 2023. It has lost more than half of its value since its peak in November, costing investors billions. This article explores the current Ethereum price decline through essential charts.
Spot Ethereum ETFs experiencing significant outflows
One factor contributing to the decline in ETH’s price is the significant outflows from spot ETFs this year, indicating weak demand in the U.S. As illustrated in the chart below, these funds have experienced net outflows for the past six weeks. Currently, they hold only $2.3 billion in net inflows compared to Bitcoin’s $35 billion, suggesting a strong preference for Bitcoin among investors.
Ethereum has lost its fee dominance
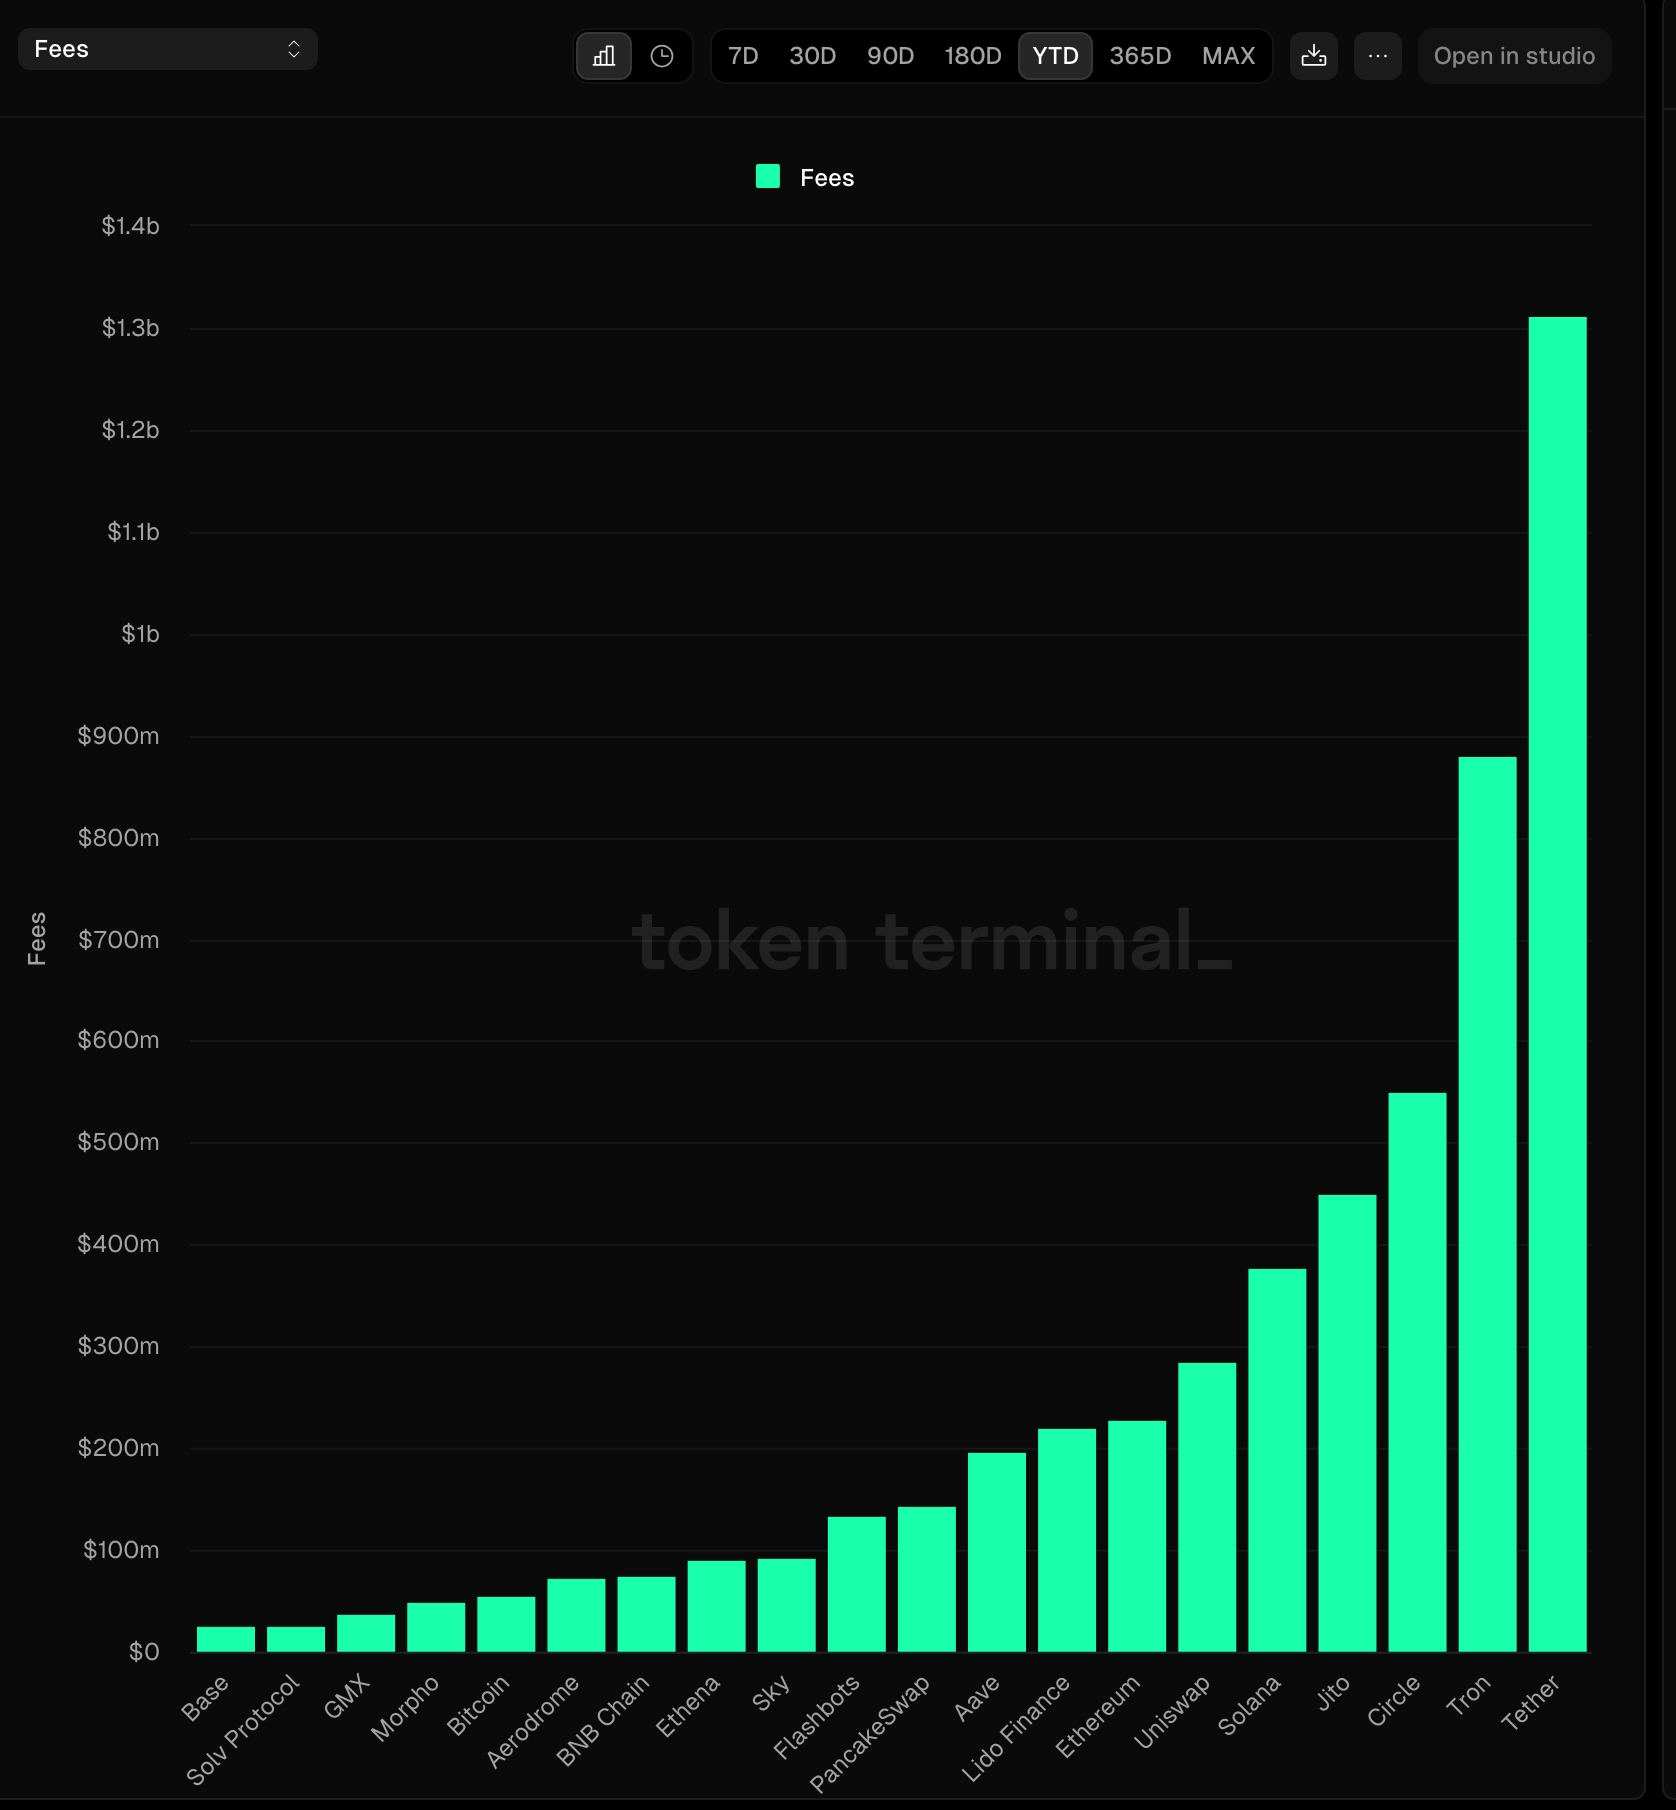
For quite some time, Ethereum was the most lucrative chain in the cryptocurrency space, leading various sectors such as DeFi, gaming, non-fungible tokens, stablecoins, and real-world asset tokenization. However, this scenario has shifted this year, with Ethereum being overtaken by other prominent chains.
The following chart highlights that Ethereum has generated only $227 million in fees this year. In comparison, Tether has amassed $1.3 billion, Solana $376 million, and Tron $880 million, largely driven by their stablecoin activities. Additionally, platforms like Jito and Uniswap have outperformed Ethereum in total fee generation.
Decline in development activity
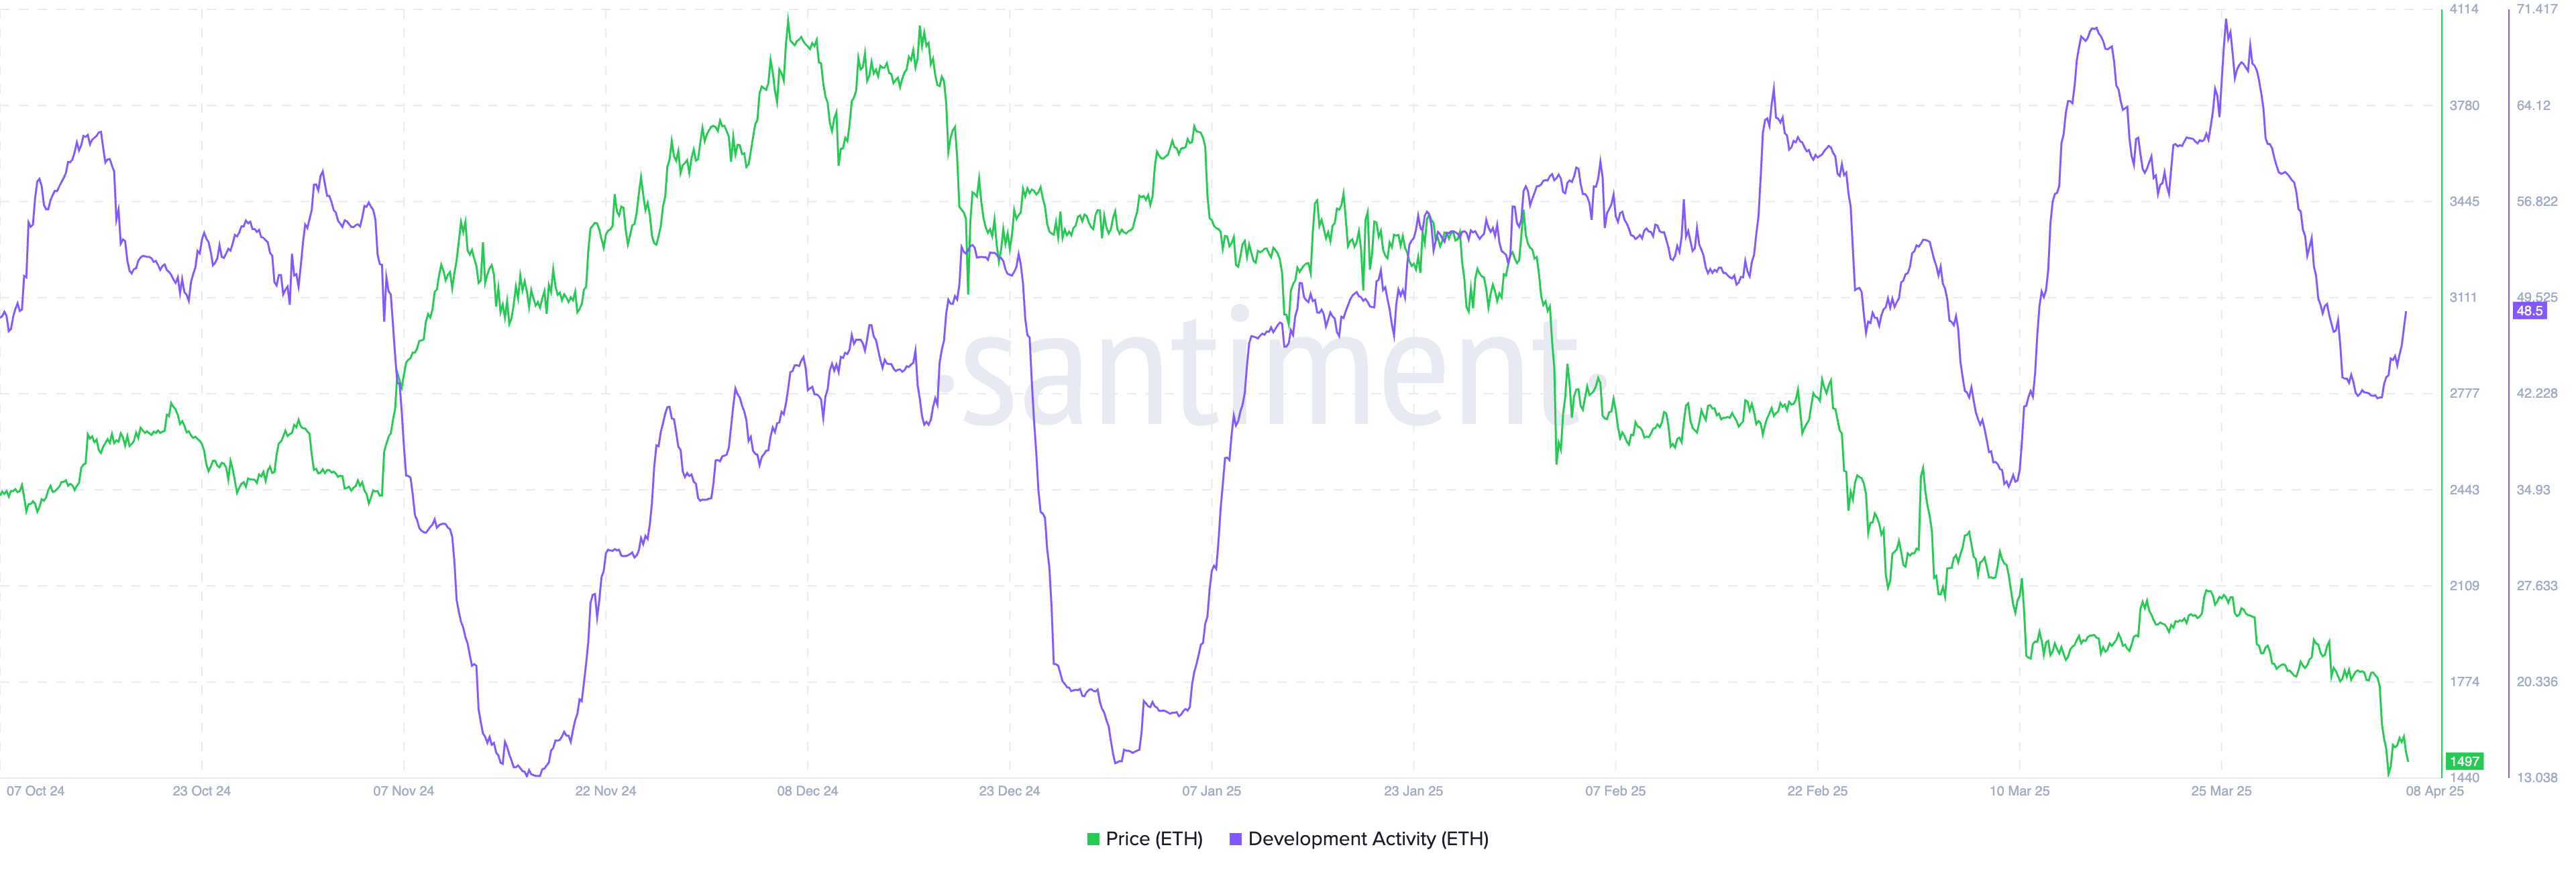
On-chain analytics also reveal a decrease in developer activity on Ethereum in recent months. This decline may be attributed to developers moving to other rapidly growing chains like Solana, Sonic, and Berachain. Many are also focusing on Ethereum’s layer-2 solutions such as Base, Arbitrum, and Optimism, which provide enhanced speed and lower transaction fees.
Ethereum price has formed a bearish triple-top
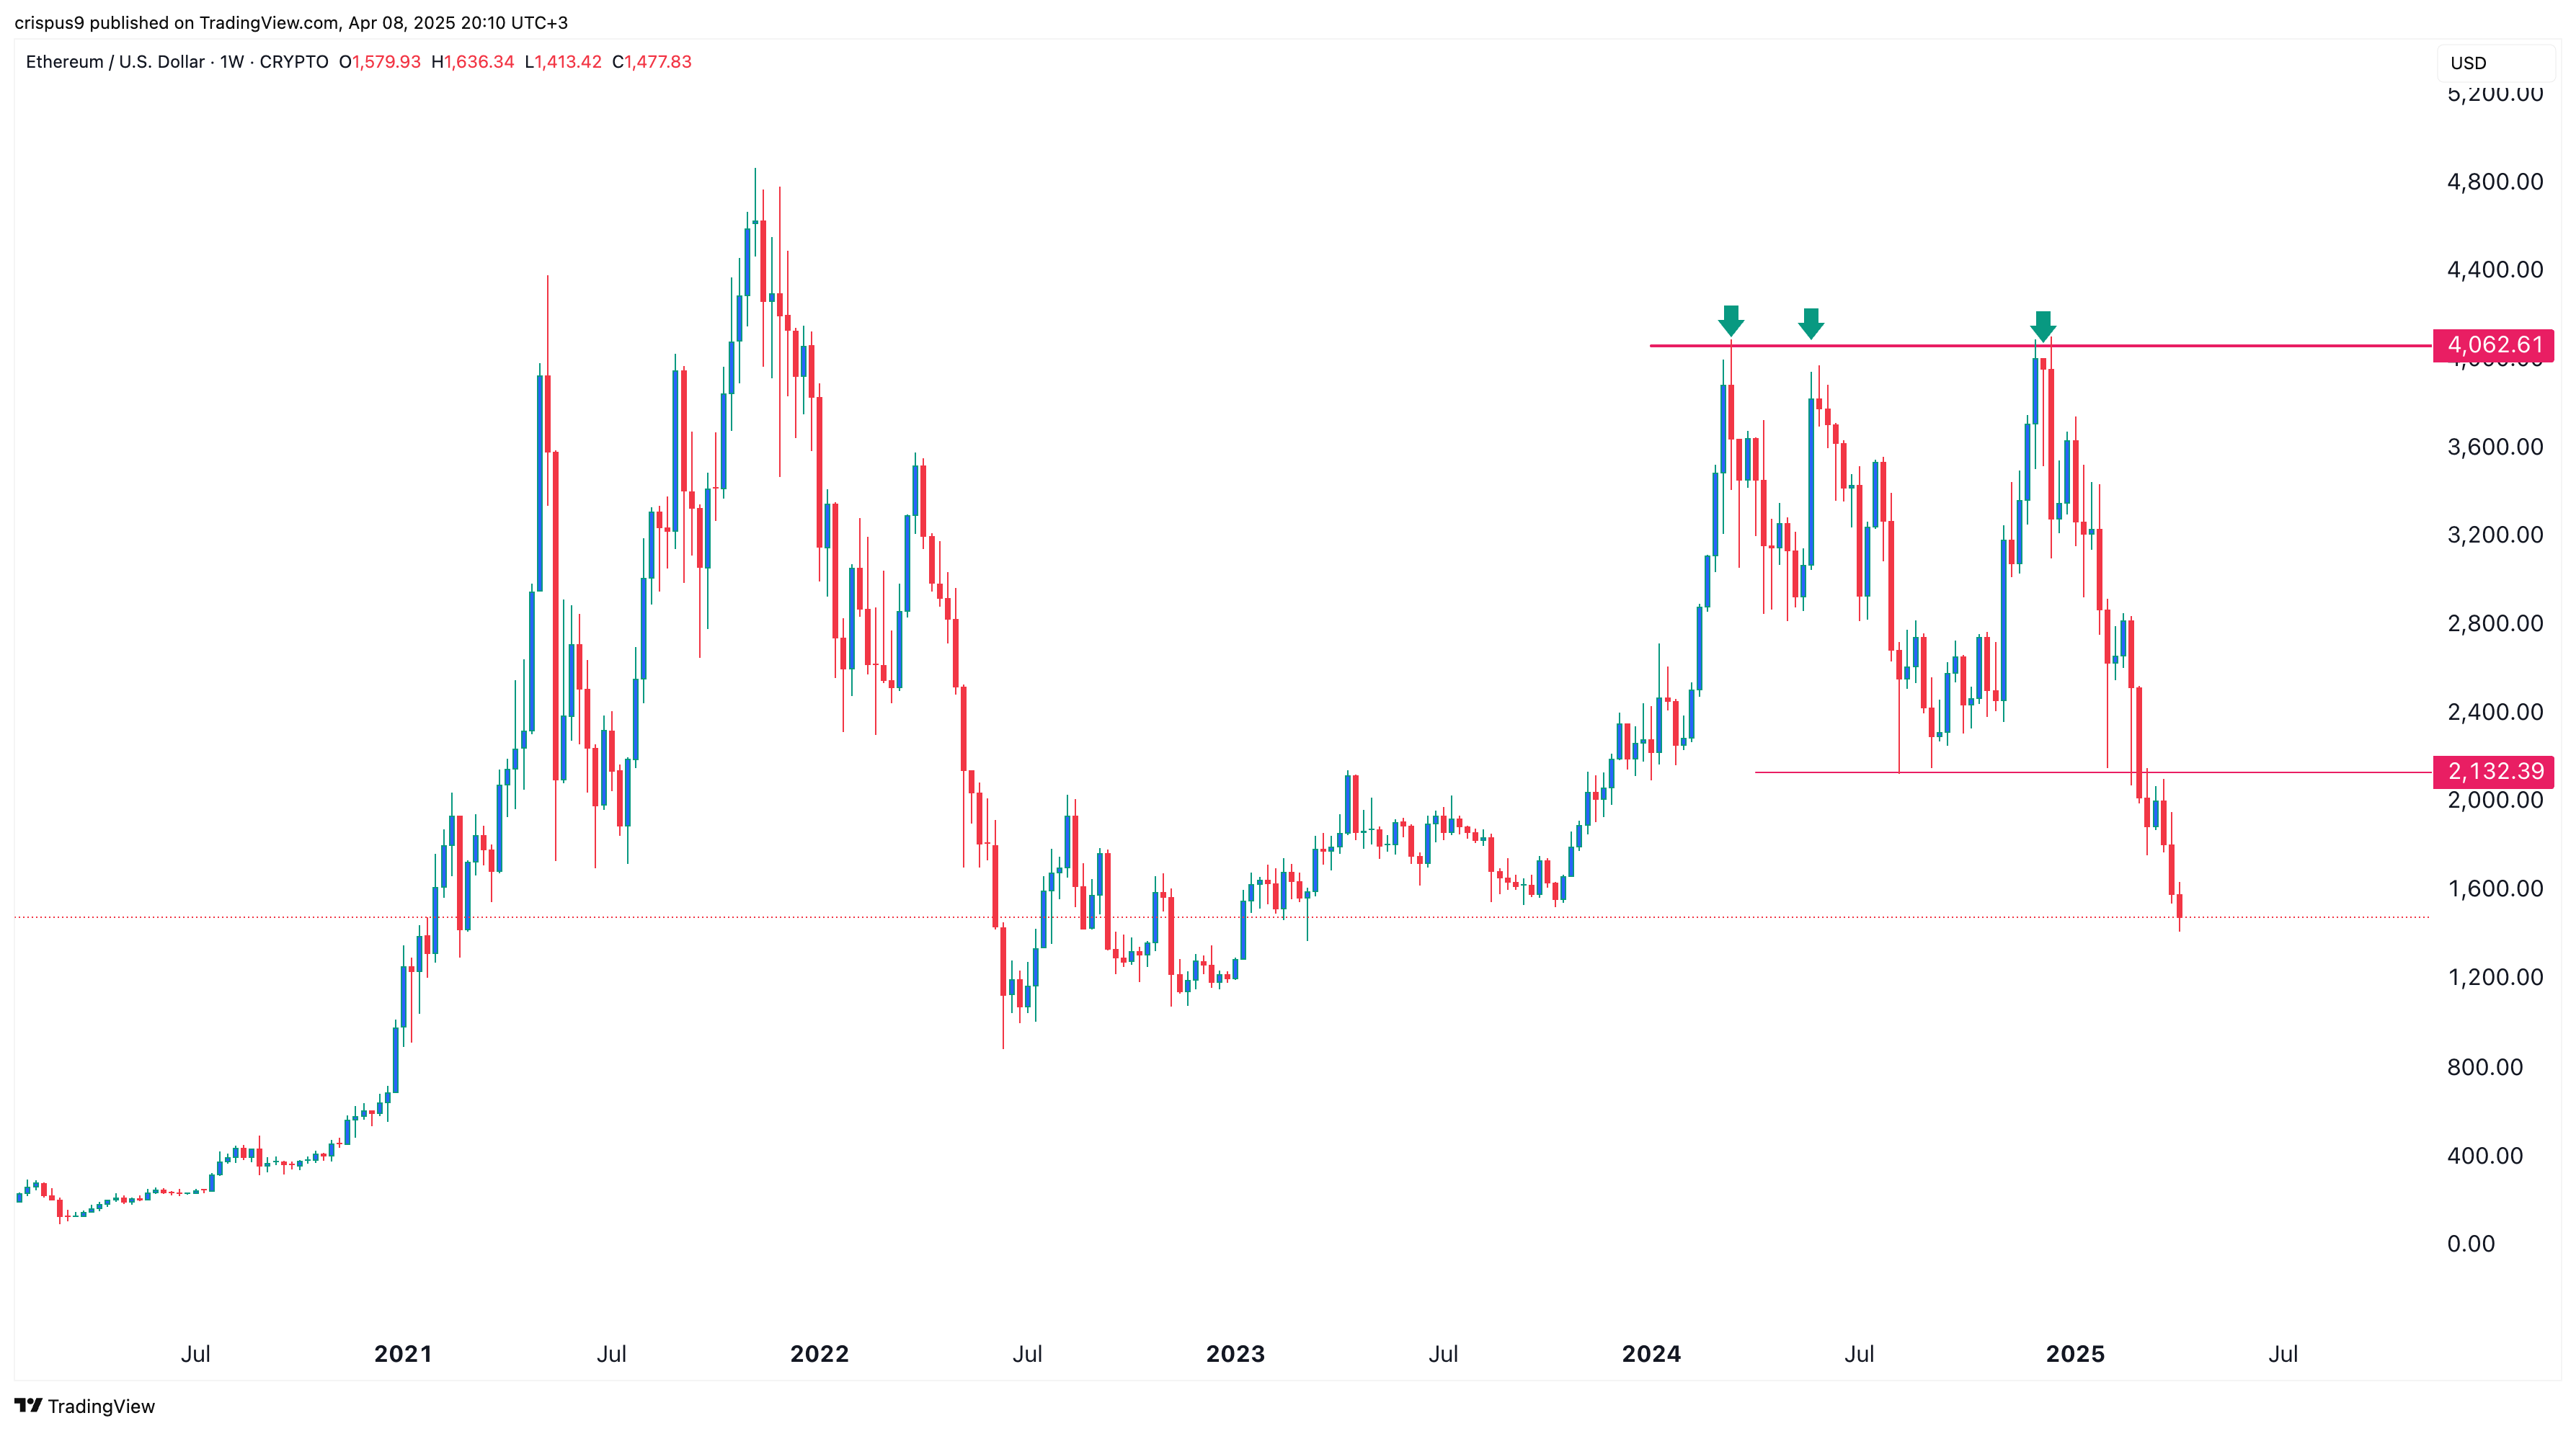
From a technical standpoint, Ethereum has experienced a sharp decline following the formation of a bearish triple-top pattern on the weekly chart. This pattern consists of three peaks around $4,062, with a neckline at $2,132 — a significant support level that was last tested on August 5.
ETH has now fallen below this neckline, validating the bearish signal. It has also dropped beneath both the 50-week and 100-week moving averages, suggesting that the next possible downside target could be $1,000.
Conclusion
Ethereum has seen a notable drop in 2025, reducing a $10,000 investment made in November to just $3,650. Weak underlying fundamentals and unfavorable technical indicators indicate that further declines may occur in the months ahead.