The price of Bitcoin (BTC) has seen a decline of 5.6% over the last week, closing three consecutive daily candles below the $80,000 support level for the first time since November 9, 2024.
Recent data indicates that Bitcoin has experienced a significant 64% surge in futures volume within the same timeframe. This marks a shift from the previous month, during which futures volume had been steadily declining.
An increase in futures volume typically suggests greater market activity; however, a closer examination of the overall futures market unveils a more intricate scenario. Bitcoin’s open interest (OI), reflecting the total value of active futures contracts, has dropped by 19% over the past two weeks.
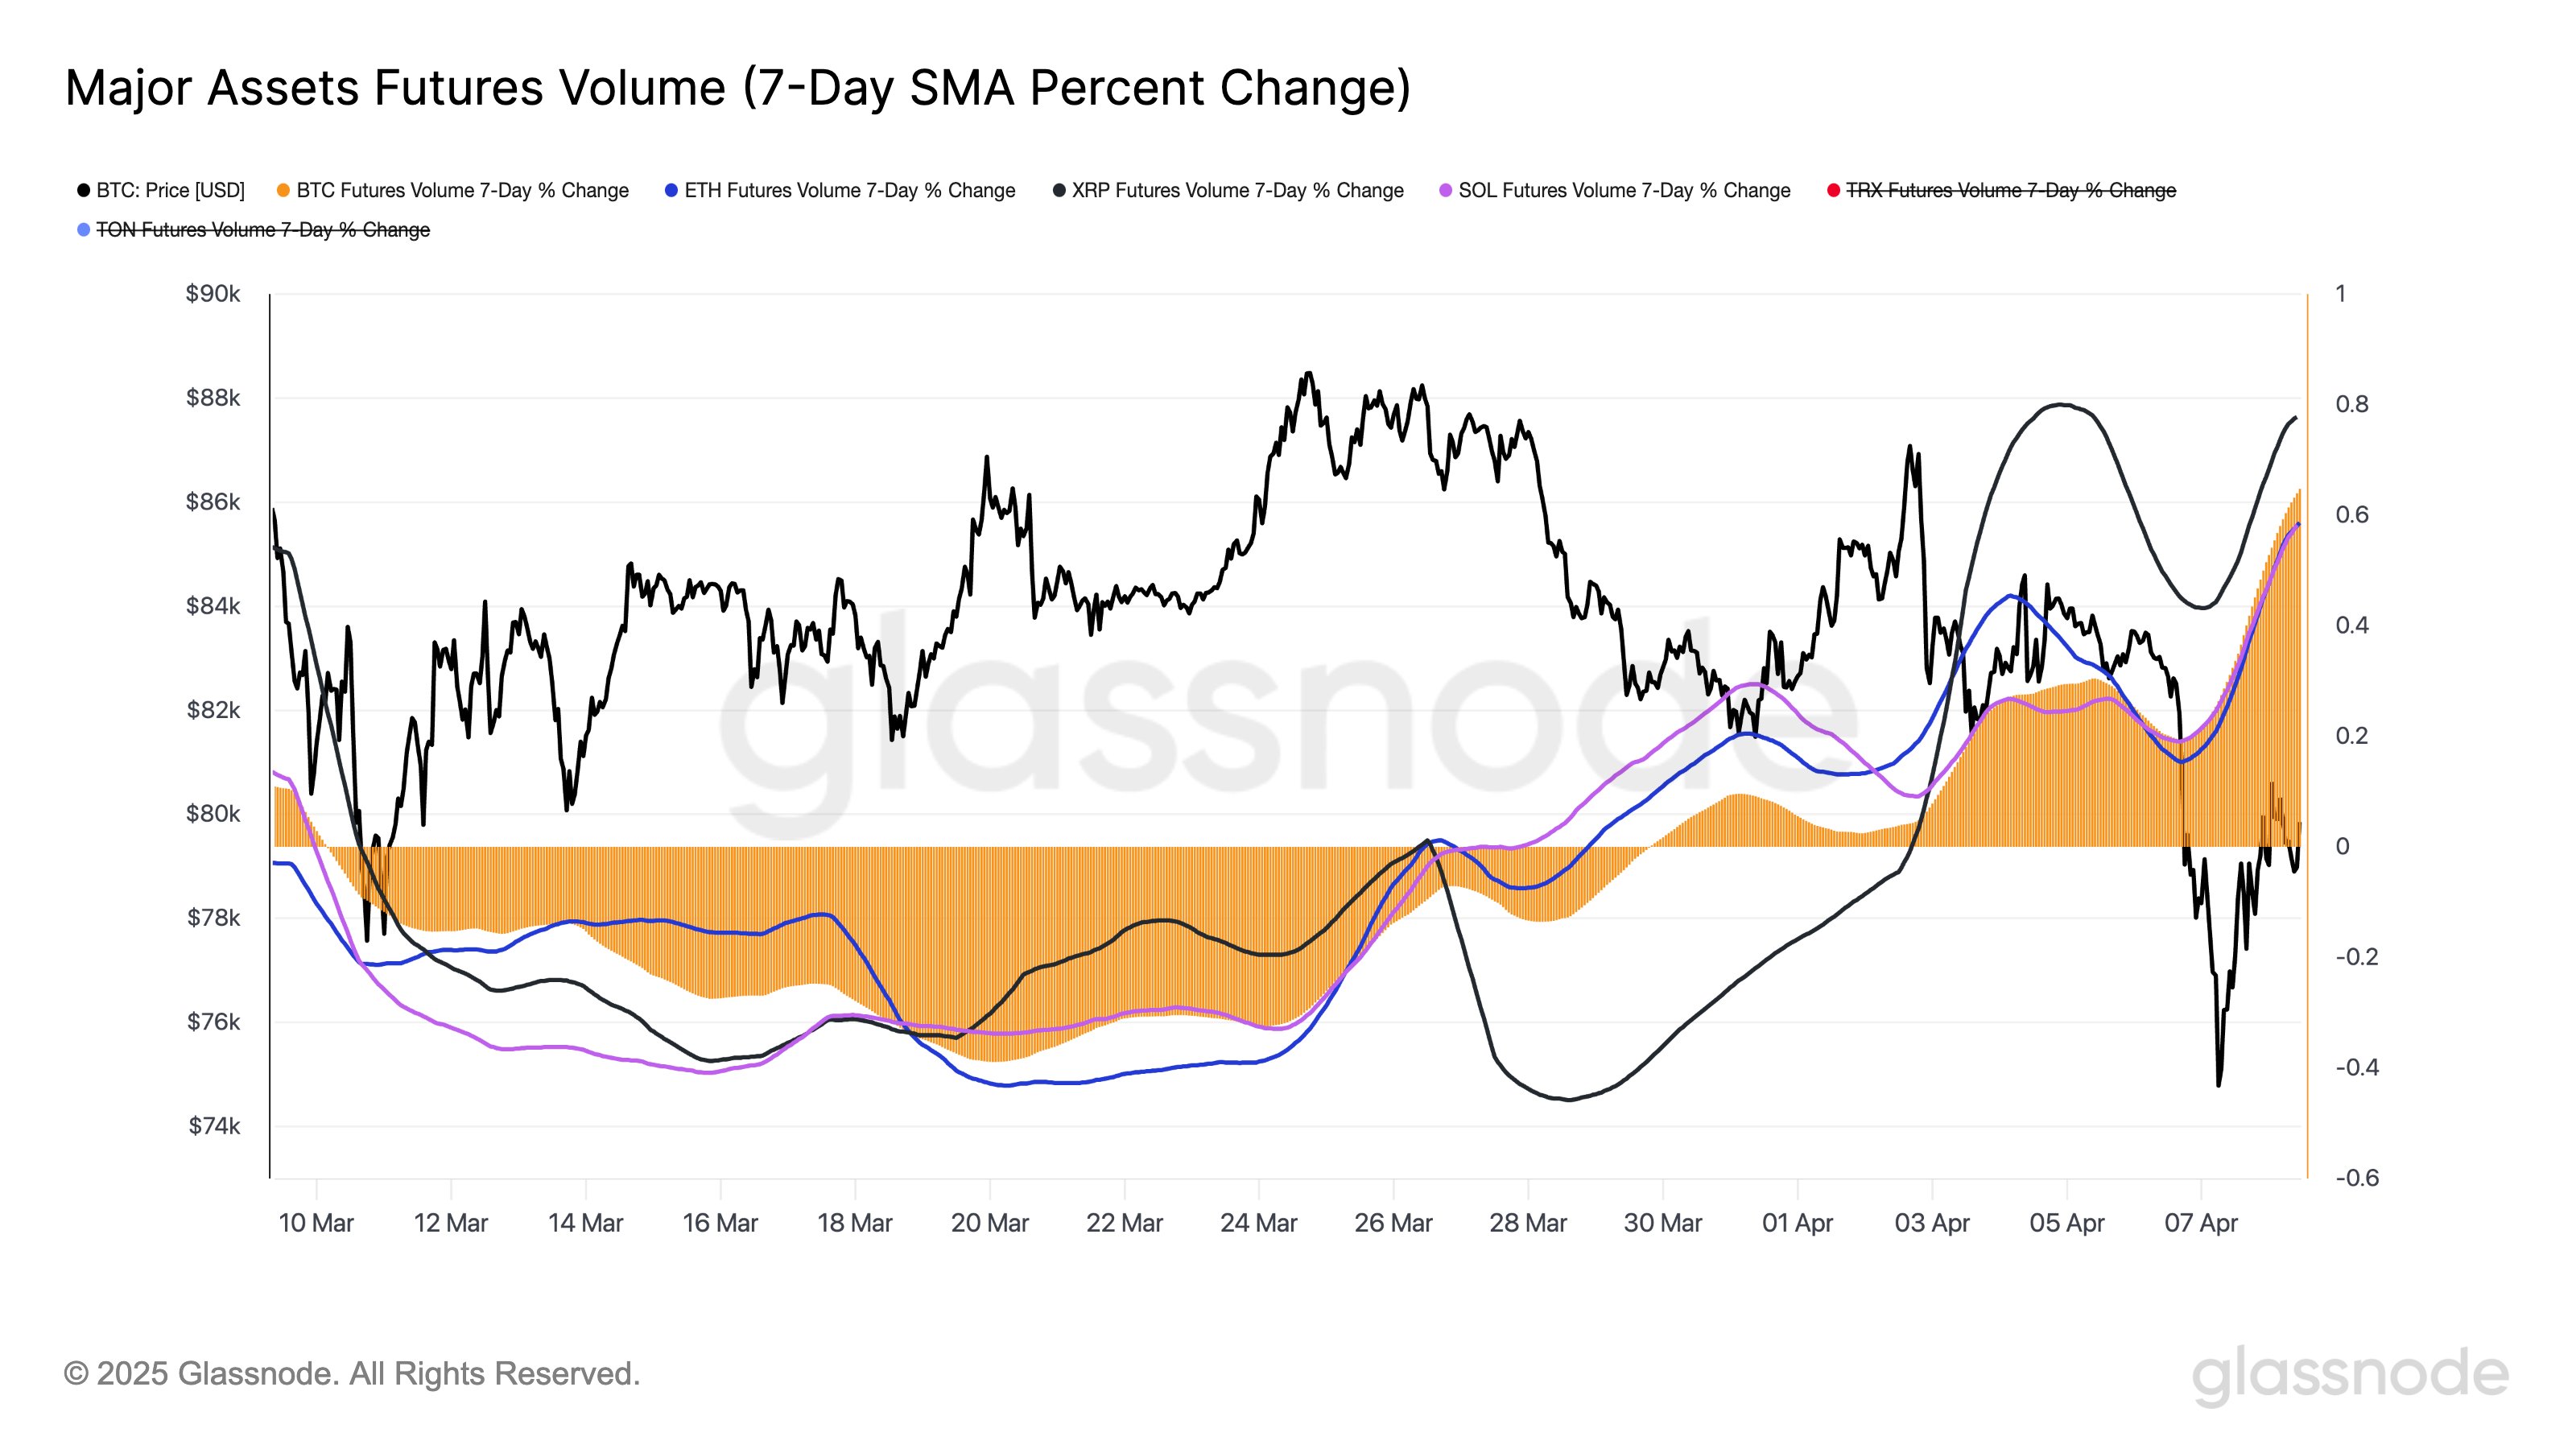
Chart illustrating Bitcoin futures volume. Source: X.com
This decline implies that, although trading volume is on the rise, some traders are opting to close their positions rather than maintain them, possibly to secure profits or reduce risk in light of Bitcoin’s bearish market conditions.
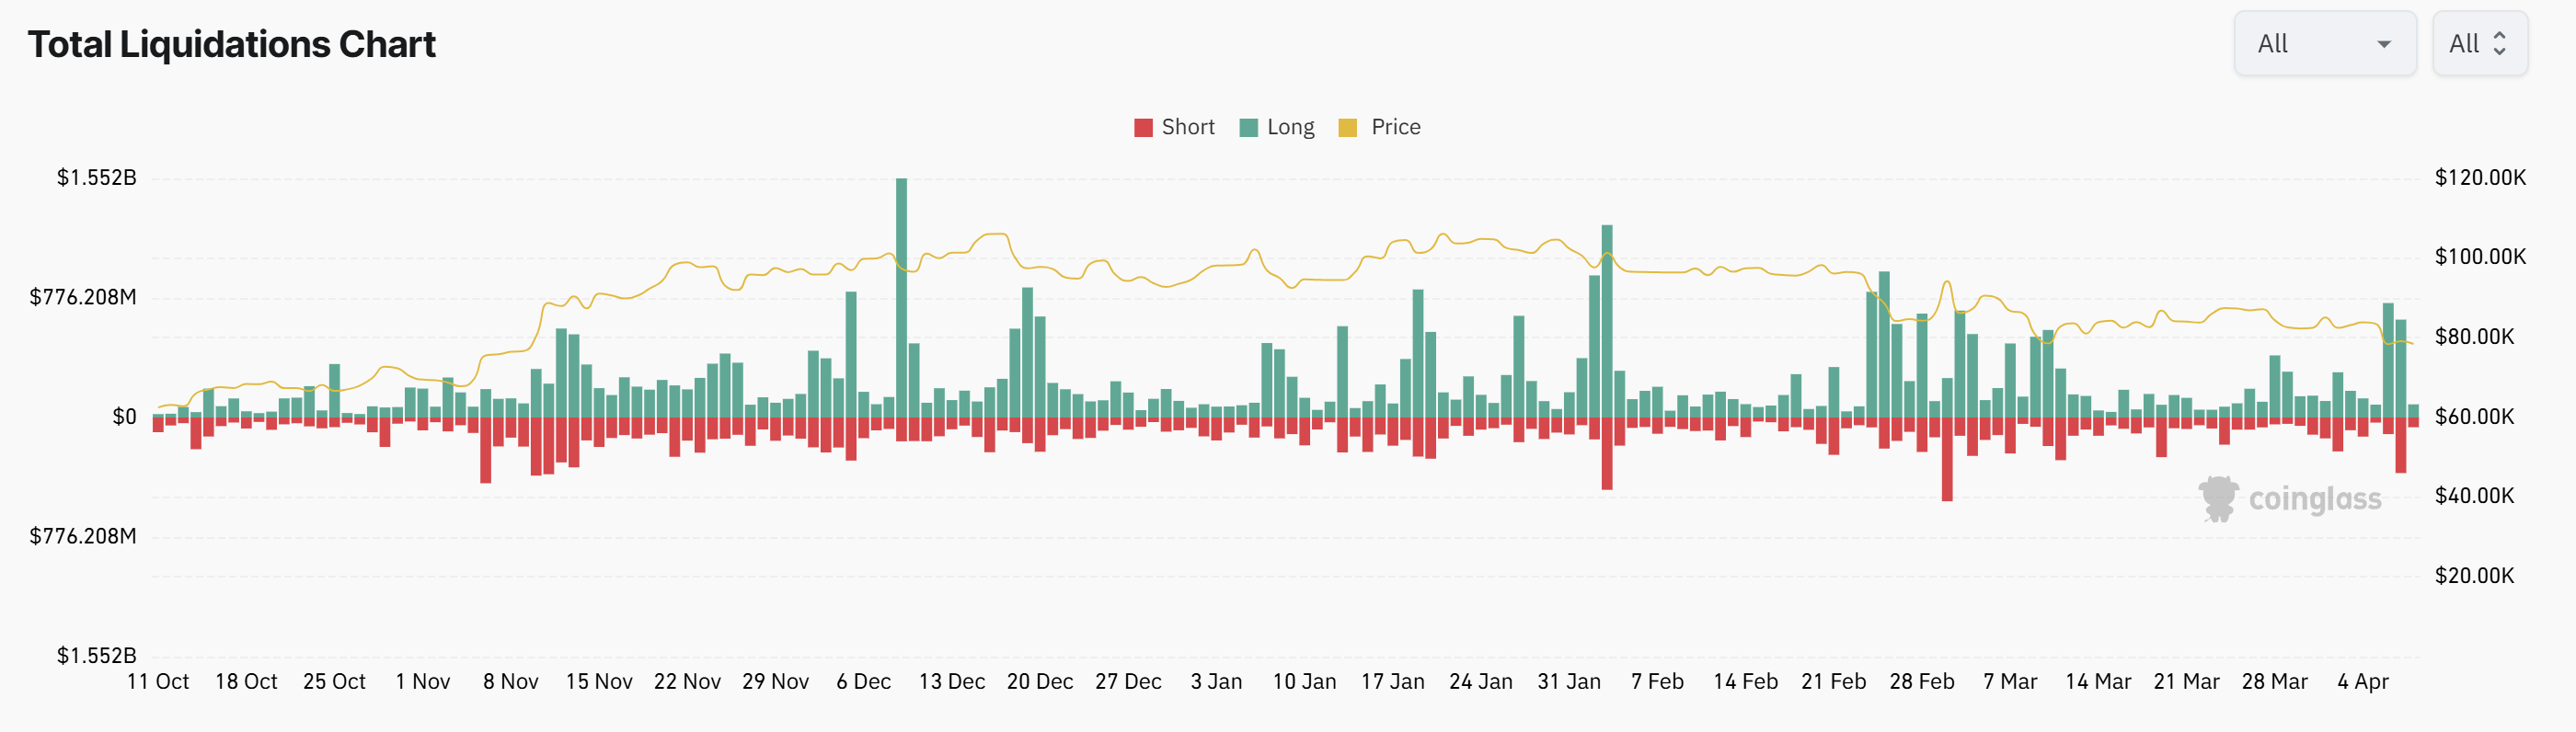
Chart depicting total market liquidations. Source: CoinGlass
During the period from April 6 to April 8, total cryptocurrency liquidations reached $2 billion, further indicating that traders are likely adopting a more cautious stance.
When we consider this data as a whole, it seems that Bitcoin could be undergoing a transitional phase. The uptick in futures volume suggests a growing interest and speculative engagement, possibly hinting at the conclusion of a correction phase and the onset of an accumulation period. However, the drop in open interest indicates a risk-averse strategy, with traders minimizing their exposure due to ongoing macroeconomic uncertainties.
If the Bitcoin price does not rebound while futures volume and open interest are converging, it could indicate the start of a bear market. Conversely, if Bitcoin’s price rises alongside increases in OI and trading volume, this would suggest the beginning of an accumulation phase, with the potential for a subsequent uptrend.
Related: Bitcoin nearing the largest ‘price drawdown’ of the bull market — Analyst
Minimal outflows from Spot Bitcoin ETFs
Major US equities have recently seen a decline of over 20% from their all-time highs, and the S&P 500 has lost a year’s worth of growth in just over a month. Although traditional institutions may have experienced substantial unrealized losses in the last two weeks, the data on spot Bitcoin ETF outflows does not yet reflect a state of market panic.
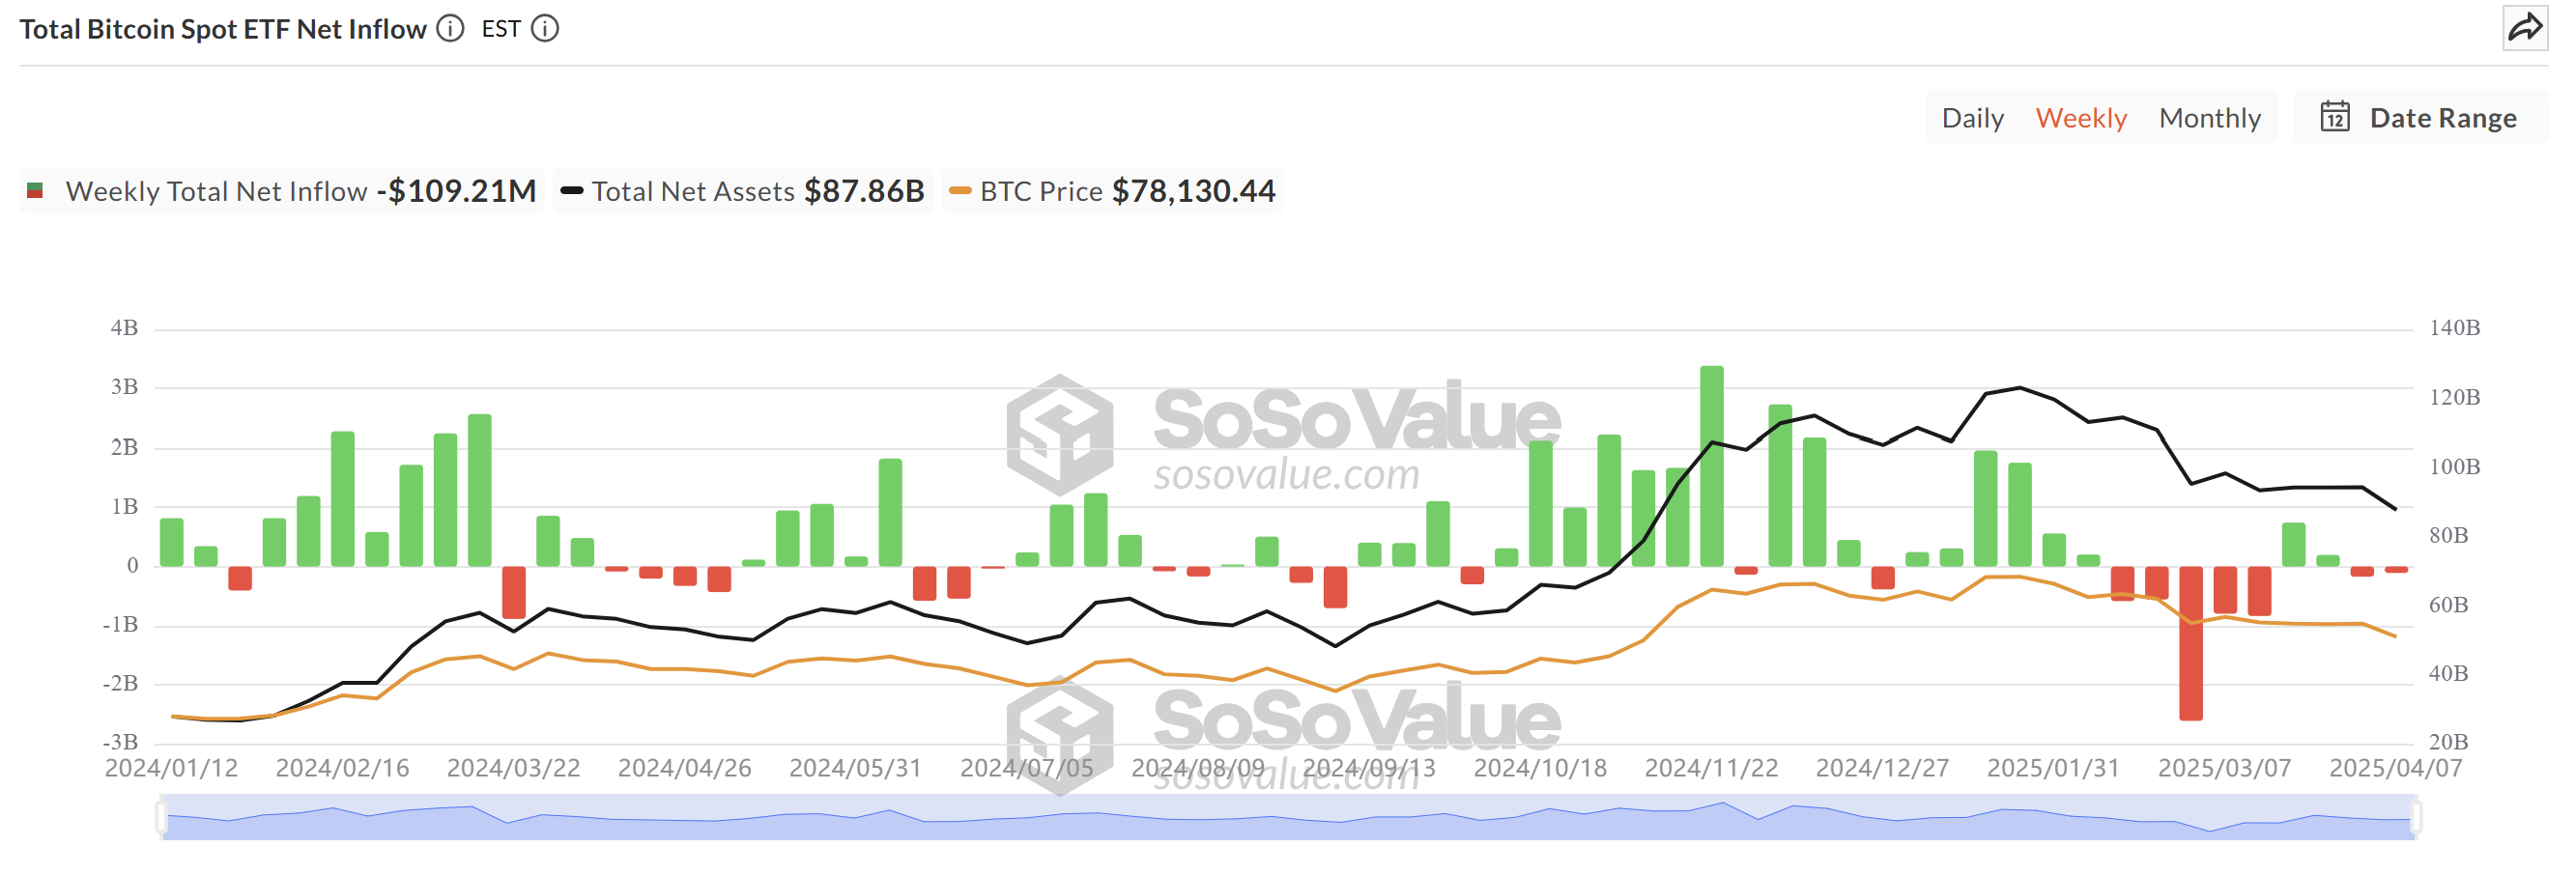
Chart showing total spot BTC ETF flows. Source: Sosovalue
In the past two weeks, total outflows from spot Bitcoin ETFs have totaled just under $300 million. This divergence indicates a certain resilience among Bitcoin’s institutional investor base.
In contrast to the more substantial selling seen in equity markets, the limited withdrawals from spot BTC ETFs suggest that institutional investors have not succumbed to panic, potentially viewing Bitcoin as a protective asset or maintaining their long-term belief in its value amid traditional market volatility.
Related: Bitcoin’s 24/7 liquidity: Double-edged sword during global market turmoil
This article does not provide investment advice or recommendations. Every investment and trading decision carries risk, and readers are encouraged to conduct their own research before making choices.