Bitcoin (BTC) has a new target of $70,000 for a reversal as a prominent indicator reaches new lows typical of a bull market.
In a recent analysis, a well-known trader and analyst predicted that BTC/USD might find support near the previous all-time highs from 2021.
Historical Patterns Indicate $70,000 Could Mark the End of the BTC Price Decline
According to the analyst, Bitcoin could drop to $70,000 before bouncing back while still remaining within historical trends.
To assess where this bull market correction might conclude, the analyst used the relative strength index (RSI) to estimate potential downside for BTC’s price.
“Historically, when Bitcoin’s Daily RSI plummeted below the 28 level, it hasn’t necessarily marked the price floor. In fact, the actual price bottom tends to be -0.32% to -8.44% lower than when the RSI first hit its lowest point,” they explained.
“Bitcoin is currently establishing its second low at -2.79% beneath the first. If it were to repeat a -8.44% drop from the initial low, we could see a price bottom around ~$70,000.”
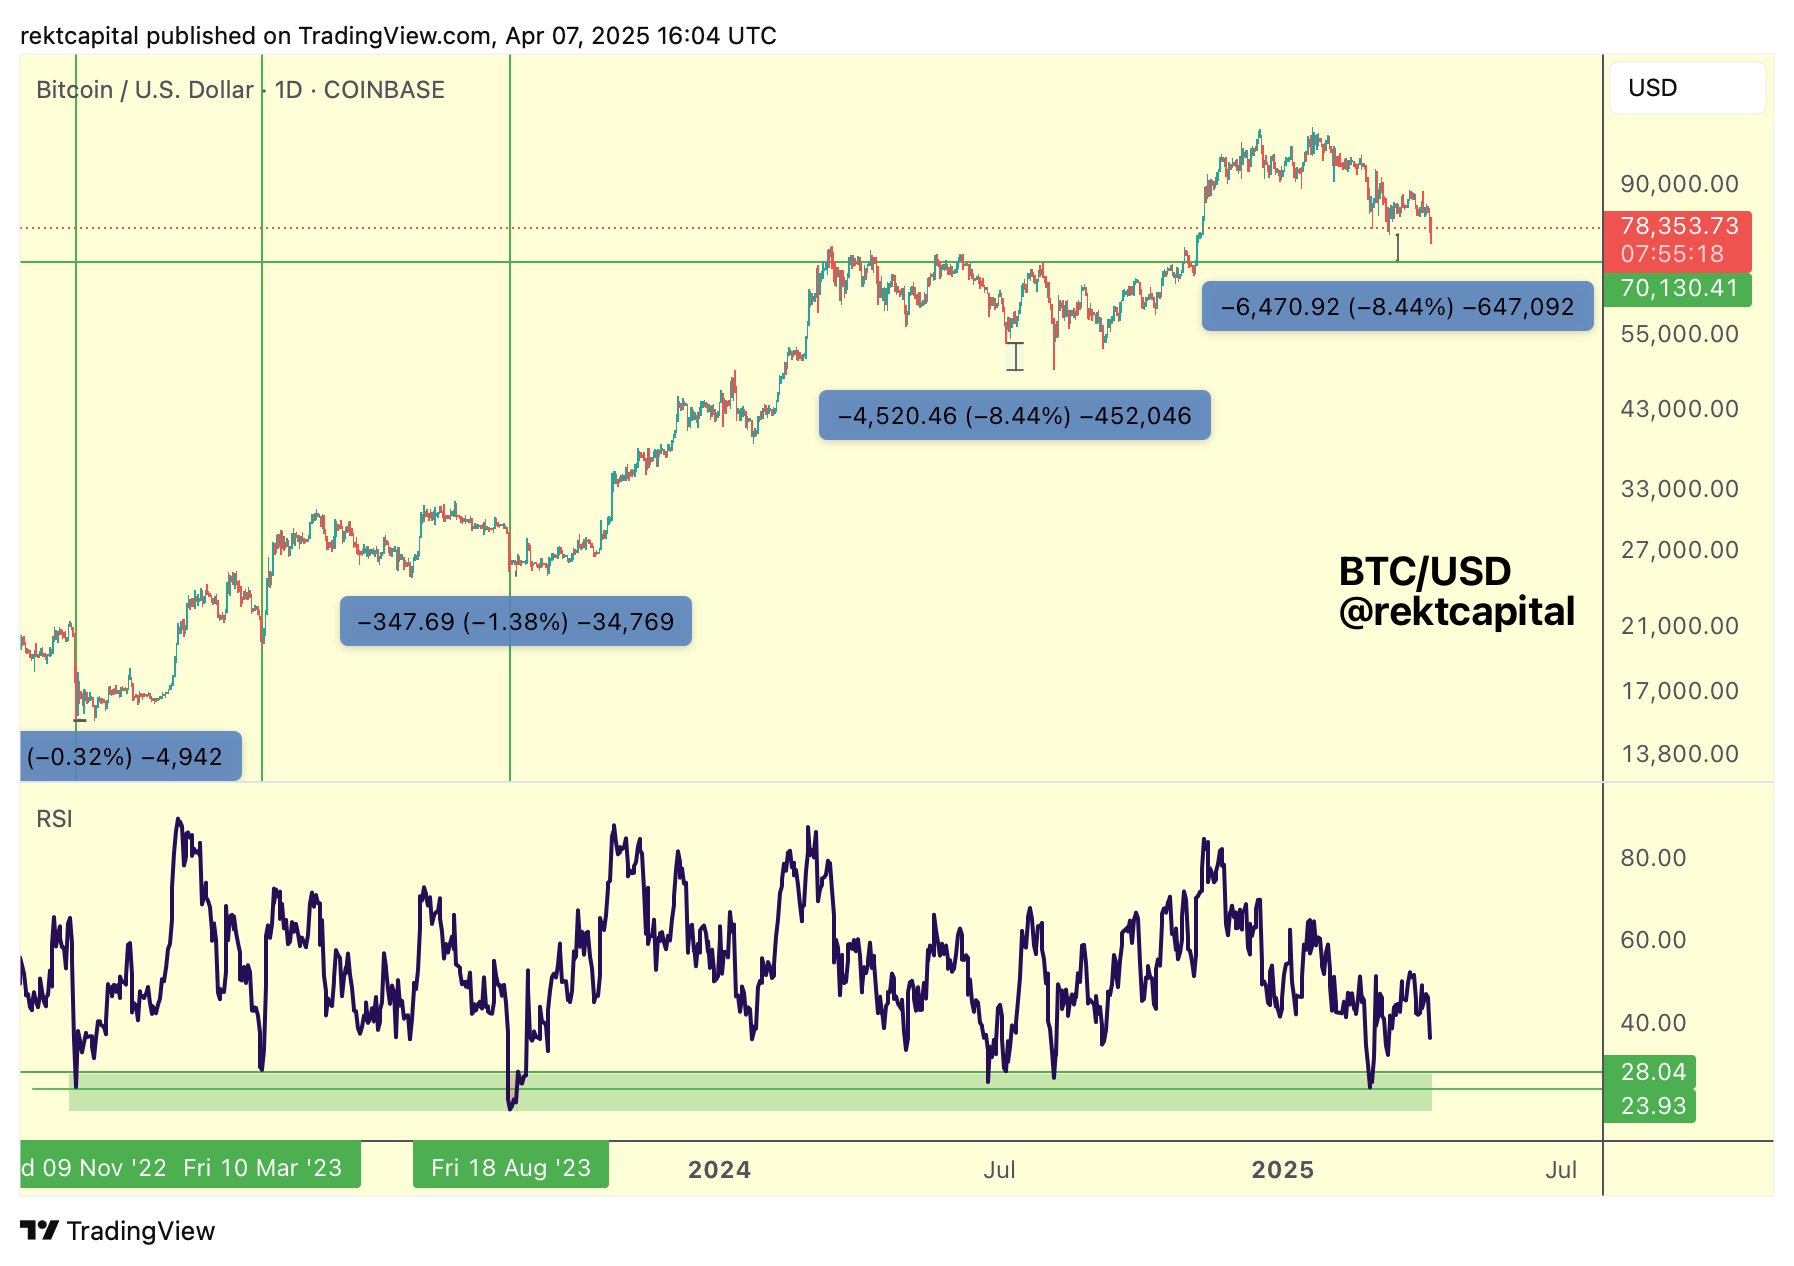
BTC/USD 1-day chart showcasing RSI data.
The RSI is a classic leading indicator, generating signals that frequently precede significant shifts in BTC pricing trends. Regardless of the timeframe analyzed, the key levels of 30, 50, and 70 are particularly crucial. An RSI reading below 30 indicates “oversold” conditions, while a score above 70 signifies the “overbought” territory.
Currently, the daily RSI stands at approximately 38, having failed to maintain a position at 50. The weekly chart shows an RSI at 43, marking its lowest point since the onset of the bull market in early 2023, according to data from various market tracking sources.
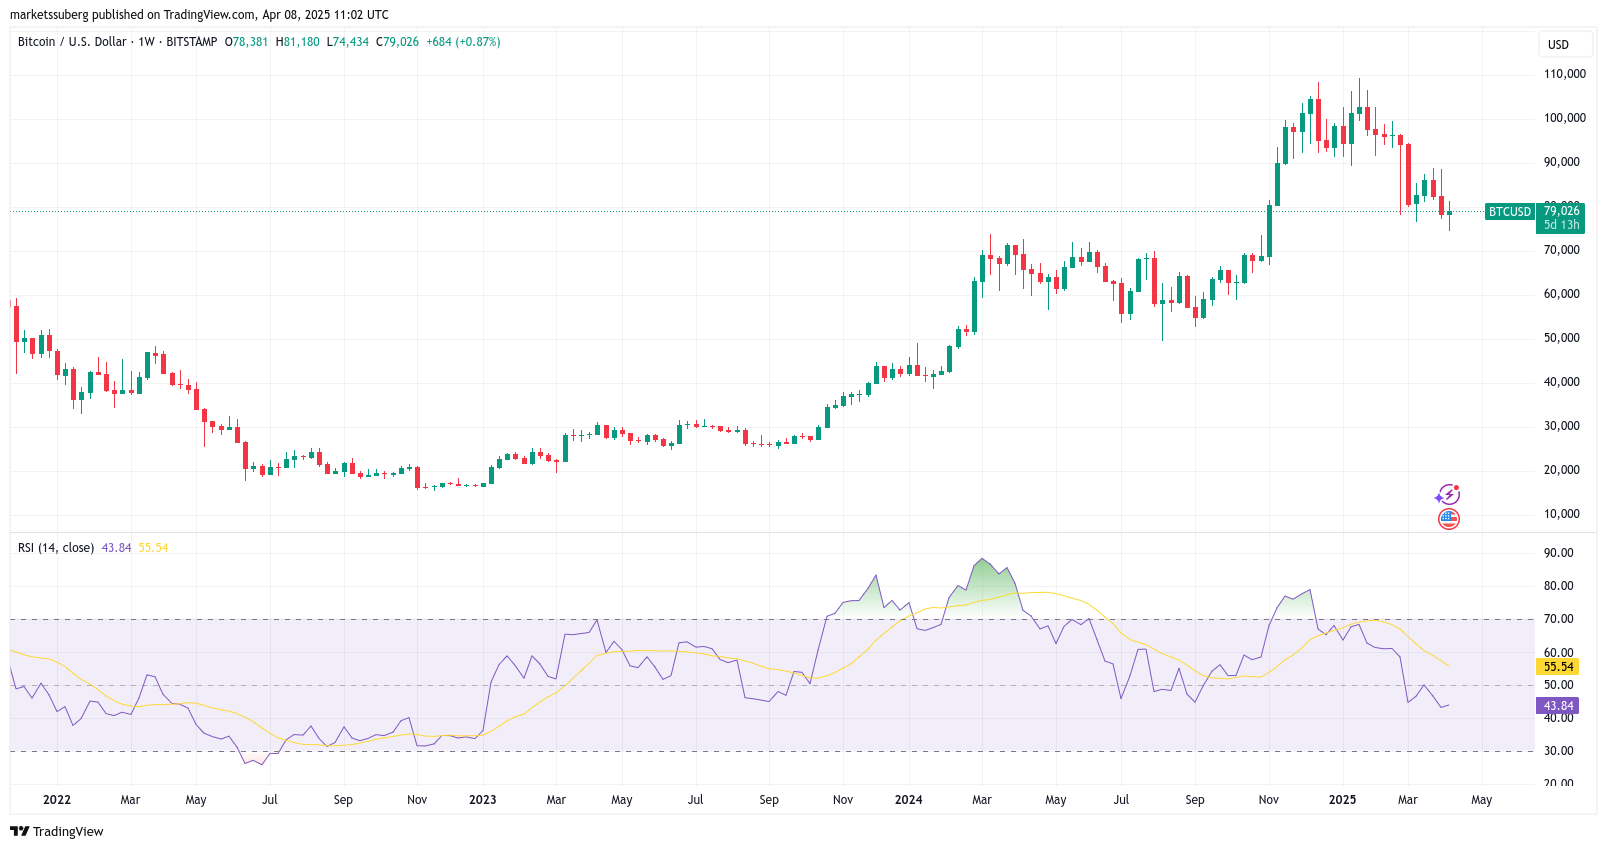
BTC/USD 1-week chart illustrating RSI data.
The analyst noted that Bitcoin doesn’t necessarily need to reach $70,000 for a long-term bottom to establish.
“In fact, the Daily RSI trends observed historically in this cycle suggest that the price range from current levels to around $70,000 is likely where we could see a bottom during this correction,” they added.
BTC/USD was last seen at $70,000 in early November 2024, a price point that aligns with the all-time high from Bitcoin’s last bull market, which concluded three years earlier.
Current Macro Trends Pose Challenges for Bitcoin
It has been suggested that $70,000 is a common target for the ongoing correction, with metrics like the Lowest Price Forward indicating a strong likelihood that this level will serve as support.
Related: Is a Repeat of Black Monday on the Horizon? Key Insights on Bitcoin This Week
However, the creator of these metrics remains pessimistic regarding the short-term outlook for BTC prices.
Recent US macroeconomic conditions, he cautioned this week, could “easily” push BTC/USD down to the $70,000 level.
“This is seriously detrimental for Bitcoin,” he remarked alongside a chart depicting the ICE BofA US High Yield.
This article does not constitute investment advice or recommendations. All investment and trading activities carry risks, and readers should perform their own due diligence before making financial decisions.