- Cardano’s price remains around $0.56 on Wednesday after experiencing a 13% drop in the prior week.
- Data from Token Terminal reveals that ADA’s fee collection has been consistently declining throughout 2025.
- The technical analysis and on-chain indicators imply a potential correction as there is a rise in activity from dormant wallets.
On Wednesday, Cardano (ADA) is priced around $0.56 following a 13% decline from the previous week. According to data from Token Terminal, ADA’s fee collection has been on a steady downward trend in 2025, reflecting reduced blockchain activity and usage. The technical indicators along with on-chain data suggest a correction may be underway as the activity of dormant wallets increases.
Rising dormant wallet activity indicates negative netflow for Cardano
The Age Consumed index from Santiment hints at a bearish outlook for Cardano. Increases in this index indicate that dormant tokens (those held in wallets for extended periods) are being mobilized, which can signal short-term local price peaks or troughs.
For ADA, historical trends show that such spikes have often preceded a decrease in price as holders transfer their tokens from wallets to exchanges, thus amplifying selling pressure.
The latest uptick recorded on Monday was the highest since mid-January and also suggested that ADA was poised for a downward trajectory.
ADA Age Consumed chart.
Coinglass’ analysis of ADA’s spot netflow paints a similarly bleak picture. Data shows that netflows for ADA have been persistently negative since mid-March, reporting $21.08 million in outflows this week.
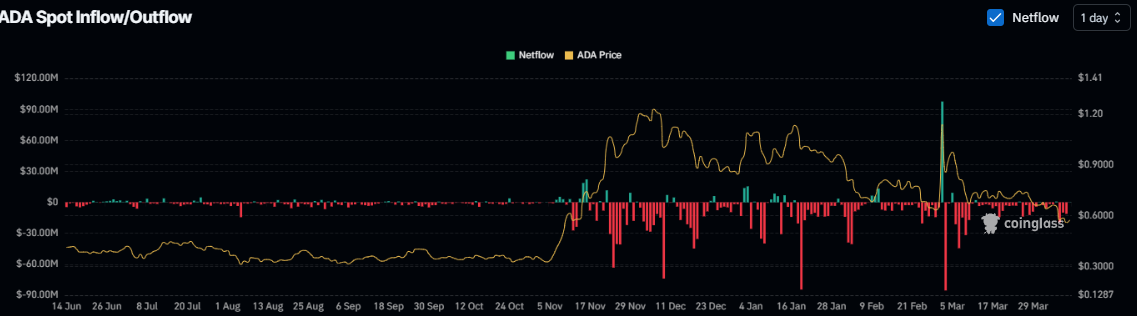
ADA Spot Inflow/outflow chart.
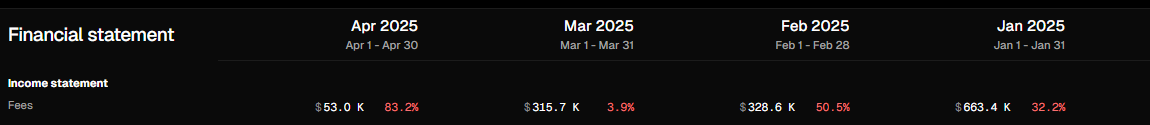
ADA fee generation chart.
Technical Analysis for Cardano: Bears target $0.50 level
Cardano’s weekly chart shows that ADA has experienced a decline that has taken it below the 61.8% Fibonacci retracement level (calculated from the low of $0.27 on August 5 to the high of $1.32 on December 3) at $0.67, leading to a 13.23% loss last week. On Friday, it retraced back to the February 28 low of $0.58. This week, ADA saw a slight rebound after hitting support around $0.51 on Monday. As of Wednesday, it remains around $0.56.
If ADA’s downward trend continues, it might test the year-to-date low of $0.50 established on February 3.
The Relative Strength Index (RSI) on the weekly chart currently reads 44 and indicates bearish momentum.
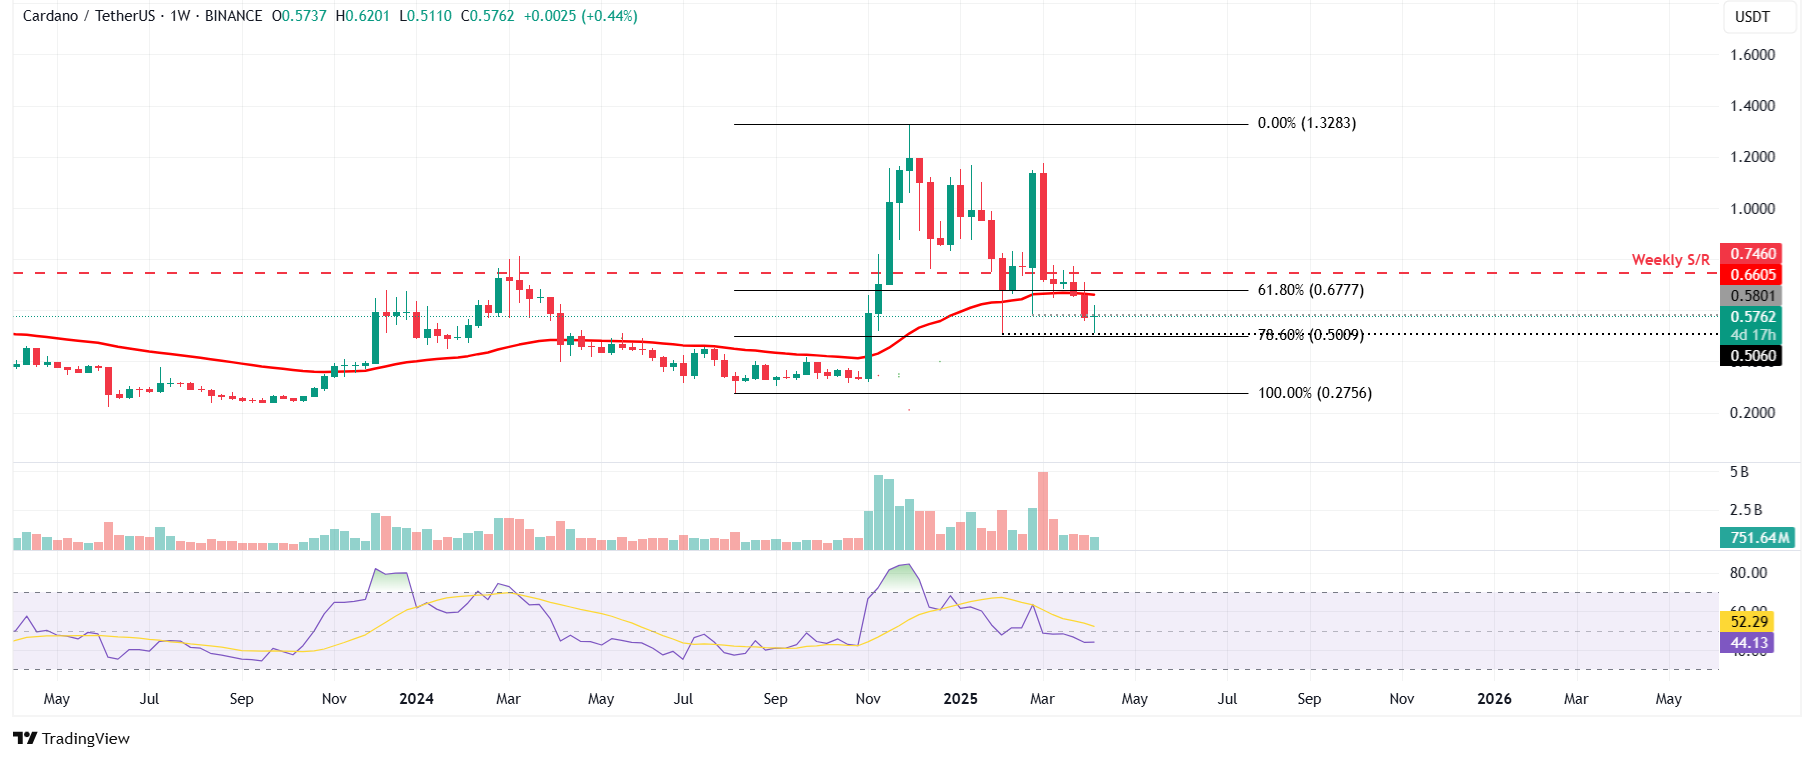
ADA/USDT weekly chart.
However, should ADA see a recovery, it could aim to retest the 50-week Exponential Moving Average (EMA) at $0.66.