- Bitcoin’s value stands at approximately $76,200 on Wednesday after experiencing a decrease of 3.59% the previous day.
- Ethereum continues to show weakness, dropping below the $1,400 mark.
- XRP falls beneath its support level of $1.96, suggesting a potential correction is on the horizon.
Bitcoin (BTC) is currently trading at around $76,200 on Wednesday, following a 3.59% decline the day before. Ethereum (ETH) and Ripple (XRP) mirrored BTC’s trajectory, maintaining their downward momentum. The technical indicators point towards a potential correction, with targets set at $73,000 for BTC, $1,300 for ETH, and $1.30 for XRP.
Bears in Bitcoin gain strength, eyeing the $73,000 level
Bitcoin faced resistance at $85,000 on April 2 and experienced a drop of 10.55% leading up to Tuesday, reaching a yearly low of $74,508 on Monday. As of Wednesday, it remains around $76,000.
If BTC continues its downward trend, it may further decline to test the next daily support level at $73,072.
The Relative Strength Index (RSI) on the daily chart is hovering at 33, indicating significant bearish momentum and reinforcing a negative outlook.
BTC/USDT daily chart
If BTC manages to recover and surpass its daily resistance at $85,000, it could trigger a rally toward the key psychological level of $90,000.
Ethereum’s downward trend persists, targeting the $1,300 mark
Ethereum’s price fell nearly 13% last week after it failed to close above the daily level of $1,861. This week has seen a continuation of this downtrend, with a nearly 7% drop up until Tuesday. At the time of writing on Wednesday, ETH is trading below its daily support of $1,449, marking levels not seen since October 2023.
If ETH closes below its daily support level of $1,449, it might extend its decline and retest the significant psychological level of $1,300.
The RSI currently reads 23, below the oversold threshold of 30, suggesting that Ethereum may be undervalued and could be primed for a rebound. However, the RSI could also stay below this level, continuing its downward trend.
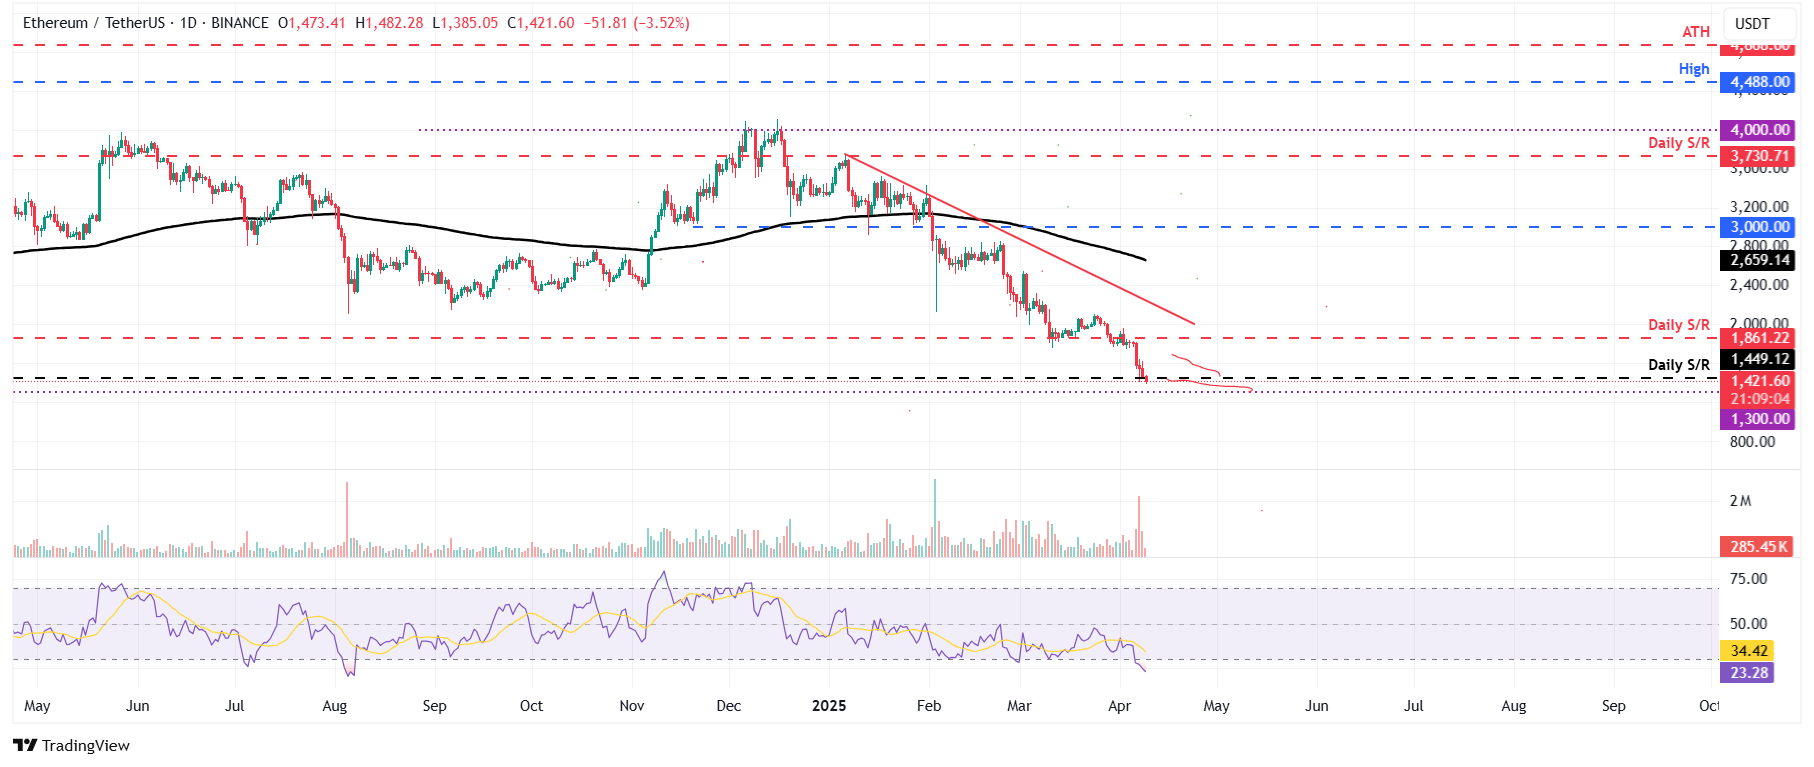
ETH/USDT daily chart
XRP bears target the $1.30 level
XRP’s price faced resistance at the 200-day Exponential Moving Average (EMA) of $1.94 on Monday and subsequently fell by 6.5% by the following day. Additionally, XRP hit a new yearly low of $1.61 earlier this week. As of Wednesday, it is trading around $1.77.
If XRP continues its downward movement and closes below the $1.77 level, it could further decline to revisit its new yearly low of $1.61. A successful close beneath this threshold would likely lead to a test of its weekly support level at $1.30.
The daily chart’s RSI currently stands at 30, nearing its oversold level of 30, which indicates strong bearish momentum and supports a negative outlook. If the RSI dips below the oversold level, XRP could be undervalued and ripe for a price recovery. However, the RSI may also remain below this threshold, manifesting a continued downward trend.
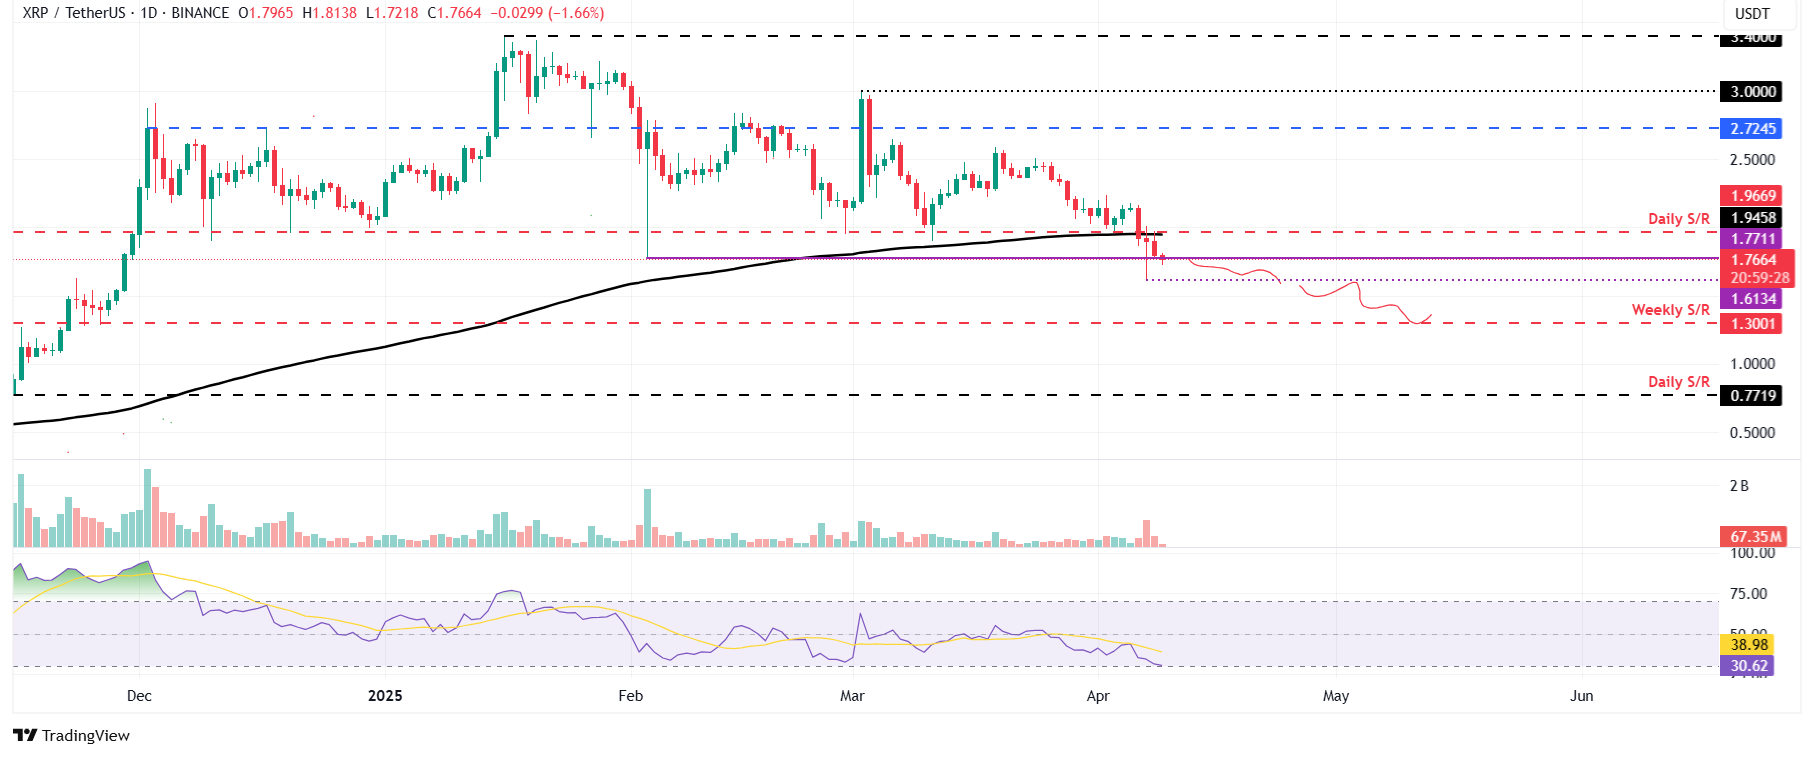
XRP/USDT daily chart
On the flip side, should XRP recover, it could potentially extend its rally to retest the daily level at $1.96.
Bitcoin, altcoins, stablecoins FAQs
Bitcoin is the dominant cryptocurrency by market capitalization, serving as a virtual currency intended for transactions. Its decentralized nature prevents any individual, group, or organization from controlling it, thus eliminating the need for third-party involvement in financial dealings.
Altcoins refer to any cryptocurrency other than Bitcoin; however, some consider Ethereum as not being an altcoin due to its foundational role in forking. In this case, Litecoin is seen as the first altcoin, having forked from Bitcoin’s protocol and thus considered a “superior” version.
Stablecoins are cryptocurrencies designed to maintain a consistent value, their worth being secured by a reserve of the asset they represent. To maintain this value, a particular stablecoin’s worth is linked to a commodity or financial instrument, such as the U.S. Dollar (USD), with its supply adjusted by algorithms or instances of demand. The primary purpose of stablecoins is to facilitate an entry/exit point for investors looking to trade cryptocurrencies. They also provide a value storage option since cryptocurrencies are generally volatile.
Bitcoin dominance quantifies Bitcoin’s market capitalization as a percentage of the total market capitalization of all cryptocurrencies combined. This metric offers clear insight into Bitcoin’s appeal among investors. Typically, high BTC dominance occurs prior to and during bullish phases, as investors gravitate toward stable and high market cap cryptocurrencies like Bitcoin. Conversely, a decrease in BTC dominance suggests that investors are reallocating their investments and profits into altcoins, pursuing greater returns, often resulting in substantial altcoin rallies.