Bitcoin (BTC) experienced a significant uptick following a statement from US President Donald Trump regarding a halt on tariffs for countries not engaging in retaliation. This announcement has rekindled bullish sentiment and sparked optimism for a possible climb toward the $100,000 threshold.
On April 9, BTC/USD rose by around 9%, recovering nearly all the losses it had faced earlier that week, and approached the $83,000 mark. This movement brought the pair closer to confirming a falling wedge formation that has been developing on the daily chart since December 2024.
A falling wedge pattern occurs when the price trends downward within a range defined by two narrowing, descending trend lines.
In an ideal situation, this setup resolves when the price breaks strongly above the upper trendline, aiming to ascend by a distance equivalent to that between the upper and lower trendlines.
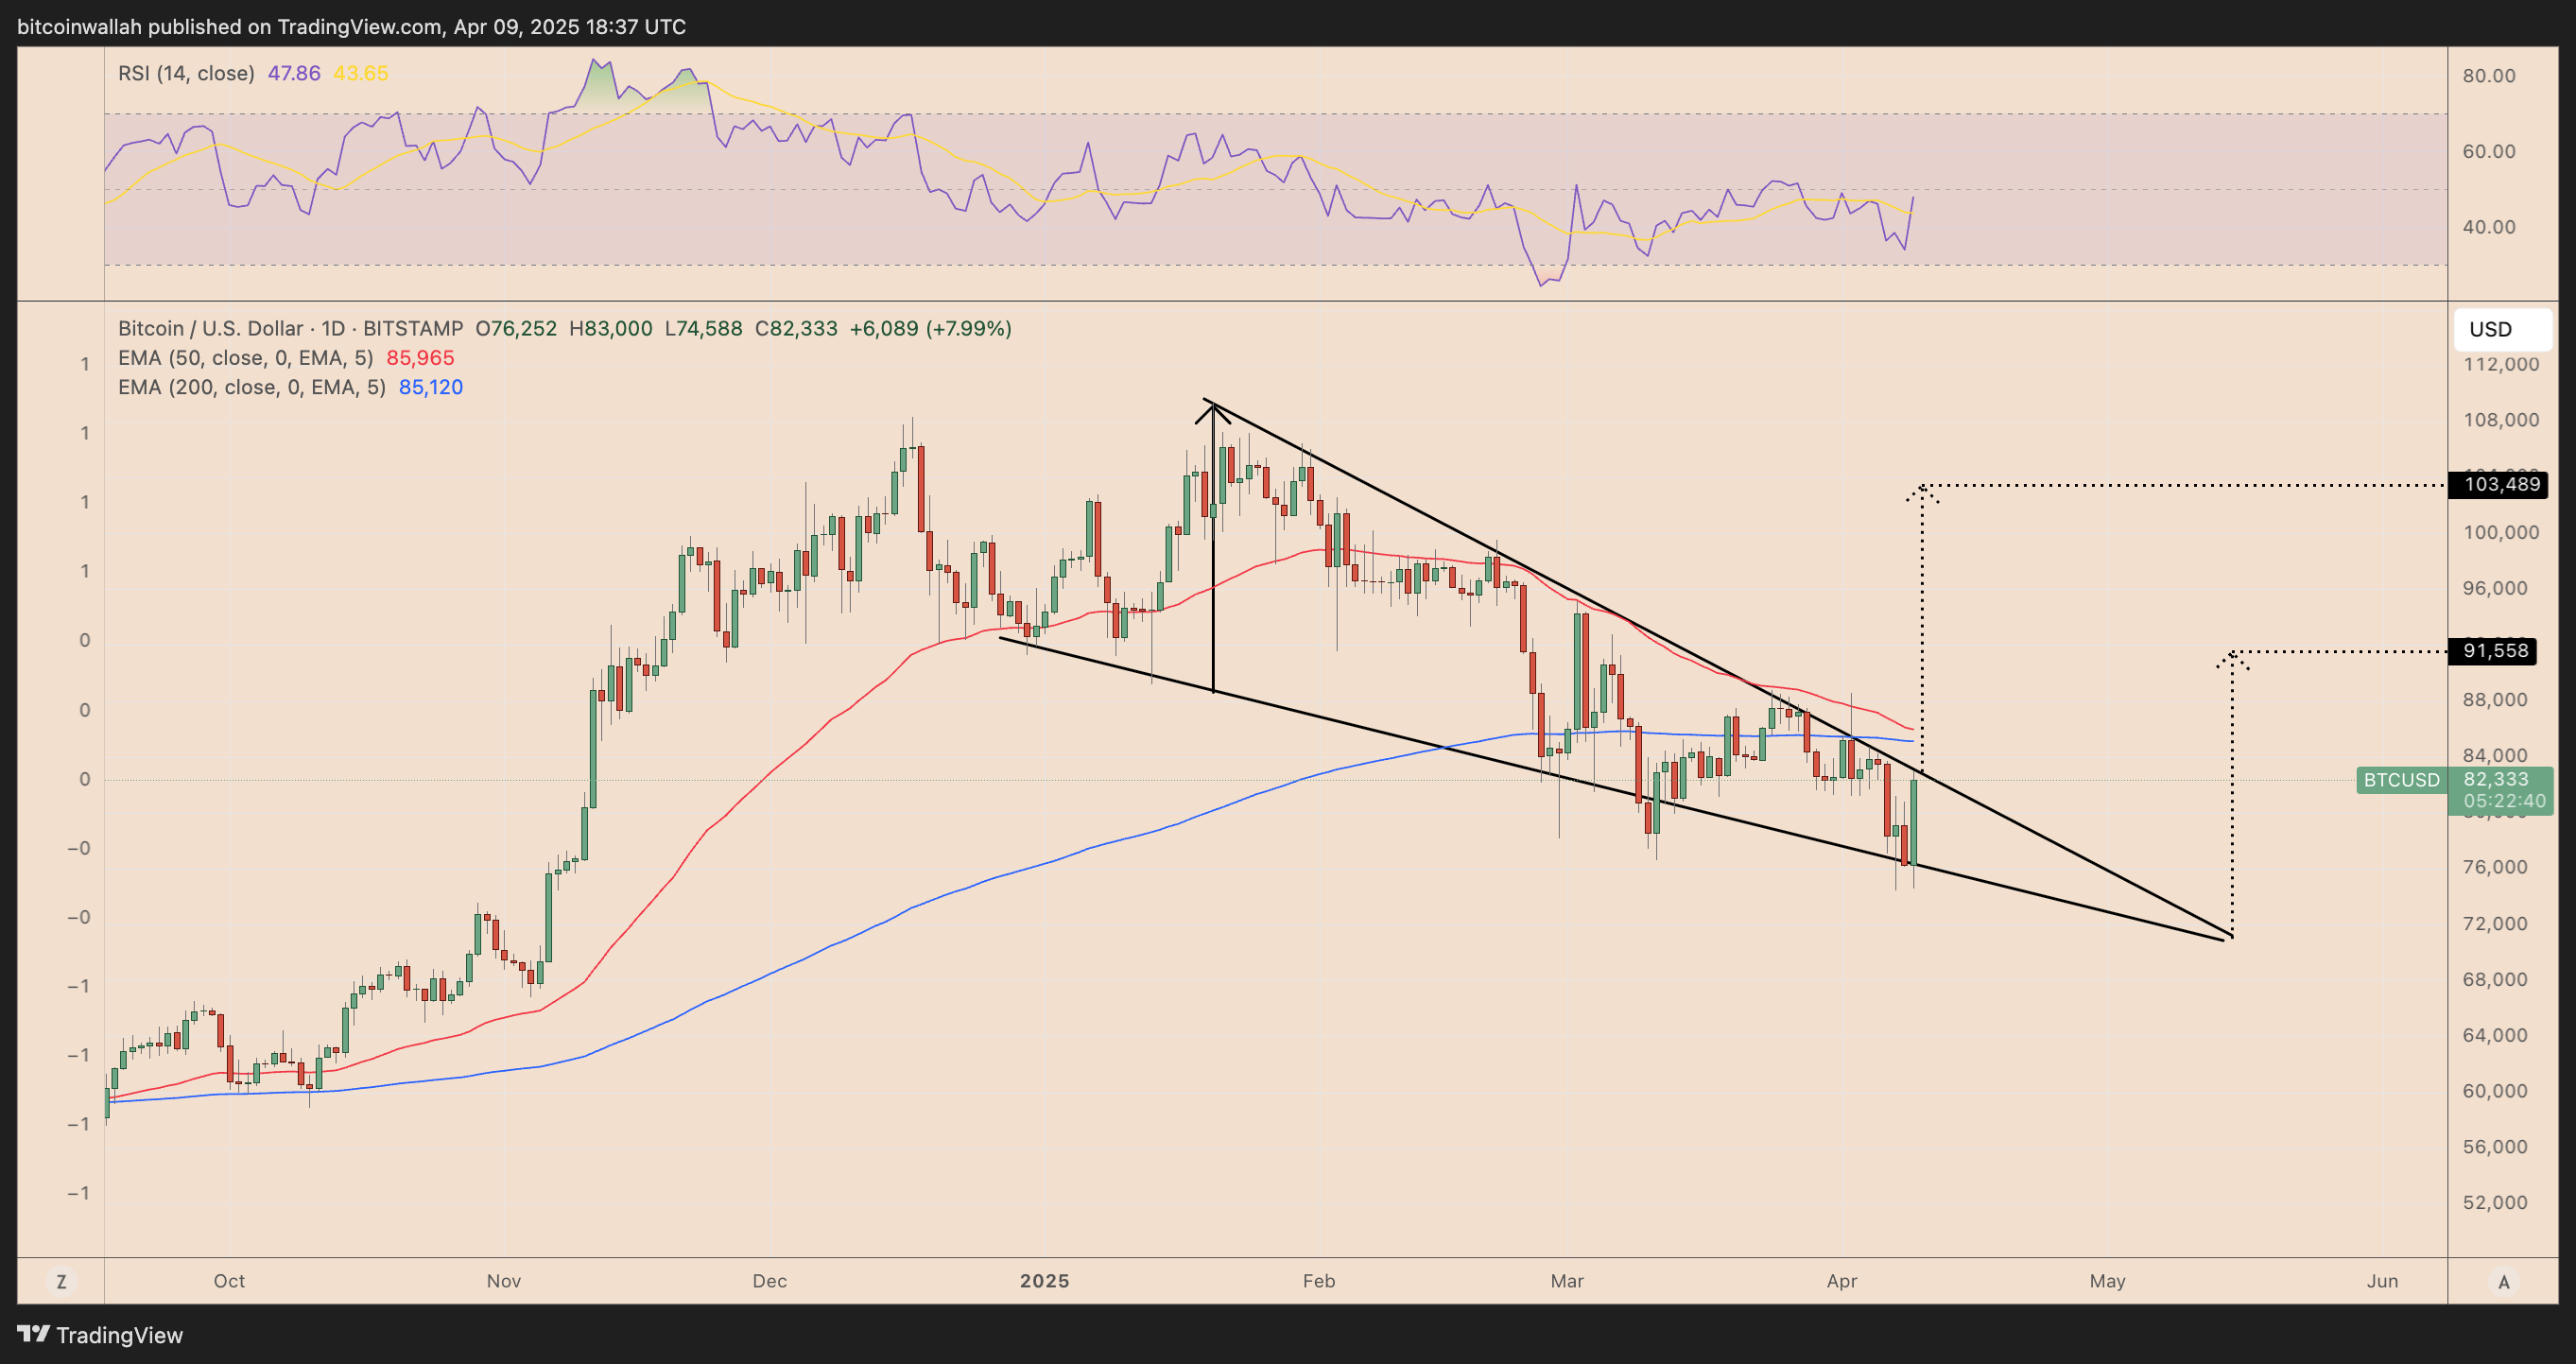
BTC/USD daily price chart featuring falling wedge breakout setup. Source: TradingView
As of April 9, Bitcoin’s price was trading within the falling wedge while targeting a breakout above the upper trendline near $83,000. If confirmed, BTC’s principal upside target by June could reach up to $100,000.
On the flip side, a failure to break above the upper trendline might increase the chances of Bitcoin retreating further within the wedge, potentially dropping toward the apex at approximately $71,100.
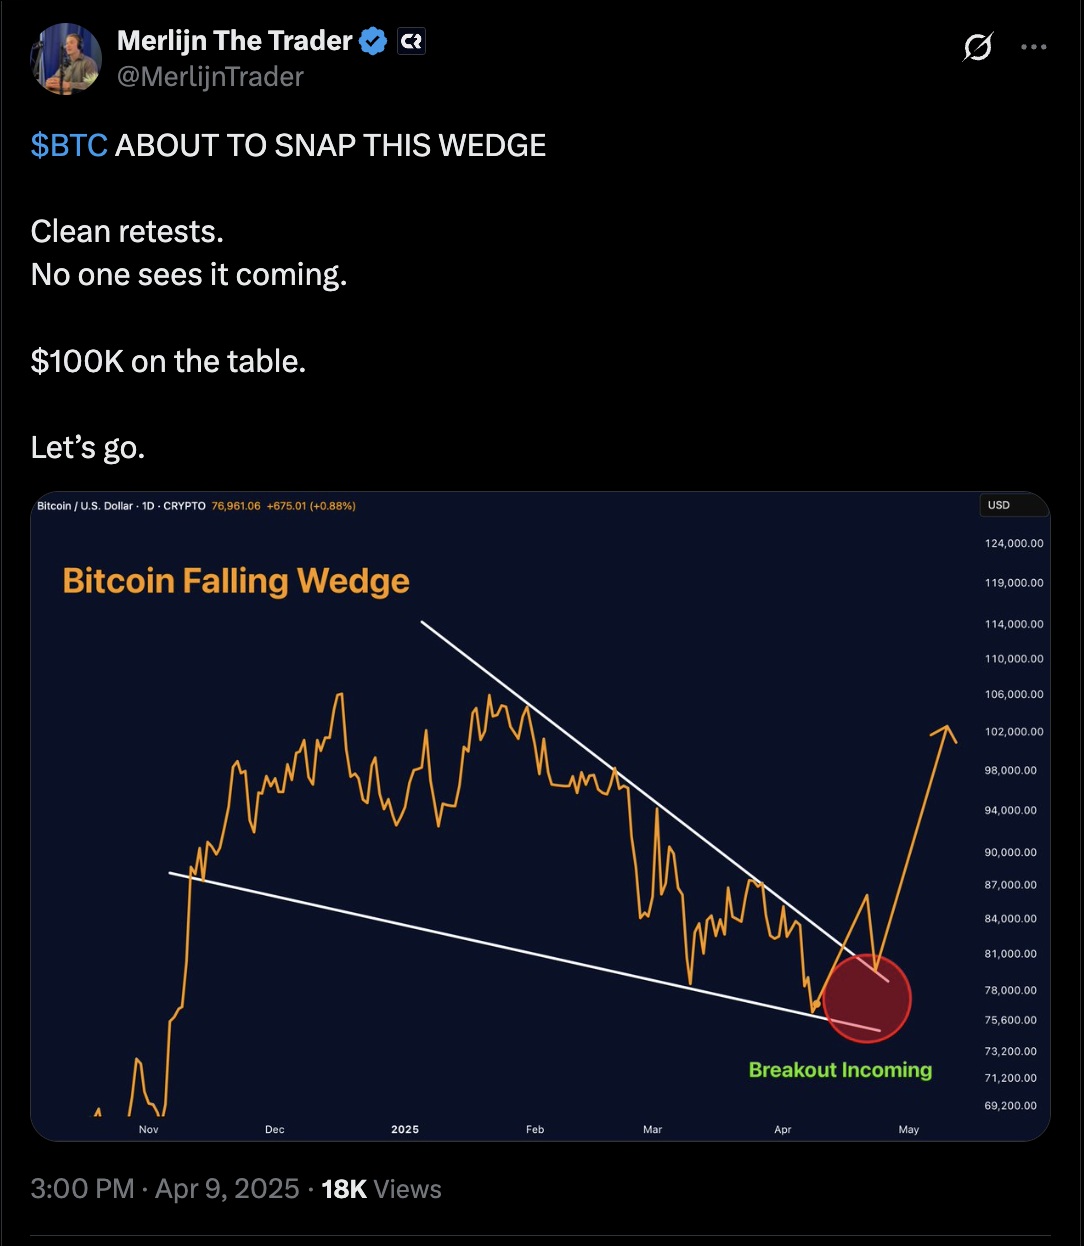
Source: Merlijn The Trader
If a breakout happens after testing the $71,100 level, the most conservative upside target for BTC could still be as much as $91,500.
Onchain data supports a $100,000 Bitcoin outlook
Bitcoin’s recent rally comes right before testing a vital onchain support area between $65,000 and $71,000, further solidifying the cryptocurrency’s bullish perspective toward the $100,000 level.
This $65,000-71,000 range is derived from two key Bitcoin metrics: active realized price ($71,000) and the true market mean ($65,000).
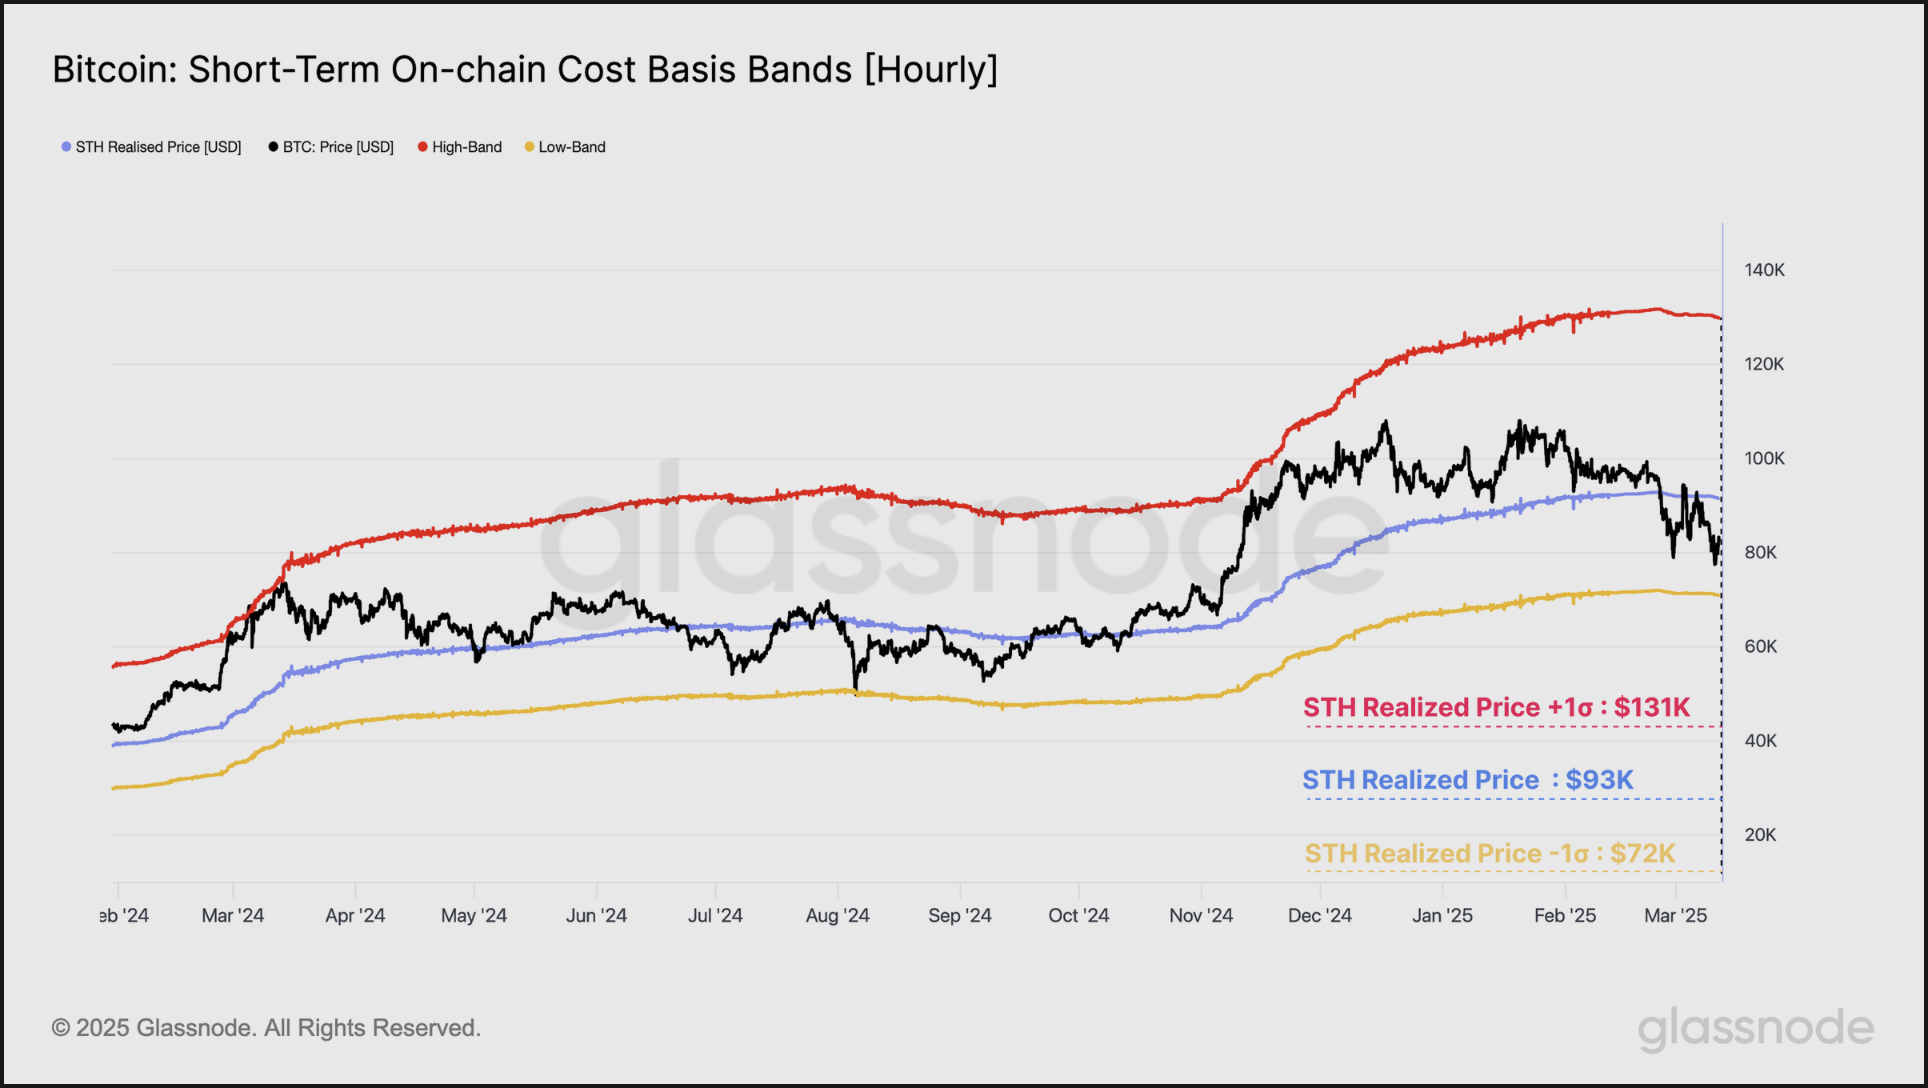
Bitcoin short-term onchain cost basis bands. Source: Glassnode
These metrics capture the average price paid by current, active investors for their Bitcoin, excluding coins that haven’t been in circulation for extended periods or are likely lost, providing a clearer picture of the cost basis for those still active in the market.
Historically, Bitcoin has spent about half its time trading above this price range and half below, indicating market sentiment as per analysts.
“There is now strong agreement among various onchain price models, emphasizing the $65k to $71k price range as a crucial area for bulls to establish enduring support,” they noted in a recent analysis, adding:
“If the price trades significantly below this range, a vast majority of active investors would find themselves at a loss, likely adversely affecting overall sentiment.”
Related: Bitcoin has ‘fully decoupled’ despite tariff turmoil, analyst asserts
Bitcoin’s worst-case scenario points to a decline toward $50,000
Falling below the $65,000-71,000 range could diminish Bitcoin’s chances of revisiting the $100,000 mark anytime soon. Such declines may also lead to the price breaking beneath its 50-week exponential moving average (50-week EMA; the red line).
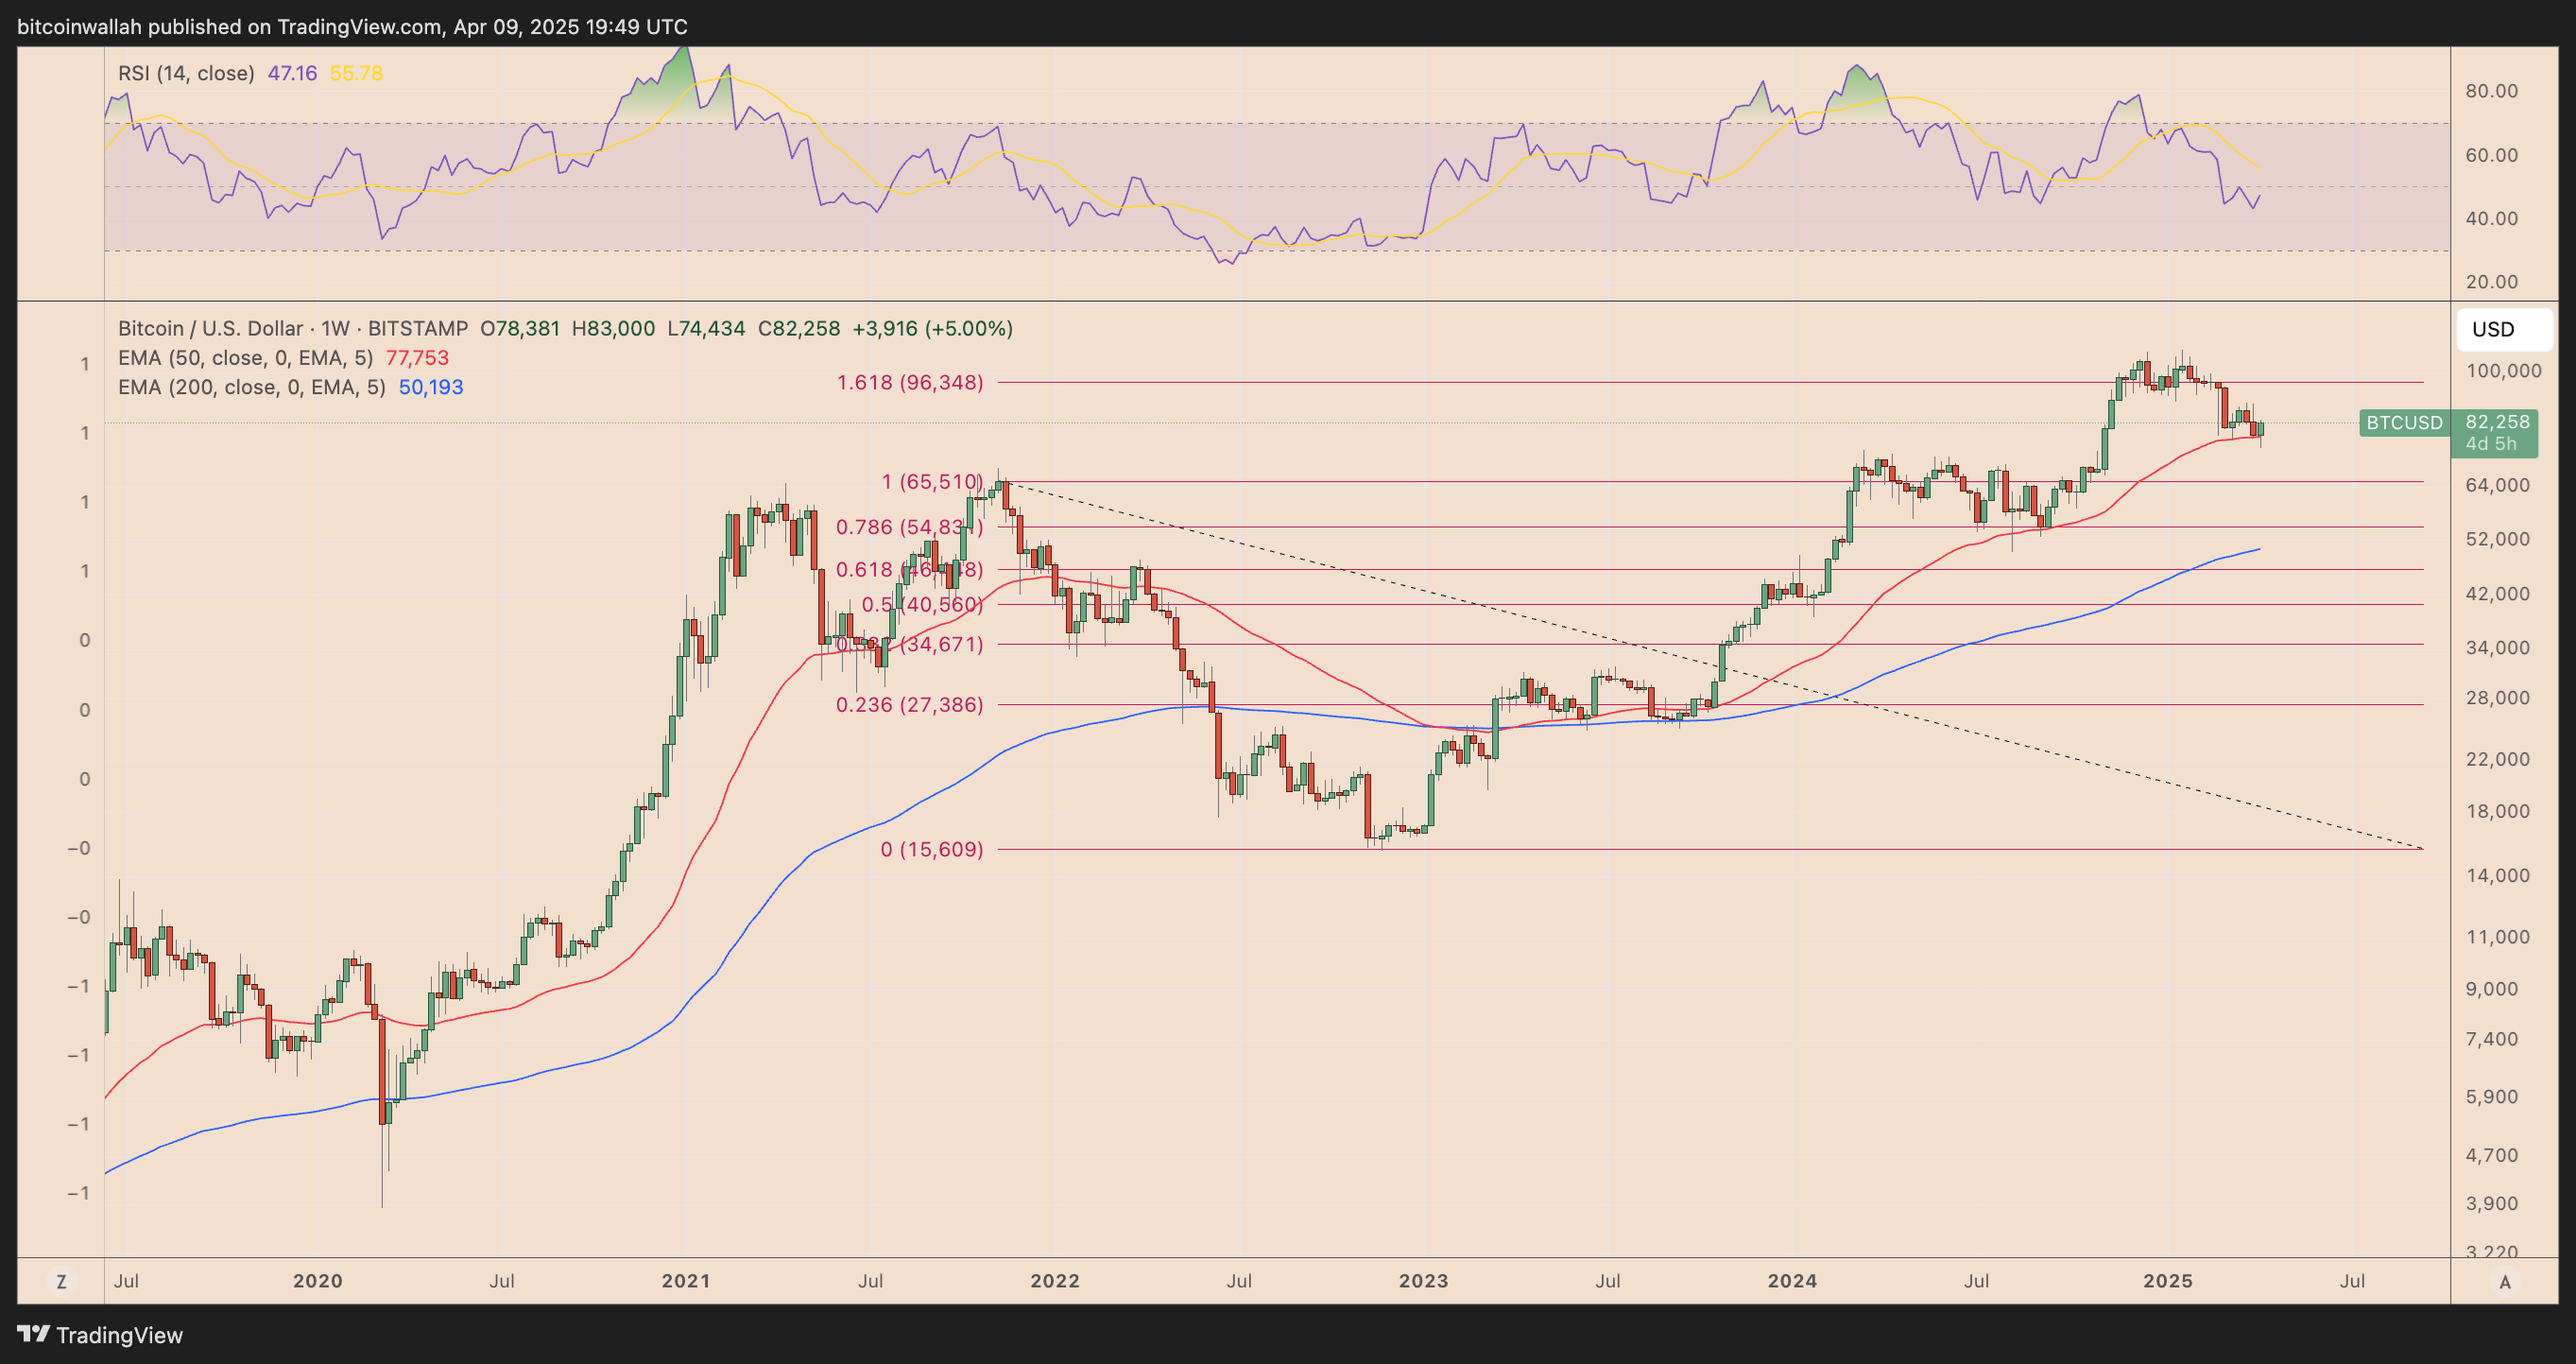
BTC/USD weekly price chart. Source: TradingView
As of April 9, the 50-week EMA stood near $77,760 and historically functions as a dynamic support during bullish phases and a resistance during bearish phases, marking it as an essential trend-defining level.
Failing this support could pave the way for a sharper decline towards the 200-week EMA (the blue line) around $50,000. Previous instances of breaking below the 50-week EMA have led to similar downturns, notably during the bear markets of 2021-2022 and 2019-2020.
Alternatively, a rebound from this point heightens the likelihood of a retest of $100,000.
This article does not contain any investment advice or recommendations. Every investment and trading decision carries risk, and readers should conduct their research before making decisions.